. 2023 Nov;10(31):e2303230.
doi: 10.1002/advs.202303230. Epub 2023 Sep 24.

Cancer-Associated Fibroblast-Induced Remodeling of Tumor Microenvironment in Recurrent Bladder Cancer

Affiliations

Cancer-Associated Fibroblast-Induced Remodeling of Tumor Microenvironment in Recurrent Bladder Cancer

Ting Liang et al. Adv Sci (Weinh). 2023 Nov.

Abstract

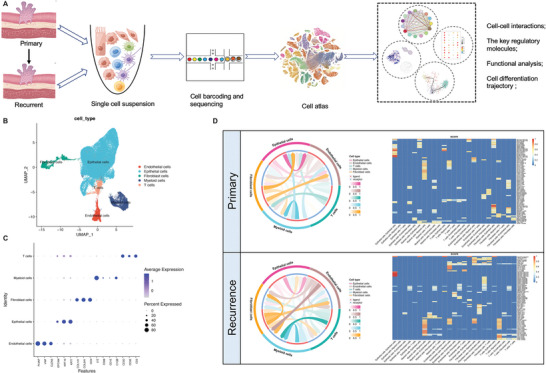
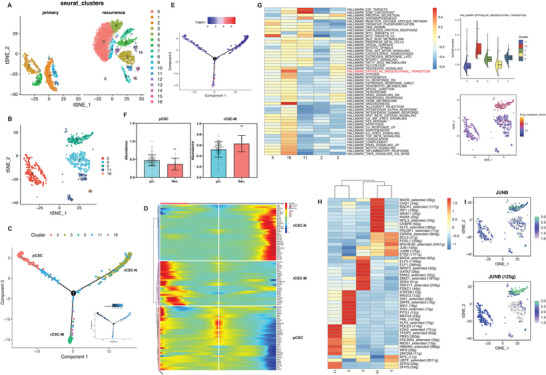
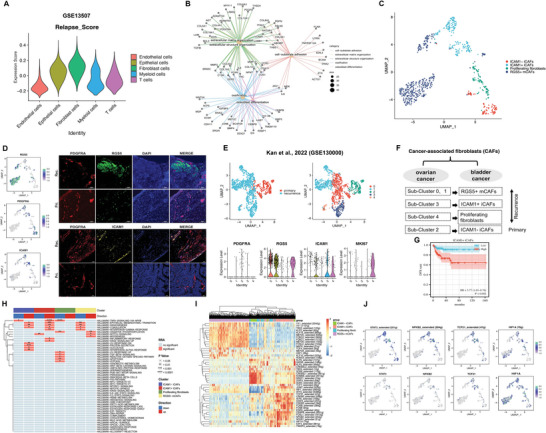
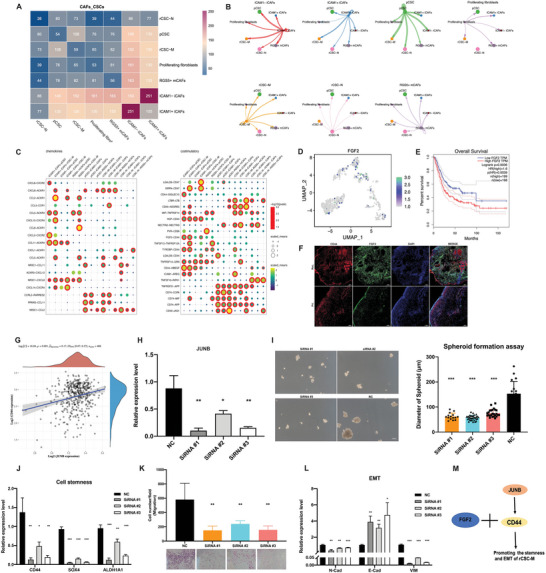
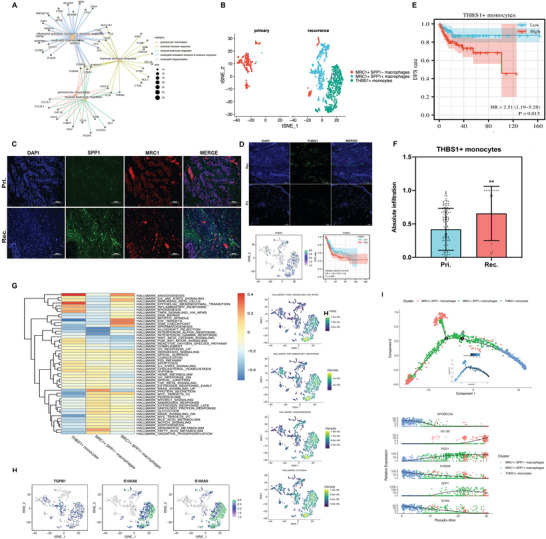
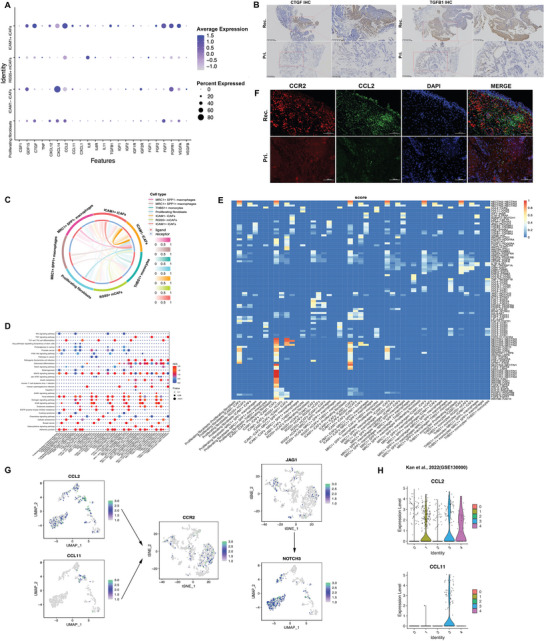
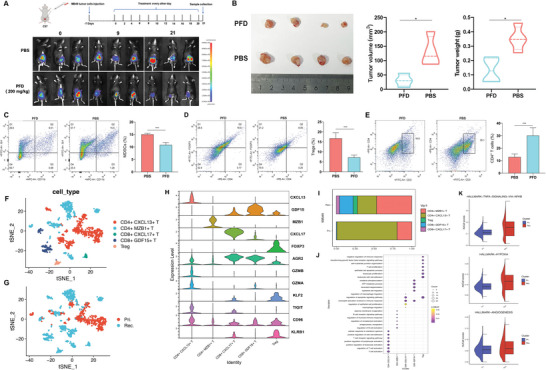
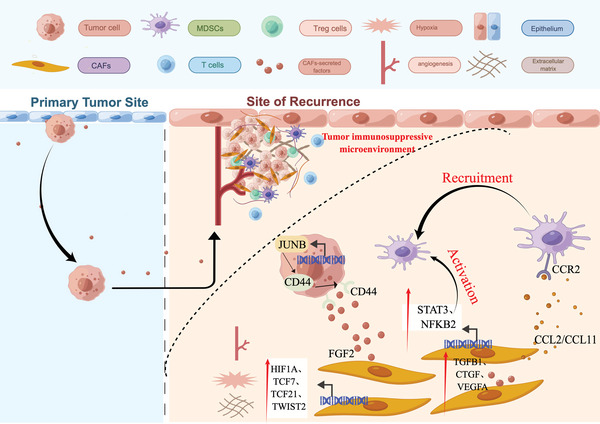
Bladder carcinoma (BC) recurrence is a major clinical challenge, and targeting the tumor microenvironment (TME) is a promising therapy. However, the relationship between individual TME components, particularly cancer-associated fibroblasts (CAFs), and tumor recurrence is unclear. Here, TME heterogeneity in primary and recurrent BC is investigated using single-cell RNA sequence profiling of 62 460 cells. Two cancer stem cell (CSC) subtypes are identified in recurrent BC. An inflammatory CAF subtype, ICAM1+ iCAFs, specifically associated with BC recurrence is also identified. iCAFs are found to secrete FGF2, which acts on the CD44 receptor of rCSC-M, thereby maintaining tumor stemness and epithelial-mesenchymal transition. Additionally, THBS1+ monocytes, a group of myeloid-derived suppressor cells (MDSCs), are enriched in recurrent BC and interacted with CAFs. ICAM1+ iCAFs are found to secrete CCL2, which binds to CCR2 in MDSCs. Moreover, elevated STAT3, NFKB2, VEGFA, and CTGF levels in iCAFs reshape the TME in recurrent tumors. CCL2 inhibition in an in situ BC mouse model suppressed tumor growth, decreased MDSCs and Tregs, and fostered tumor immune suppression. The study results highlight the role of iCAFs in TME cell-cell crosstalk during recurrent BC. The identification of pivotal signaling factors driving BC relapse is promising for the development of novel therapies.

Keywords: bladder carcinoma; cancer-associated fibroblasts; recurrence; single-cell RNA sequencing; tumor microenvironment.


Conflict of interest statement

The authors declare no conflict of interest.

Figures

Figure 1
Figure 1
ScRNA‐seq profiling of diverse cell types in primary and recurrent BC. A) Workflow of the specimens collection, processing, and bioinformatic analysis. B) The UMAP plot demonstrates the main cell types in BC. C) Dot plot showing the expression levels of canonical cell markers in each cell type. D) Cellcell communication analysis in primary and recurrent BC by Cellcall.
Figure 2
Figure 2
Functional analysis of enriched CSC clusters in primary and recurrent BC. A) The t‐SNE plot shows re‐clustering of epithelial cells in the primary and recurrent BC. B) The t‐SNE plot shows CSC types annotated by cluster numbers. C) Pseudotime analysis of CSC subpopulations inferred by Monocle2. D) Heatmap showing the top100 genes expressed with pseudotime trajectory of three CSC subclusters. E) Trajectory of the marker gene TIMP1 expression. F) The infiltrated abundance of CSC clusters in primary and recurrent BC samples. The results presented are the mean ± SD (n = 159). **, p<0.01. G) The pathway enrichment score among different CSC clusters. H) Heatmap showing the area under the curve (AUC) scores of top10 TF motif in CSC clusters by SCENIC. I) tSNE plots of the JUNB expression level (up) and AUC scores (down).
Figure 3
Figure 3
Fibroblast clusters annotation and functional characterization of primary and recurrent BC. A) Identification of relapse‐related signature from published GEO database in diverse cell types. B) Enriched top5 GO_category of DEGs between primary and recurrent BC. C) UMAP plot showing the 4 fibroblast subsets according to different re‐clusters identified. D) UMAP plot and IF confirmed the expression level of the subgroup marker genes. Scale bars, 100 µm. E) UMAP plot showing fibroblasts clusters of published ovarian cancer ScRNA‐seq database (up). Violin plots show the representative markers expression (down). F) Corresponding relationship of different fibroblast subsets among ovarian cancer and bladder cancer. G) KaplanMeier survival curves showing BC patients with low and high infiltration abundance of ICAM+ iCAFs subgroup. H) The pathway enrichment scores by irGSEA per cell between different fibroblast subsets. I) Heatmap of the inferred regulon in each fibroblast subpopulations analyzed by SCENIC. J) UMAP plots showing the expression levels of the representative TF (down) and AUC scores (up).
Figure 4
Figure 4
Cellcell communication of fibroblast and CSC subgroups in primary and recurrent BC and functional verification of the potential role of key genes. A) Heatmap of the number of potential ligand‐receptor pairs between fibroblast and CSC subgroups predicted by CellphoneDB. B) Cellcell interactions between each cell subgroup and others. the link size represents the interaction strengthen. C) Bubble plots show ligand‐receptor pairs of chemokines and costimulatory. D) UMAP plots showing the FGF2 expression level. E) High level of FGF2 predicted poor prognosis in TCGA BC cohort. F) Detection of CD44 and FGF2 in primary and recurrent tumor tissues by IF staining. Scale bars, 200 µm. G) Correlation between the expression level of CD44 and JUNB in TCGA BC cohort. Coefficient was calculated with spearman correlation analysis, p < 0.05. H) qRT‐PCR showing JUNB level in UMUC3 cells transduced with siRNA control or siRNA targeting JUNB. I) Representative images of colony formation (size) of UMUC3 cells after transduction. Scale bars, 100 µm. Statistical results of the colony formation assay on the right side (n≥15). J) qRT‐PCR showing levels of cell stemness‐related genes after transduction. K) The effect of JUNB on cell migration was examined in UMUC3 cells by transwell filter assay. L) qRT‐PCR showing levels of EMT‐related genes after transduction. The results presented are the mean ± SD (n = 3). *, p < 0.05; **, p<0.01; ***, p < 0.001. M) The schematic diagram of regulatory network.
Figure 5
Figure 5
The role of myeloid cells in the immune functions of the recurrent BC. A) Enriched top5 GO_category of DEGs between primary and recurrent BC‐derived myeloid cells. B) tSNE project of myeloid cells, showing the composition of 3 subgroups derived from the primary and recurrent BC. C) IF confirmed the expression level of marker genes SPP1, MRC1. Scale bars, 100 µm. D) IF staining, tSNE plots and KaplanMeier DSS curves for THBS1 level. Scale bars, 100 µm. E) KaplanMeier survival curves showing BC patients with low and high infiltration abundance of THBS1+ monocytes subgroup. F) The infiltrated abundance of THBS1+ monocytes in primary and recurrent BC samples. The results presented are the mean ± SD (n = 153). **, p<0.01. G) Differences in pathway activities among different myeloid cells subtypes. H) Feature plots showing the normalized expression of related factors secreted by MDSCs. I) Plot showing pseudotime ordering of different myeloid cells subtypes by Monocle2.
Figure 6
Figure 6
The role of fibroblast clusters in cell communication with myeloid cells subtypes. A) Dot plot shows the expression level of cytokines across fibroblast subtypes. B) IHC staining show expression level of CTGF and TGFB1 in primary and recurrent sample. Scale bars, 400 µm or 200 µm. C) cellcell communication between fibroblast and myeloid cells subtypes by CellCall. D) Bubble plot showing the pathway activity scores of cell interactions. E) Heatmap plot of cellcell communication scores for ligand‐receptor pairs. F) IF staining shows the representative CCL2‐CCR2 pair levels in primary and recurrent sample. Scale bars, 100 µm. G) Feature plots showing the expression levels of representative ligand‐receptor pairs. H) Violin plot indicating the expression of potential marker genes in fibroblasts clusters of published ovarian cancer ScRNA‐seq database.
Figure 7
Figure 7
CCL2 contributes to tumorigenesis and immunosuppressive characteristics in recurrent BC. A) In vivo bioluminescence imaging of C57 mice bearing MB49 cells co‐inoculated tumor treated with CCL2 inhibitor (PFD) and control (PBS). B) Representative tumor pictures were presented, and tumor volume and tumor weight at the endpoint were measured (n = 4). *, p < 0.05. Flow cytometry assay and quantitative analysis of tumor‐infiltrated MDSCs C) Tregs cells D) and CD4+ T cells E) after different treatments. The results presented are the mean ± SD (n = 3). ***, p < 0.001. Feature plots of T cells, colored by the identified cell subpopulations F) and tumor origin G). H) Violin plots show expression level of marker genes across T cell subtypes. I) Average proportion of T cell subtypes in primary and recurrent BC. J) The potential biological functions of T cell subclusters were evaluated by GO analyses. K) Hallmarker gene sets enrichment analysis of T cells in primary and recurrent tumors.
Figure 8
Figure 8
Diagram illustrating the predicted regulatory network of recurrent BC TME centered on iCAF subtype by Figdraw (www.figdraw.com).

References

    1. Teoh J. Y., Huang J., Ko W. Y., Lok V., Choi P., Ng C. F., SenGupta S., Mostafid H., Kamat A. M., Black P. C., Shariat S., Babjuk M., Wong M. C., Eur. Urol. 2020, 78, 893. - PubMed
    1. Antoni S., Ferlay J., Soerjomataram I., Znaor A., Jemal A., Bray F., Eur. Urol. 2017, 71, 96. - PubMed
    1. Lerner S. P., McConkey D. J., Hoadley K. A., Chan K. S., Kim W. Y., Radvanyi F., Höglund M., Real F. X., Bladder Cancer 2016, 2, 37. - PMC - PubMed
    1. Yuan Y., Jiang Y. C., Sun C. K., Chen Q. M., Oncol. Rep. 2016, 35, 2499. - PubMed
    1. Tian Y., Li Q., Yang Z., Zhang S., Xu J., Wang Z., Bai H., Duan J., Zheng B., Li W., Cui Y., Wang X., Wan R., Fei K., Zhong J., Gao S., He J., Gay C. M., Zhang J., Wang J., Tang F., Signal Transduct. Target. Ther. 2022, 7, 346. - PMC - PubMed

LinkOut - more resources