. 2023 Sep;4(9):1345-1361.
doi: 10.1038/s43018-023-00630-y. Epub 2023 Sep 21.

Vepafestinib is a pharmacologically advanced RET-selective inhibitor with high CNS penetration and inhibitory activity against RET solvent front mutations

Affiliations

Vepafestinib is a pharmacologically advanced RET-selective inhibitor with high CNS penetration and inhibitory activity against RET solvent front mutations

Isao Miyazaki et al. Nat Cancer. 2023 Sep.

Erratum in

Abstract

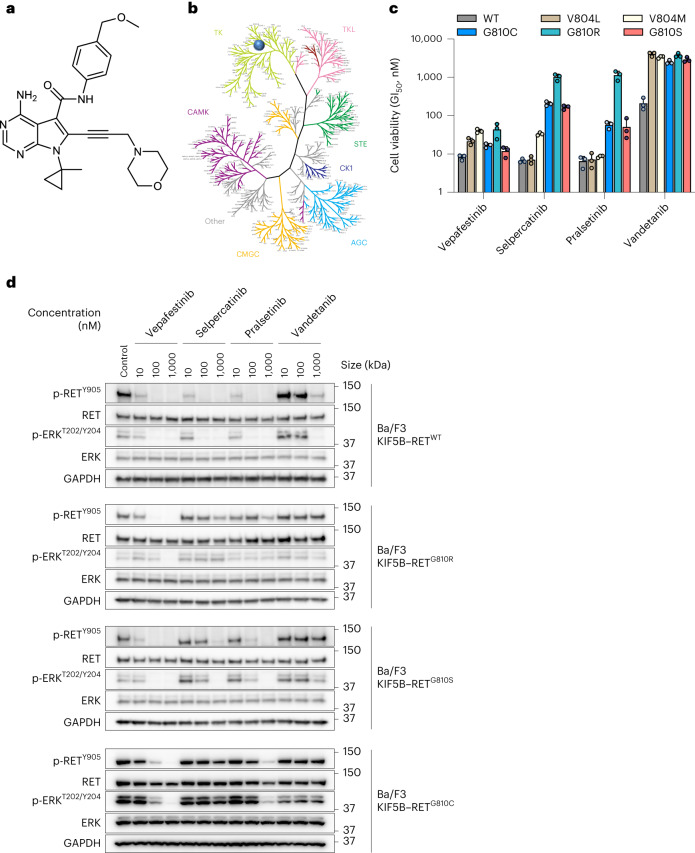
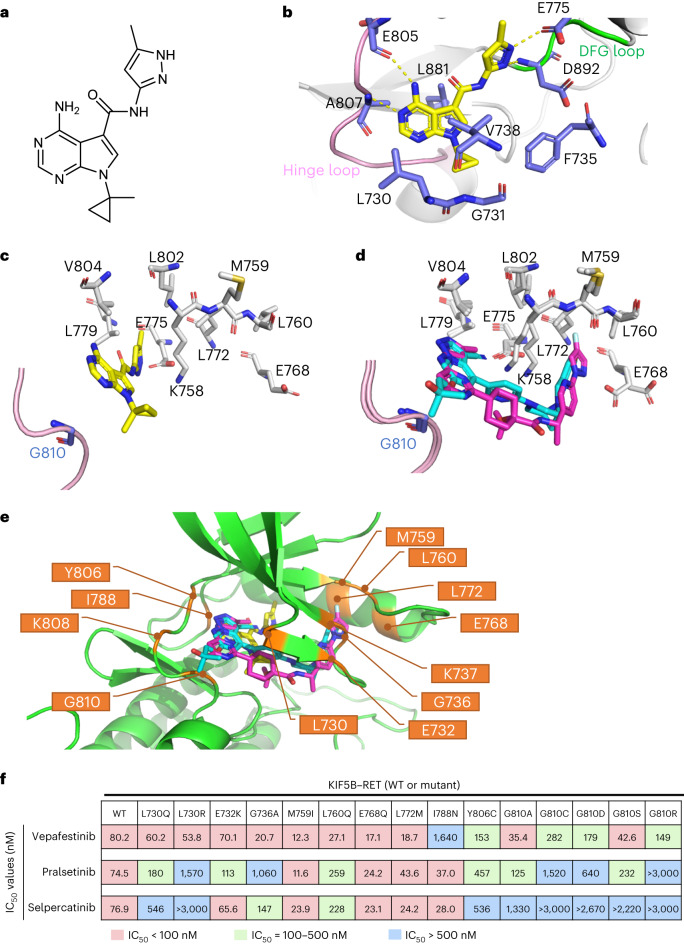
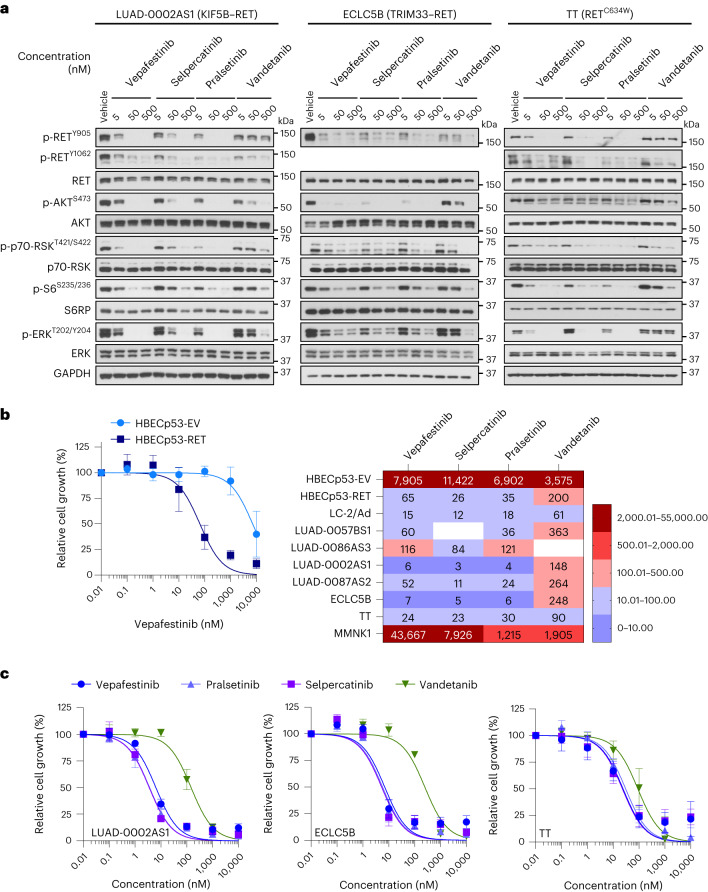
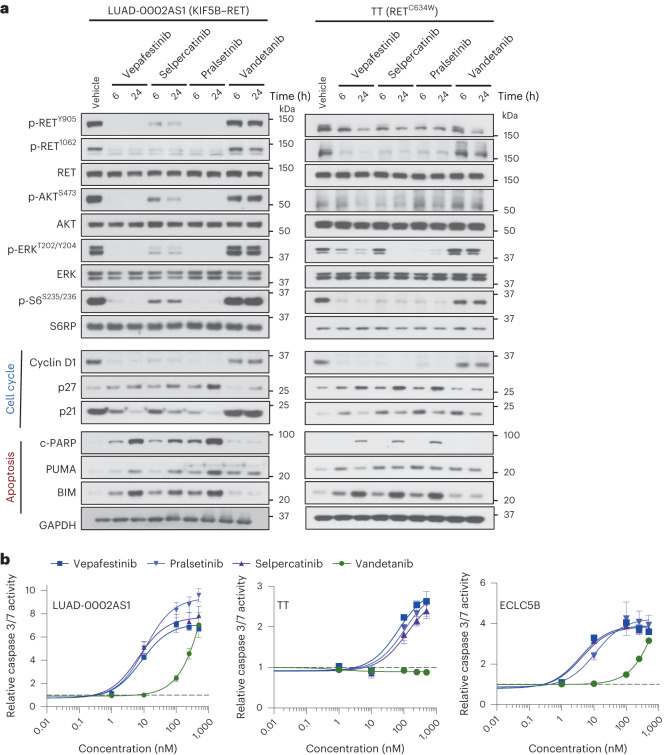
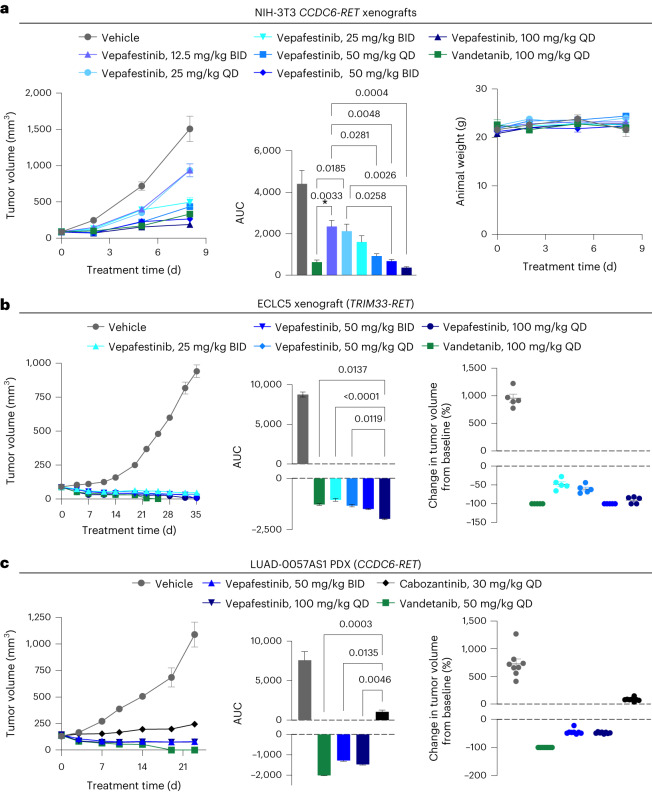
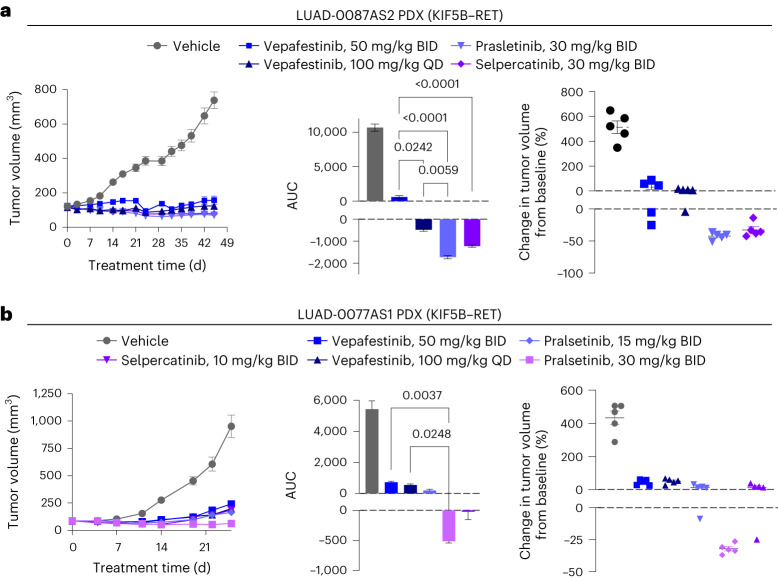
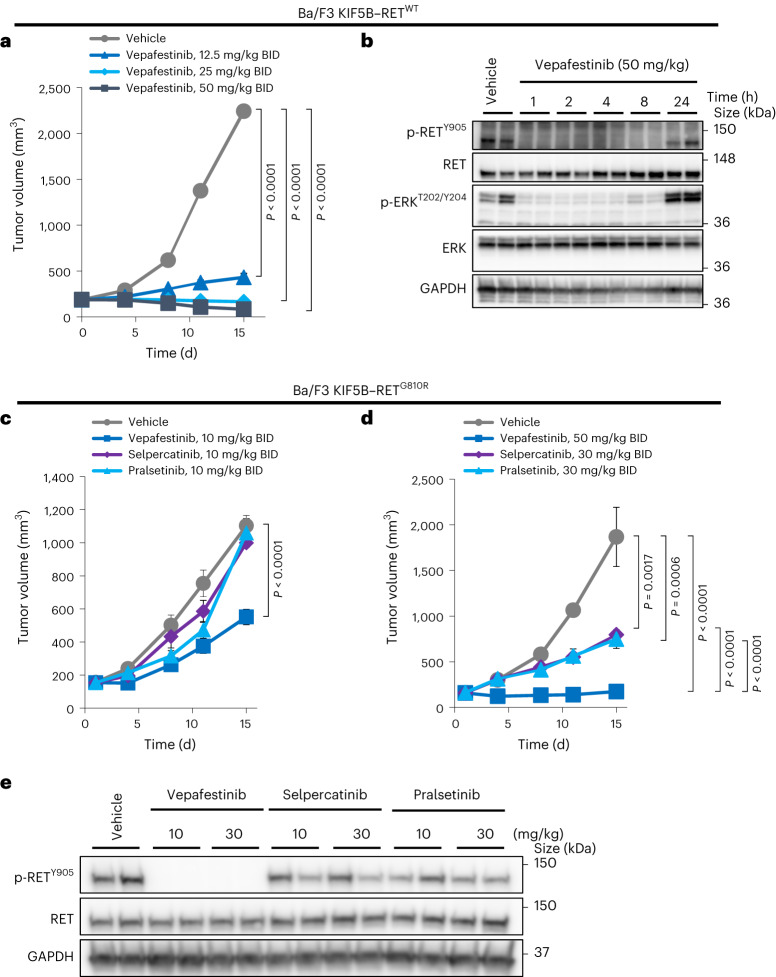
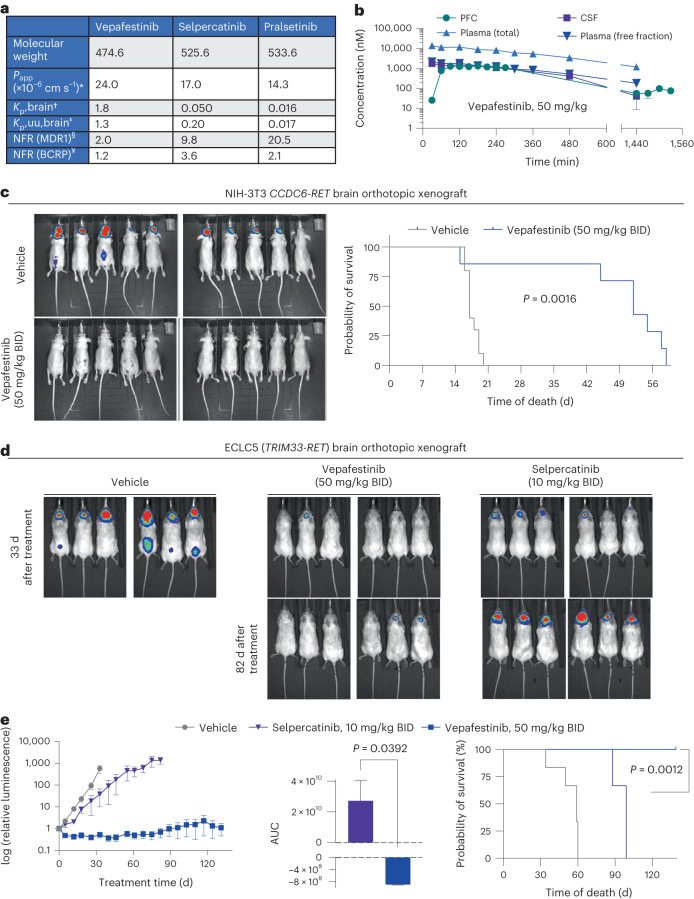
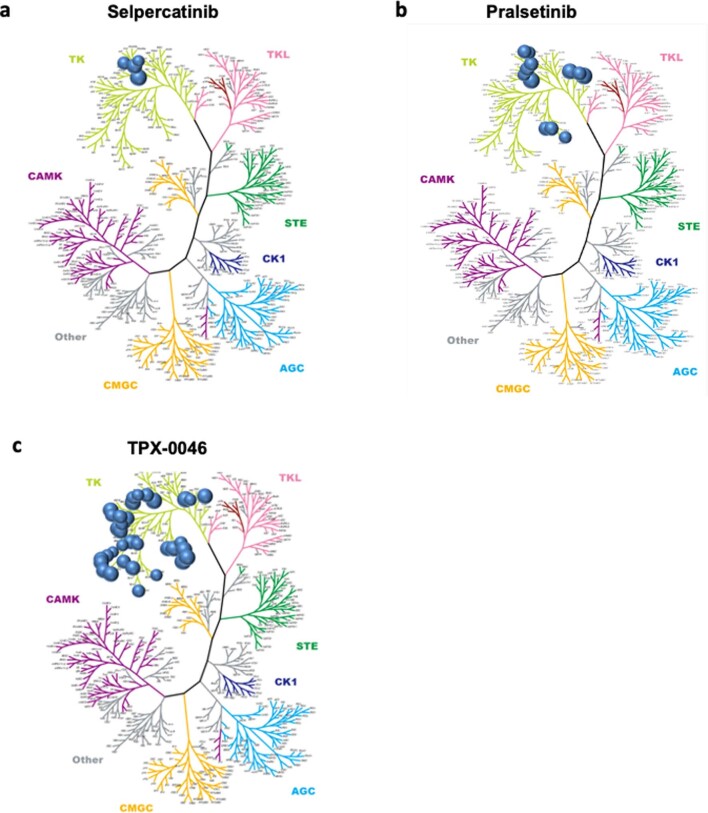
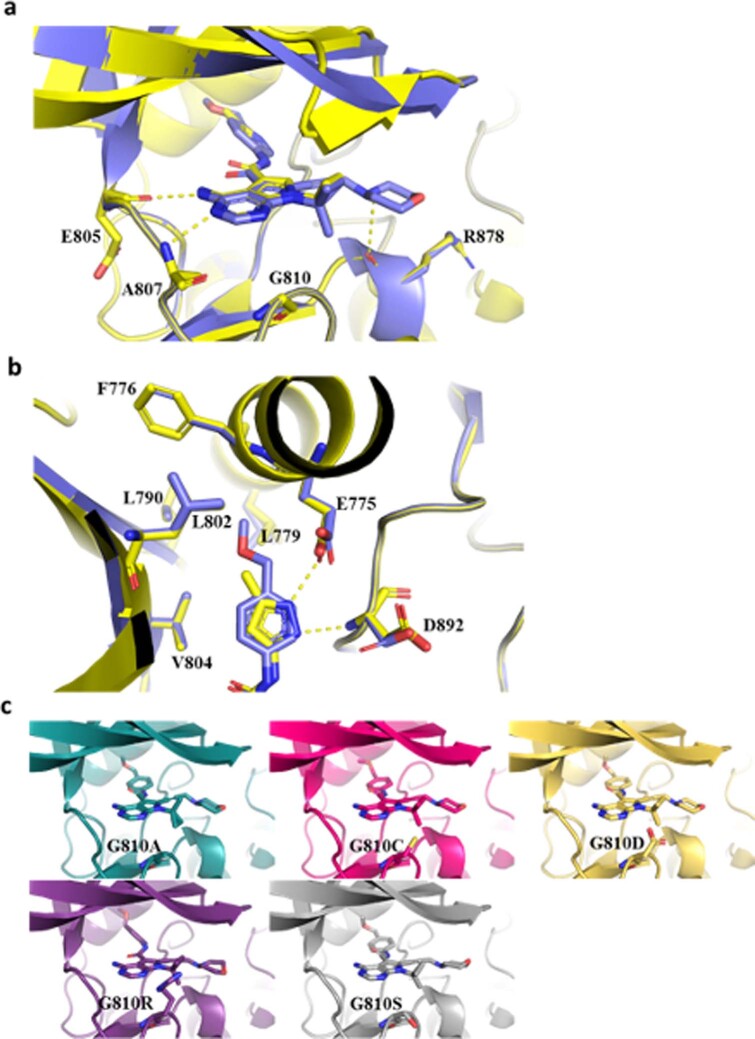
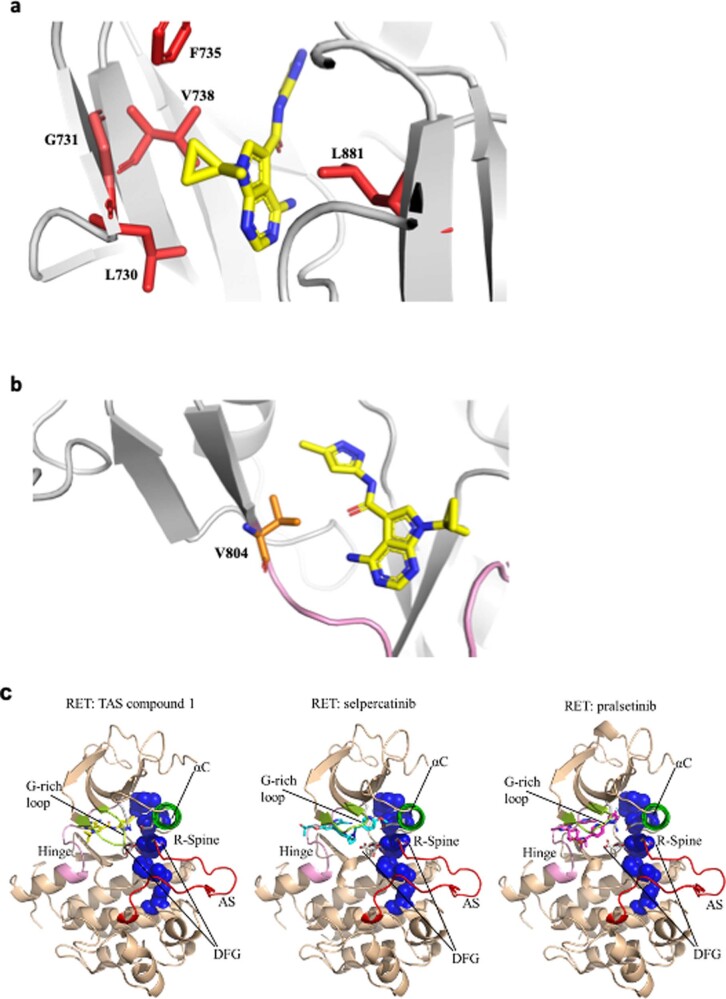
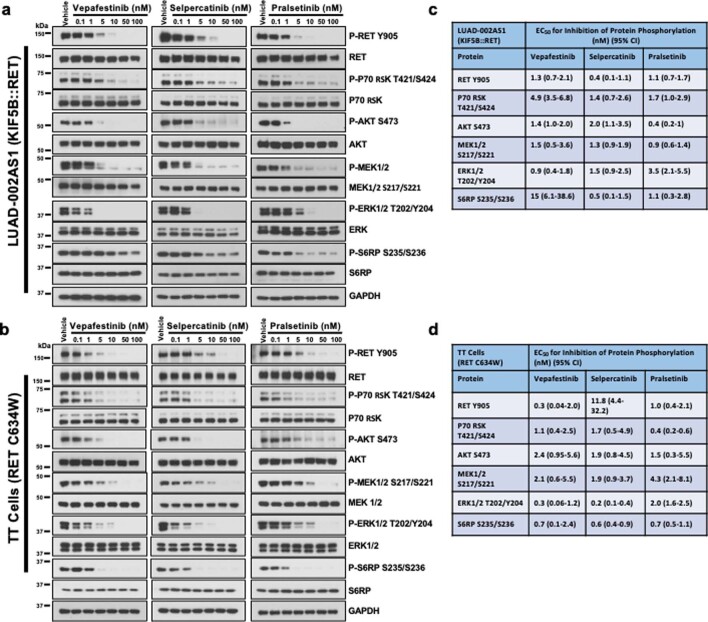
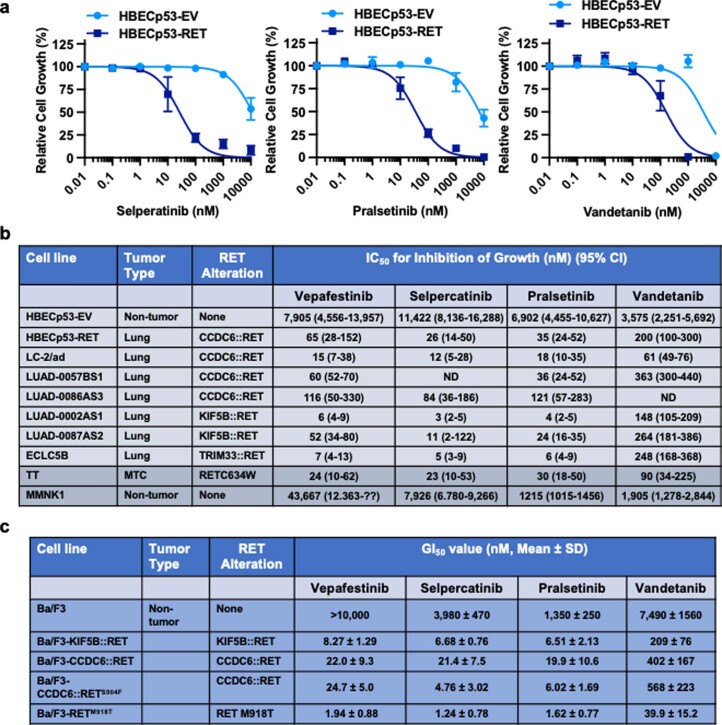
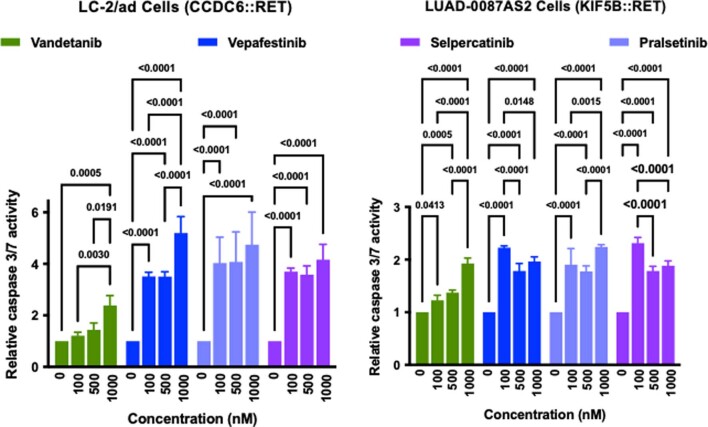
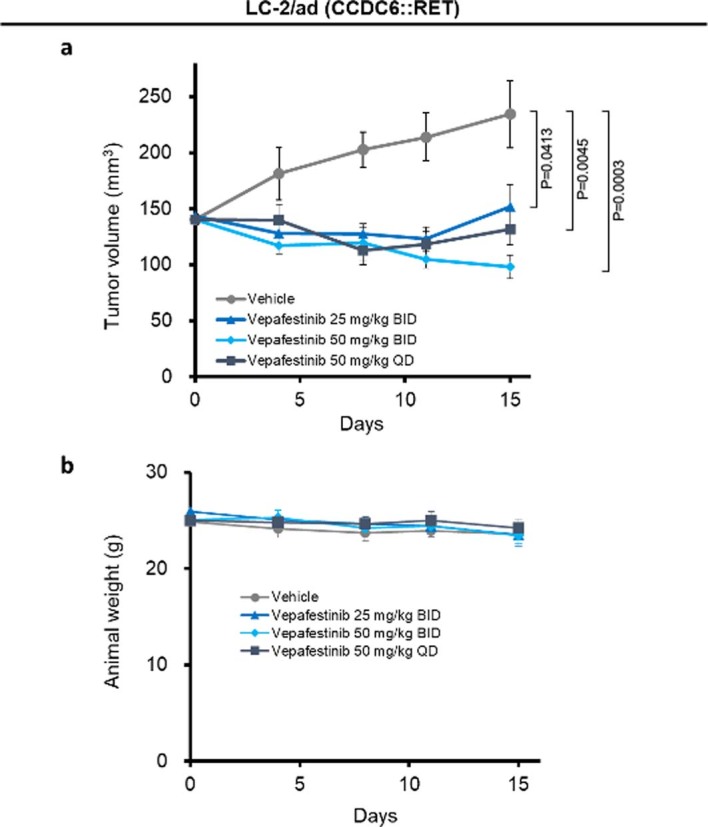
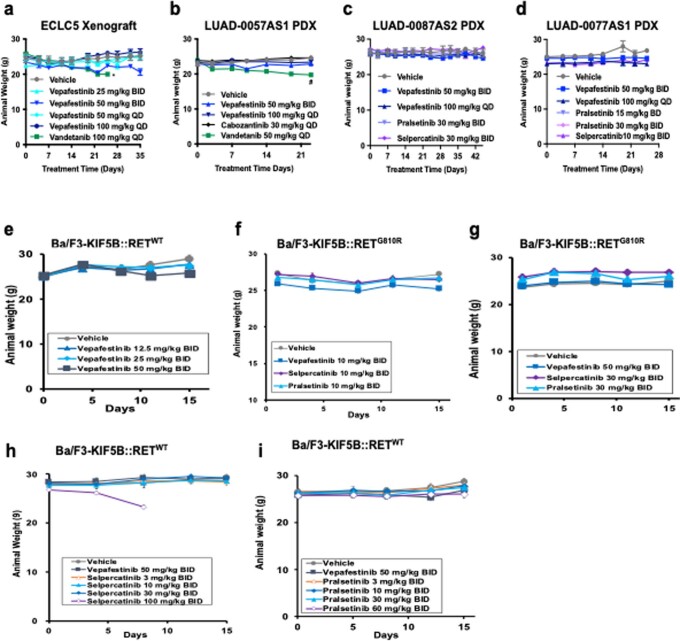
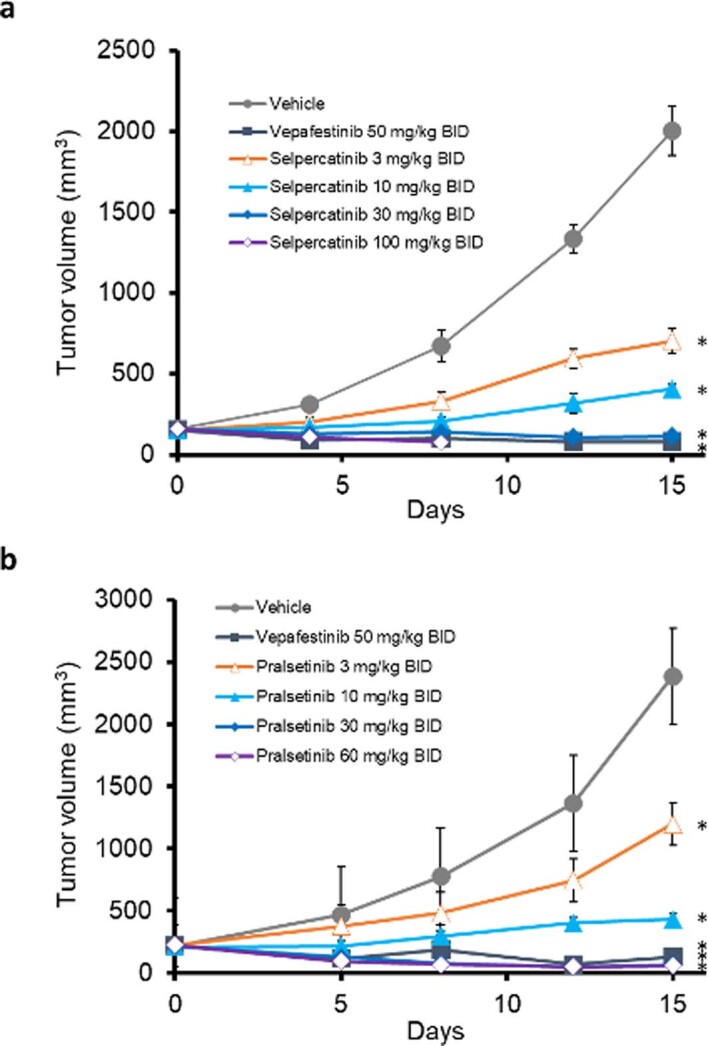
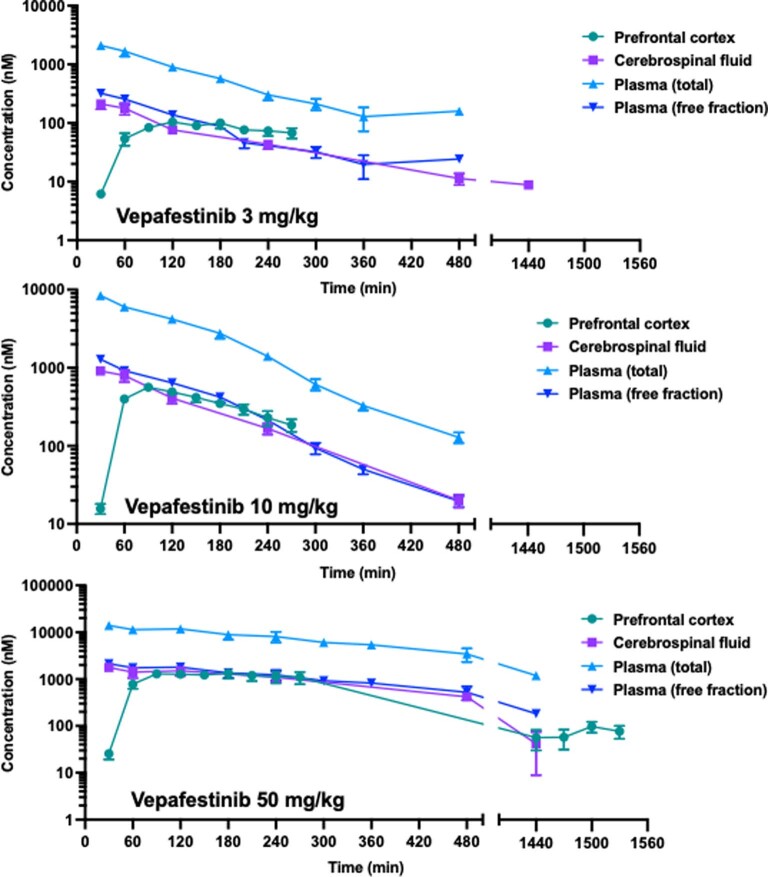
RET receptor tyrosine kinase is activated in various cancers (lung, thyroid, colon and pancreatic, among others) through oncogenic fusions or gain-of-function single-nucleotide variants. Small-molecule RET kinase inhibitors became standard-of-care therapy for advanced malignancies driven by RET. The therapeutic benefit of RET inhibitors is limited, however, by acquired mutations in the drug target as well as brain metastasis, presumably due to inadequate brain penetration. Here, we perform preclinical characterization of vepafestinib (TAS0953/HM06), a next-generation RET inhibitor with a unique binding mode. We demonstrate that vepafestinib has best-in-class selectivity against RET, while exerting activity against commonly reported on-target resistance mutations (variants in RETL730, RETV804 and RETG810), and shows superior pharmacokinetic properties in the brain when compared to currently approved RET drugs. We further show that these properties translate into improved tumor control in an intracranial model of RET-driven cancer. Our results underscore the clinical potential of vepafestinib in treating RET-driven cancers.


Conflict of interest statement

I.O., A.J.W.L., L.D., I.K., M.S.M., K. Ishizawa, M.V., Y.C.L., R.C., T.Z., R.I.K., S.K., Q.C., E.C., E.d.S. and M.A.D. report no potential conflict of interest. M.L. has received advisory board compensation from Merck, Bristol Myers Squibb, Takeda, Bayer, Lilly Oncology, Janssen and Paige.AI. In addition, research grants unrelated to the current study were obtained from Merus, Loxo Oncology and Elevation Oncology. Research funding from Helsinn Healthcare partially supported this study. R.S. has received research support from Merus, Loxo Oncology and Elevation Oncology, unrelated to the current study. I.M., K. Ishida, M.K., T.S., K.W., H.F., Y.Y., K.F., S.O., W.Y., R.T. and Y.I. are employees of Taiho Pharmaceutical. E.L., C.G. and A.B. are employees of Helsinn Healthcare.

Figures

Fig. 1
Fig. 1. Structure and biochemical characterization of vepafestinib (TAS0953/HM06).
a, Chemical structure of vepafestinib. b, Kinase selectivity profile of vepafestinib across 255 kinases. Enzyme activities were assessed in the presence of 23 nM vepafestinib, which is approximately 70-fold higher than the IC50 for inhibition of RETWT. Only one kinase (RET) was inhibited by >50% and is shown as a blue circle on the kinome tree. TK, tyrosine kinase; TKL, tyrosine kinase-like; CAMK, calcium/calmodulin-dependent protein kinase; STE, homologs of yeast sterile 7, sterile 11 and sterile 20 kinases; CK1, casein kinase 1; CMGC, cyclin-dependent kinases, mitogen-activated protein kinases, glycogen synthase kinases and cell division control protein-like kinases; AGC, protein kinase A, protein kinase G and protein kinase C families. c, GI50 (50% growth inhibition) values of vepafestinib, in comparison to other RET inhibitors on proliferation of Ba/F3 cells expressing KIF5B–RETWT or KIF5B–RET harboring mutations in the solvent front of the kinase domain (G810R, G810S or G810C) or the gatekeeper domain (V804L or V804M). Data represent the mean ± s.d. of three independent experiments. d, Effect of vepafestinib on phosphorylation of RET and downstream signals in Ba/F3 cells expressing KIF5B–RETWT, KIF5B–RETG810R, KIF5B–RETG810S or KIF5B–RETG810C. Cells expressing KIF5B–RETWT, KIF5B–RETG810R, KIF5B–RETG810S or KIF5B–RETG810C were treated with the indicated concentrations of each drug for 1 h before preparation of cell extracts for western blotting. Representative immunoblots from two independent experiments are shown. Glyceraldehyde-3-phosphate dehydrogenase (GAPDH) was used as a loading control. p, phosphorylated. Source data
Fig. 2
Fig. 2. X-ray crystallography of RET complexed with RET-selective inhibitors.
a, Chemical structure of TAS-C1. b, X-ray structure of RET complexed with TAS-C1. c, View from the solvent front area in the co-crystal structure of RET with TAS-C1. d, Overlay of co-crystal structures of selpercatinib and pralsetinib bound to RET. The viewpoint is the same as in c. The binding compounds are shown as stick models, with yellow (TAS-C1), cyan (selpercatinib) and magenta (pralsetinib) representing each RET inhibitor. e, Positions of the amino acid residues where mutagenesis was performed for in-cell western assays are shown in the co-crystal structure of RET with TAS-C1, overlaid with selpercatinib and pralsetinib. f, IC50 values calculated from in-cell western assays of Jump-In GripTite HEK293 cells transiently expressing WT or mutant KIF5B–RET. Cells were treated with the indicated compounds for 1 h. The assay was performed in triplicate, and mean IC50 values are represented with the color codes shown at the bottom.
Fig. 3
Fig. 3. Vepafestinib inhibits transmission of signals and blocks growth of cells with RET alterations.
a, LUAD-0002AS1, ECLC5B and TT cells were serum starved for 24 h and then treated with the indicated concentrations of vepafestinib (TAS0953/HM06), selpercatinib, pralsetinib or vandetanib for 2 h. Following treatment, whole-cell extracts were prepared and subjected to western blotting analysis. Representative immunoblots from two independent experiments are shown. GAPDH was used as a loading control. RSK, ribosomal protein S6 kinase; S6RP, S6 ribosomal protein. b,c, Cells were plated in 96-well plates and treated for 96 h with the inhibitors shown. The number of viable cells was assessed using alamarBlue. b, Viability curves for control HBEC cells (HBECp53-EV) and HBEC cells with the CCDC6-RET fusion (HBECp53-RET) are shown at the left. Results are the mean ± s.e.m. of four independent experiments. Data were analyzed by non-linear regression, and IC50 values were estimated by curve fitting. A heatmap of the IC50 values is shown on the right. Missing values indicate that the experiment was not done. c, Viability curves for LUAD-0002AS1 (n = 3), ECLC5B (n = 3) and TT (n = 5) cells. Results are mean ± s.e.m. Each condition was assayed in triplicate for all viability studies. Source data
Fig. 4
Fig. 4. Vepafestinib modulates expression of cell cycle and apoptosis markers.
a, LUAD-0002AS1 and TT cells were serum-staved for 24 h and then treated with 100 nM vepafestinib (TAS0953/HM06), selpercatinib, pralsetinib or vandetanib for 24 h. Following treatment, whole-cell extracts were prepared and subjected to western blotting analysis. Representative immunoblots from two independent experiments are shown. GAPDH was used as a sample-processing control. b, Cells were treated with the indicated RET inhibitors for 48 h before measuring caspase 3 and 7 enzymatic activity in cell homogenates. Results represent the mean ± s.d. of two independent experiments in which each condition was assayed in triplicate. Source data
Fig. 5
Fig. 5. Efficacy of vepafestinib in RET fusion-dependent disease models in vivo.
Cell lines (NIH-3T3 expressing CCDC6–RET, ECLC5) or PDX tumors were implanted into subcutaneous flanks of female mice and treated as indicated. a, NIH-3T3-RET xenograft (athymic nude mice). b, ECLC5 xenograft (NOD–SCID gamma (NSG) mice). c, LUAD-0057AS1 PDX. ac, Left, time course of treatment. Data represent mean ± s.e.m. There were five (NIH-3T3-RET and ECLC5 xenografts) or eight (LUAD-0057AS1) animals per group. ac, Middle, AUC analysis of tumor growth. Data represent mean ± s.e.m. of n = 12 (NIH-3T3-RET), n = 32–44 (ECLC5) or n = 46–49 (LUAD-0057AS1) values per group. a, Right, animal weight. b,c, Right, percent change in the volume of individual tumors at the end of the study. Mean ± s.e.m. are shown. The volume of tumors in all treatment groups in each model was significantly lower than that of the respective vehicle-treated groups (P < 0.0001). P values for statistical significance are shown for other comparisons (ANOVA with Dunnett’s multiple-comparison test). All tests were two sided. Source data
Fig. 6
Fig. 6. Efficacy of vepafestinib compared to other RET-selective inhibitors in PDX models.
a, LUAD-0087AS2 PDX. b, LUAD-0077AS1 PDX. a,b, Left, time course of treatment. Data represent mean ± s.e.m. There were five mice in each group in both models. a,b, Middle, AUC analysis of tumor growth. Data represent mean ± s.e.m. of n = 56 (LUAD-0087AS2) or n = 32 (LUAD-0077AS1) values per group. a,b, Right, percent change in the volume of individual tumors at the end of the study. Mean ± s.e.m. are shown. Each group consisted of five animals. The volume of tumors in all treatment groups in each model was significantly lower than that of the respective vehicle-treated groups (P < 0.0001). P values for significance are shown for other comparisons (ANOVA with Dunnett’s multiple-comparison test). All tests were two sided. Source data
Fig. 7
Fig. 7. Anti-tumor activity of vepafestinib against KIF5B–RETG810R-driven allograft tumors.
a, Animals bearing Ba/F3 KIF5B–RETWT allograft tumors were treated with vehicle (n = 6) or the indicated dosages of vepafestinib (n = 6). b, Animals bearing Ba/F3 KIF5B–RETWT tumors were treated with a single dose of 50 mg per kg vepafestinib, and then tumors were collected at the indicated time points after inhibitor administration for western blotting analysis. Representative immunoblots on which two tumors from each condition were examined are shown. c,d, Mice bearing Ba/F3 KIF5B–RETG810R xenograft tumors were administered vepafestinib (n = 5), selpercatinib (n = 5), pralsetinib (n = 5) or vehicle (n = 5) orally at the indicated dosages BID for 14 d (days 1–14) after grouping. e, Mice bearing Ba/F3 KIF5B–RETG810R allograft tumors were administered 10 or 30 mg per kg vepafestinib, selpercatinib or pralsetinib, and then tumors were collected 1 h later for western blot analysis. Representative immunoblots on which two tumors from each condition were examined are shown. Tumor volume for each dosing group was measured and shown as mean ± s.e.m. Statistical analysis was performed using Dunnett’s test (vehicle versus vepafestinib, selpercatinib or pralsetinib) or Tukey’s test (vepafestinib versus selpercatinib or pralsetinib), and P values are shown. All tests were two sided. GAPDH was used as a loading control in b,e. Source data
Fig. 8
Fig. 8. Vepafestinib is more effective than selpercatinib at penetrating the brain and blocking intracranial tumor growth.
a,b, Pharmacokinetic properties. a, *Apparent permeability coefficient (Papp) values were calculated as the mean of Papp values in the apical-to-basal direction in mock-transfected LLC-PK1 cells. †,‡Total (Kp,brain) and unbound (Kp,uu,brain) brain/plasma concentration ratios were calculated based on total and unbound concentrations in plasma and brain at 0.5 h or 1 h after oral administration of each agent to male BALB/c mice dosed with 50 mg per kg drug. Unbound fractions in plasma (fu,plasma) and brain (fu,brain) were obtained by the equilibrium dialysis method with plasma and brain homogenate. §,¥Net flux ratio (NFR) values for MDR1 (P-gp) and BCRP were obtained from transcellular transport assays using control or MDR1-expressing LLC-PK1 cells and control and BCRP-expressing MDCK II cells. b, Single-dose vepafestinib (3 mg per kg, 10 mg per kg or 50 mg per kg) was administered orally to male Han Wistar rats at time = 0 min (n = 12 per dosing group). Following equilibration, samples were collected at the indicated time points, and vepafestinib concentrations were then determined. Data for all dosages are shown in Extended Data Fig. 10. Data represent mean ± s.e.m. (n = 4 independent measurements in four animals). c, NIH-3T3 CCDC6-RET cells harboring a luciferase reporter were implanted intracranially into nude mice and treated with vehicle or 50 mg per kg vepafestinib BID. Treatment started 5 d after implantation. Bioluminescence images of animals 13 d after implantation are shown (left). Survival curves of each group are shown after implantation (n = 10, vehicle group; n = 7, vepafestinib group) (right). There was a significant difference in survival between the vehicle group and the vepafestinib group (P = 0.0016, log-rank test). d, ECLC5 cells labeled with a luciferase reporter were implanted intracranially into NSG mice and treated with vehicle, selpercatinib (10 mg per kg) or vepafestinib (50 mg per kg) BID. Treatment started 10 d after implantation. There were six animals in each group. d, Bioluminescence images of animals are shown for the last day when all animals were alive in the three groups (43 d after implantation) and at 92 d after implantation for the two treatment arms. e, Luciferase signals were quantified and are shown (left). Data represent mean ± s.e.m. (n = 6 per group). AUC analysis was performed for the selpercatinib and vepafestinib groups (middle, Brown–Forsythe and Welch ANOVA tests). For AUC, data represent mean ± s.e.m. of n = 100 (vepafestinib) or n = 65 (selpercatinib) values. Survival curves are shown for animals after treatment began (right). Treatment with selpercatinib (P = 0.0008, log-rank test) and vepafestinib (P = 0.0008, log-rank test) increased survival relative to the vehicle. However, animals treated with vepafestinib had longer survival (P = 0.001, log-rank test). All statistical tests were two sided. Source data
Extended Data Fig. 1
Extended Data Fig. 1. Selectivity profile of RET inhibitors.
We performed kinase selectivity profile across 256 kinases in the presence of (a) 22 nM selpercatinib (b) 17 nM pralsetinib or (c) 26 nM TPX-0046/enbezotinib. These concentrations are approximately 100-fold higher than the corresponding IC50 value for inhibition of RETWT enzymatic activity. Kinases that were inhibited by ≥50% by each small molecule are plotted as a circle on the kinome tree in the respective panel.
Extended Data Fig. 2
Extended Data Fig. 2. Docking study of vepafestinib.
(a-b) The predicted model of vepafestinib in complex with wild-type RET (RETWT) (blue) superposed with the crystal structure of TAS compound 1 in complex with RETWT (yellow). Panel (b) is focused on the surroundings of the methoxymethylbenzyl group of vepafestinib. Yellow dotted lines indicate the hydrogen bonds. (c) Predicted models of vepafestinib in complex with RET solvent front mutants (G810A, C, D, R, and S) based on molecular docking simulations were drawn from the same view-point as panel (a).
Extended Data Fig. 3
Extended Data Fig. 3. Binding pocket of RET.
(a) X-ray crystal structure shows that TAS compound 1 fits into a pocket surrounded by L730, G731, F735, V738 and L881. (b) View from the gatekeeper residue (V804) in the X-ray structure of the RET-TAS compound 1 complex. TAS Compound 1 is shown as a stick model in yellow. (c) Crystal structures of human RET complexed with TAS compound 1, selpercatinib or pralsetinib. In all three structures, RET showed the active conformation; DFG-in, αC helix-in, Activation Segment-out, and R spine-liner. Therefore, the three drugs can potentially be classified as type I inhibitors.
Extended Data Fig. 4
Extended Data Fig. 4. Inhibition of protein phosphorylation by RET-selective inhibitors.
Cells were deprived of serum for 24 h before treatment with the indicated concentrations of inhibitors for 2 h. Whole-cell extracts were then prepared, resolved by SDS-PAGE and immunoblotted for the total or phosphorylated (P) protein shown. (a-b) Representative immunoblots from two independent Western blotting analysis are displayed. GAPDH was used as a loading control. (c-d) Blots were quantitated by densitometry and then the ratio of phosphorylated protein to total protein was analyzed by non-linear regression using Graphpad Prism v9 software to find the EC50 for inhibition of phosphorylation. Data represent the mean of two independent measurements with the 95% confidence interval (CI) shown in brackets. On each immunoblot, the vehicle-treated control was considered 100% phosphorylation and all other conditions are repressed relative to this. These values were adjusted for any change in protein expression by dividing by the corresponding total protein relative densitometry reading. Source data
Extended Data Fig. 5
Extended Data Fig. 5. Sensitivity of tumor and non-tumor cells to RET inhibitors.
Human cells were plated at a density of 7,500 cells per well in 96-well plates and treated with inhibitors for 96 h. Growth was assessed using alamarBlue. Ba/F3 cell lines were plated at a density of 1,000 cells per well in 96-well plates, treated with inhibitors for 72 h and growth was then determined using CellTiter-Glo assay. (a) Selected growth curves. Data represent the mean ± SEM of 3 (selpercatinib) or 4 (pralsetinib and vandetanib) independent experiments in which there were three replicates of each condition. (b) The mean growth inhibition data was analyzed by non-linear regression and curve fitted to obtain estimated IC50 values and the 95% confidence interval (CI). Five (TT), 4 (HBECp53-EV, HBECp53-RET, LUAD-0057BS1, LUAD-0087AS1), 3 (LUAD-0002AS1, ECLC5B) or 2 (LC-2/ad, MMNK1) independent experiments in which each condition was assayed in triplicates were conducted. Data for LUAD-0086AS3 represent one experiment in which there were 3 replicates of each condition (c) GI50 values are represented by the mean ± SD of 3 independent experiments. The S904F substitution in the activation loop of RET was previously shown to confer resistance to vandetanib. Source data
Extended Data Fig. 6
Extended Data Fig. 6. Caspase 3/7 activity in LC-2/ad and LUAD-0087AS2 NSCLC cells.
Cells were plated at a density of 20,000 cells per well in 96-well plates and with the indicated concentrations of RET inhibitors for 48 h. Results represent the mean ± SD of three replicates in one experiment. Data were compared using Two-way ANOVA with Tukey’s multiple comparison tests. All tests were two sided. Source data
Extended Data Fig. 7
Extended Data Fig. 7. Anti-tumor activity of vepafestinib against LC-2/ad NSCLC xenograft model.
(a) Tumor volume. Data are shown as mean ± SEM (n = 6 or n = 4 animals per group). Dunnett test was used for comparison. All statistical tests were two-sided. Vepafestinib or vehicle were administered orally at the indicated doses, twice daily (BID) or once daily (QD) for 14 days (Day 1-14) after grouping. (b) Animal weight was measured twice weekly. Source data
Extended Data Fig. 8
Extended Data Fig. 8. Effect of RET inhibitors on weight of tumor-bearing animals.
Mice bearing (a) ECLC5 xenograft (n = 5), (b) LUAD-0057AS1 PDX (n = 8), (c) LUAD-0087AS2 PDX (n = 5) or (d) LUAD-0077AS1 (n = 5) were treated with RET multi-kinase or selective inhibitors. Mice bearing allograft tumors derived from Ba/F3 cells expressing KIF5B::RETWT (e, n = 6) or KIF5B::RETG810R (f and g, n = 5) fusions were administrated vepafestinib (TAS0953/HM06), selpercatinib or pralsetinib. Mice bearing Ba/F3-KIF5B::RETWT allograft tumors were treated with vehicle, selpercatinib or pralsetinib (h and i, n = 5). Drugs or vehicle were administered orally at the indicated doses, once daily (QD) or twice daily (BID). Data is presented as mean ± SEM in each group. Tumor-bearing animals were weighed twice weekly *P = 0.0046, compared to the weight on day 0. #P = 0.0015, compared to weight on day 0. Data were compared by ANOVA with Dunnet’s multiple comparison tests. All tests were two sided. Source data
Extended Data Fig. 9
Extended Data Fig. 9. Anti-tumor activity of vepafestinib in comparison with selpercatinib or pralsetinib.
Animals bearing Ba/F3-KIF5B::RETWT allograft tumors were treated with (a) vehicle, vepafestinib or selpercatinib or with (b) vehicle, vepafestinib or pralsetinib. Data shown is the mean ± SEM (n = 5 per group).* P < 0.05 compared with the control group by Dunnett test. Tests were two-sided. Drugs or vehicle were administrated orally at the indicated doses, twice daily (BID) for 14 days (Day 1-14) after grouping. Source data
Extended Data Fig. 10
Extended Data Fig. 10. Pharmacokinetics of vepafestinib in rats.
A Single-dose of 3 mg/kg (top panel), 10 mg/kg (middle panel) or 50 mg/kg (bottom panel) vepafestinib was administered orally to adult male Han Wistar rats at time = 0 min. Following equilibration, samples were collected at the indicated time points and vepafestinib concentrations were then determined by HPLC with tandem mass spectrometry (MS/MS) using D8-vepafestinib as the internal standard as described in Supplementary Methods. Data from panel c is also displayed in Fig. 8b and is included here for comparison with the other dosages used. There were 12 animals in each dosage group, and prefrontal cortex, CSF and plasma samples were obtained from 4 animals within each dosage group. The x-axis is broken to accommodate all the time points in the space. No data was eliminated between the breaks. Source data

References

    1. Takahashi M, Ritz J, Cooper GM. Activation of a novel human transforming gene, ret, by DNA rearrangement. Cell. 1985;42:581–588. doi: 10.1016/0092-8674(85)90115-1. - DOI - PubMed
    1. Qian Y, et al. KIF5B–RET fusion kinase promotes cell growth by multilevel activation of STAT3 in lung cancer. Mol. Cancer. 2014;13:176. doi: 10.1186/1476-4598-13-176. - DOI - PMC - PubMed
    1. Takeuchi K, et al. RET, ROS1 and ALK fusions in lung cancer. Nat. Med. 2012;18:378–381. doi: 10.1038/nm.2658. - DOI - PubMed
    1. Pasini A, et al. Oncogenic activation of RET by two distinct FMTC mutations affecting the tyrosine kinase domain. Oncogene. 1997;15:393–402. doi: 10.1038/sj.onc.1201199. - DOI - PubMed
    1. Yang SR, et al. A performance comparison of commonly used assays to detect RET fusions. Clin. Cancer Res. 2021;27:1316–1328. doi: 10.1158/1078-0432.CCR-20-3208. - DOI - PMC - PubMed

Publication types