

The effect of polyphenols on DNA methylation-assessed biological age attenuation: the DIRECT PLUS randomized controlled trial
- PMID: 37743489
- PMCID: PMC10519069
- DOI: 10.1186/s12916-023-03067-3
The effect of polyphenols on DNA methylation-assessed biological age attenuation: the DIRECT PLUS randomized controlled trial
Abstract
Background: Epigenetic age is an estimator of biological age based on DNA methylation; its discrepancy from chronologic age warrants further investigation. We recently reported that greater polyphenol intake benefitted ectopic fats, brain function, and gut microbiota profile, corresponding with elevated urine polyphenols. The effect of polyphenol-rich dietary interventions on biological aging is yet to be determined.
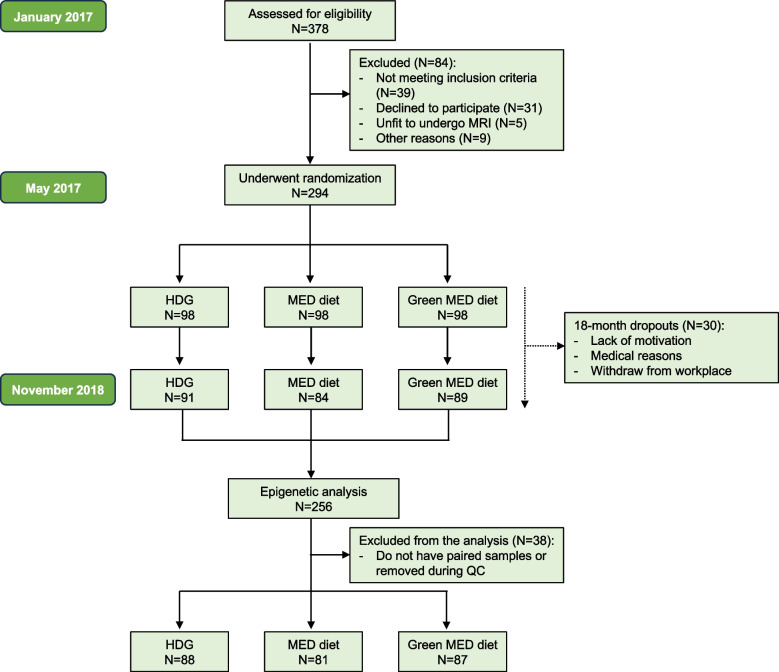
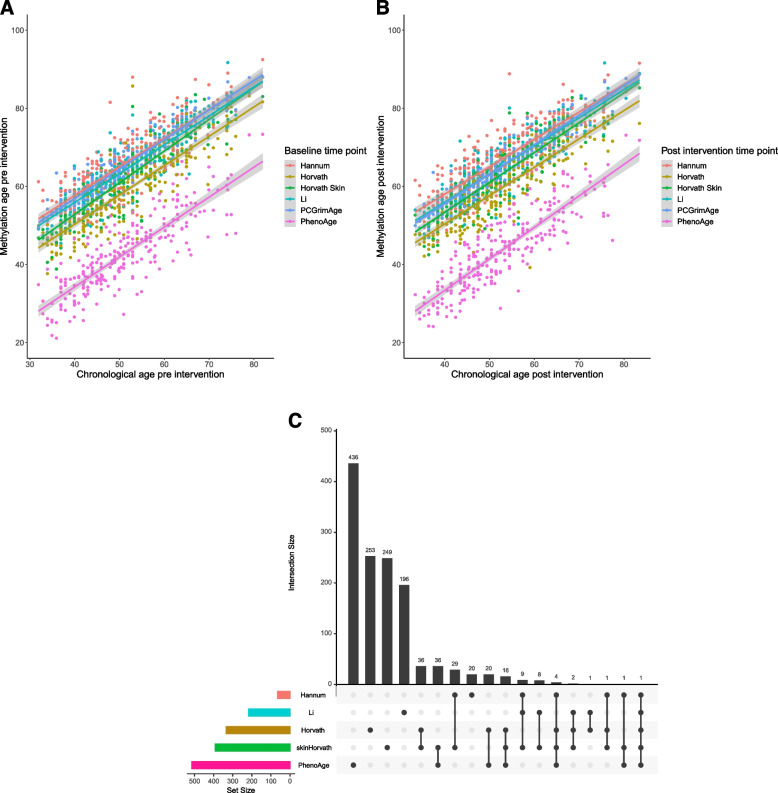
Methods: We calculated different biological aging epigenetic clocks of different generations (Horvath2013, Hannum2013, Li2018, Horvath skin and blood2018, PhenoAge2018, PCGrimAge2022), their corresponding age and intrinsic age accelerations, and DunedinPACE, all based on DNA methylation (Illumina EPIC array; pre-specified secondary outcome) for 256 participants with abdominal obesity or dyslipidemia, before and after the 18-month DIRECT PLUS randomized controlled trial. Three interventions were assigned: healthy dietary guidelines, a Mediterranean (MED) diet, and a polyphenol-rich, low-red/processed meat Green-MED diet. Both MED groups consumed 28 g walnuts/day (+ 440 mg/day polyphenols). The Green-MED group consumed green tea (3-4 cups/day) and Mankai (Wolffia globosa strain) 500-ml green shake (+ 800 mg/day polyphenols). Adherence to the Green-MED diet was assessed by questionnaire and urine polyphenols metabolomics (high-performance liquid chromatography quadrupole time of flight).
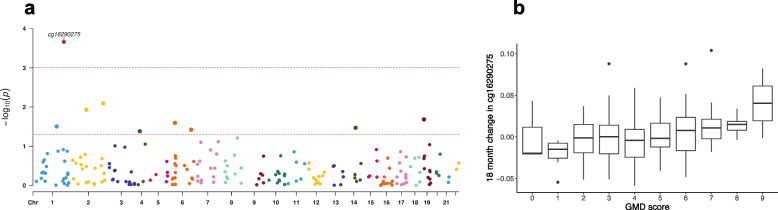
Results: Baseline chronological age (51.3 ± 10.6 years) was significantly correlated with all methylation age (mAge) clocks with correlations ranging from 0.83 to 0.95; p < 2.2e - 16 for all. While all interventions did not differ in terms of changes between mAge clocks, greater Green-Med diet adherence was associated with a lower 18-month relative change (i.e., greater mAge attenuation) in Li and Hannum mAge (beta = - 0.41, p = 0.004 and beta = - 0.38, p = 0.03, respectively; multivariate models). Greater Li mAge attenuation (multivariate models adjusted for age, sex, baseline mAge, and weight loss) was mostly affected by higher intake of Mankai (beta = - 1.8; p = 0.061) and green tea (beta = - 1.57; p = 0.0016) and corresponded with elevated urine polyphenols: hydroxytyrosol, tyrosol, and urolithin C (p < 0.05 for all) and urolithin A (p = 0.08), highly common in green plants. Overall, participants undergoing either MED-style diet had ~ 8.9 months favorable difference between the observed and expected Li mAge at the end of the intervention (p = 0.02).
Conclusions: This study showed that MED and green-MED diets with increased polyphenols intake, such as green tea and Mankai, are inversely associated with biological aging. To the best of our knowledge, this is the first clinical trial to indicate a potential link between polyphenol intake, urine polyphenols, and biological aging.
Trial registration: ClinicalTrials.gov, NCT03020186.
Keywords: Epigenetics; Green-MED diet; Methylation age; Tyrosol; Urine metabolomics; Urolithins; Weight loss.
© 2023. BioMed Central Ltd., part of Springer Nature.
Conflict of interest statement
MB received honoraria as a consultant and speaker from Amgen, AstraZeneca, Bayer, Boehringer-Ingelheim, Lilly, Novo Nordisk, Novartis, and Sanofi. All other authors declare that they have no competing interests.
Figures


References
Publication types
MeSH terms
Associated data
LinkOut - more resources
Full Text Sources
Medical
