. 2021 Jul 6:2:671796.
doi: 10.3389/ffunb.2021.671796. eCollection 2021.

Biosynthesis of Fusapyrone Depends on the H3K9 Methyltransferase, FmKmt1, in Fusarium mangiferae

Affiliations

Biosynthesis of Fusapyrone Depends on the H3K9 Methyltransferase, FmKmt1, in Fusarium mangiferae

Anna K Atanasoff-Kardjalieff et al. Front Fungal Biol. .

Abstract

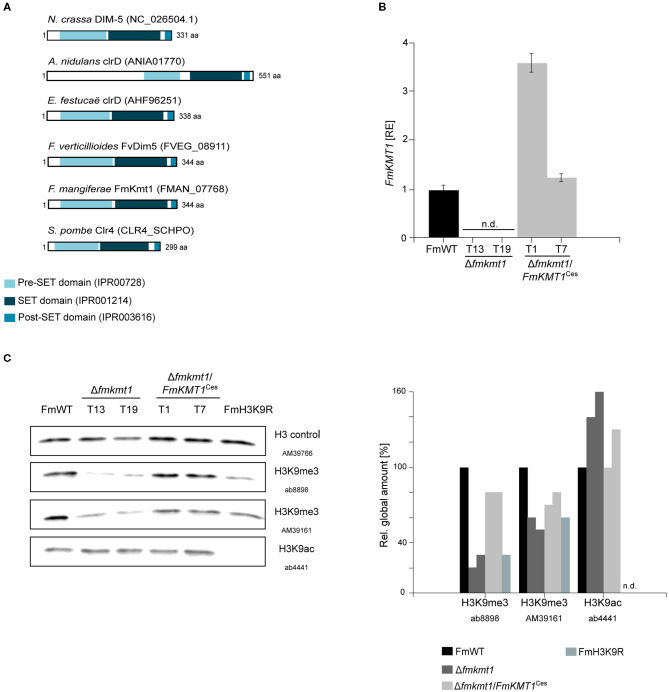
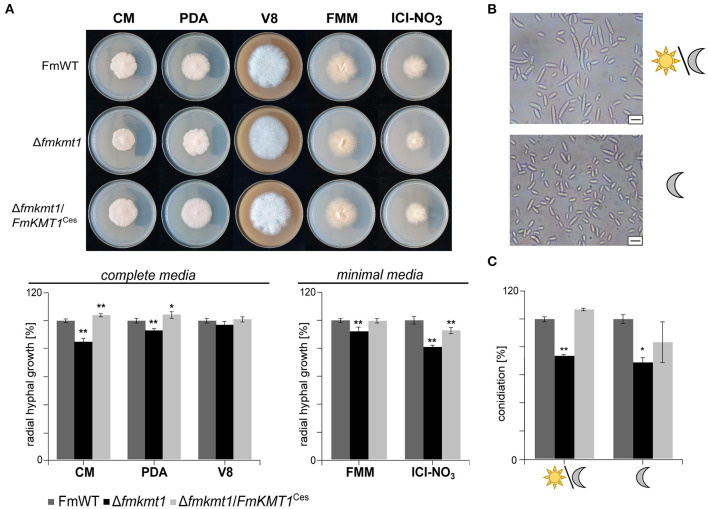
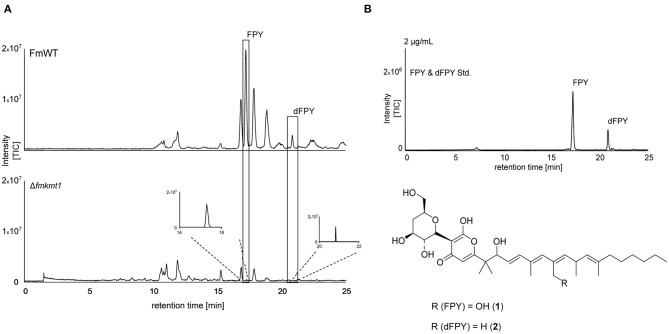
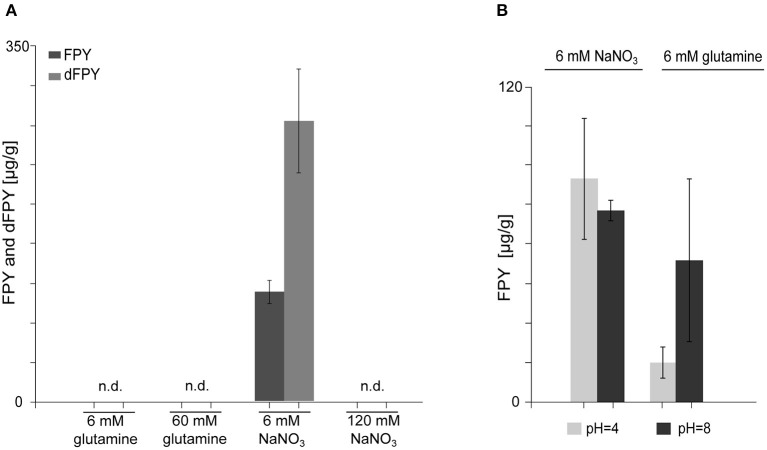
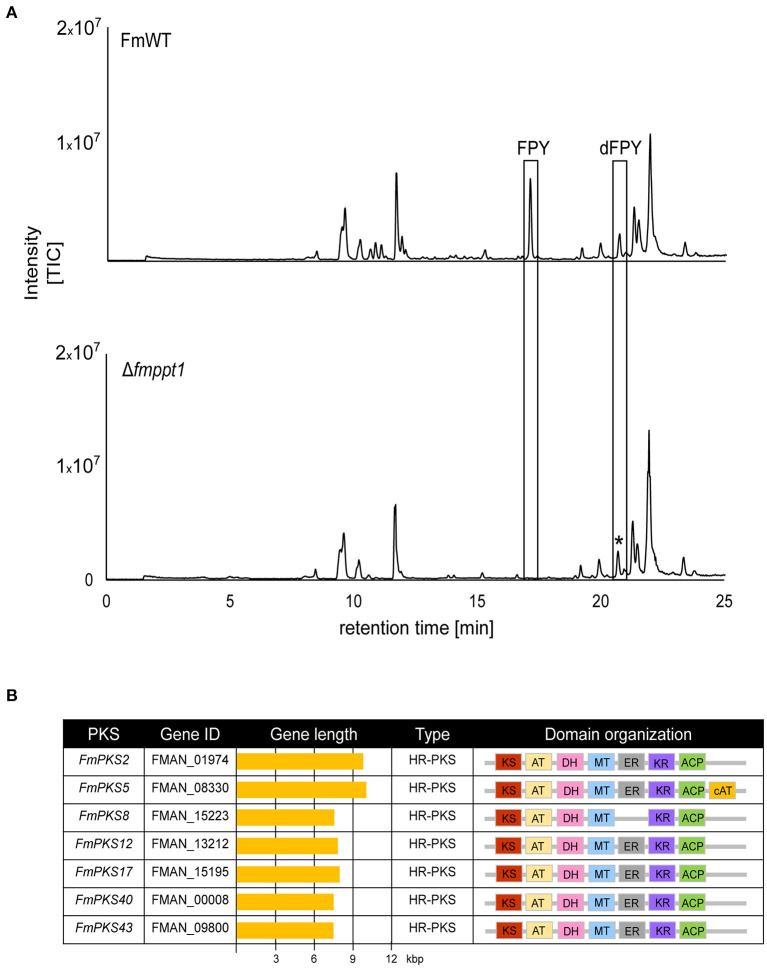
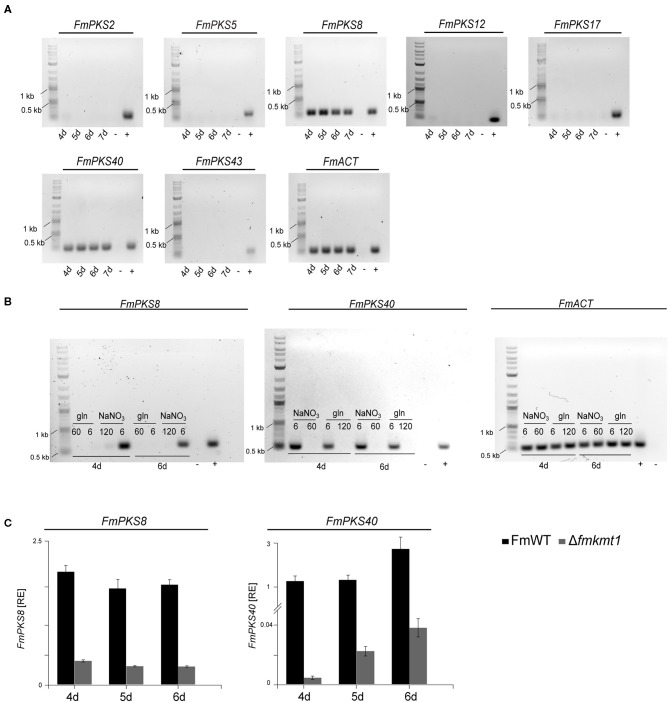
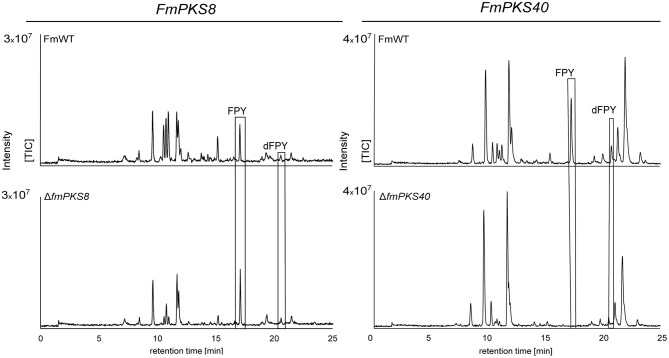
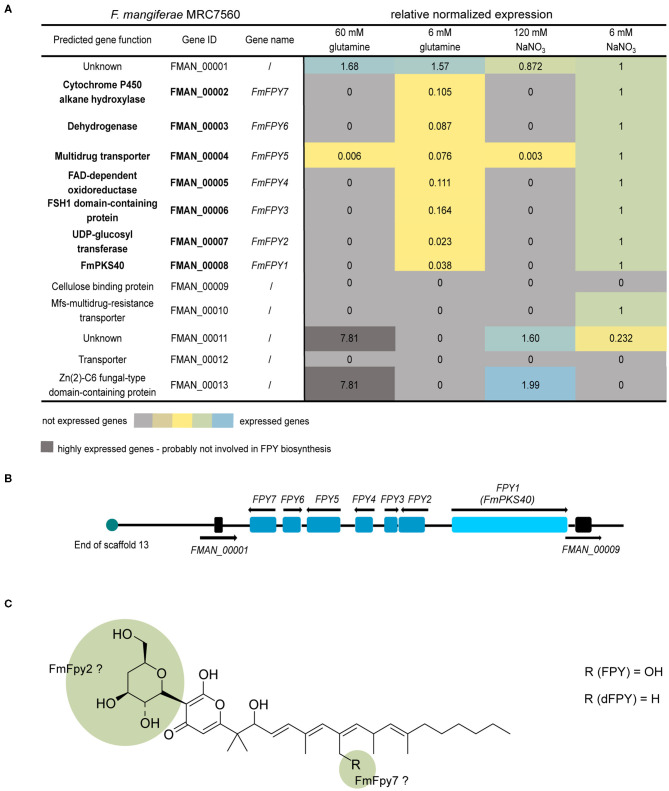
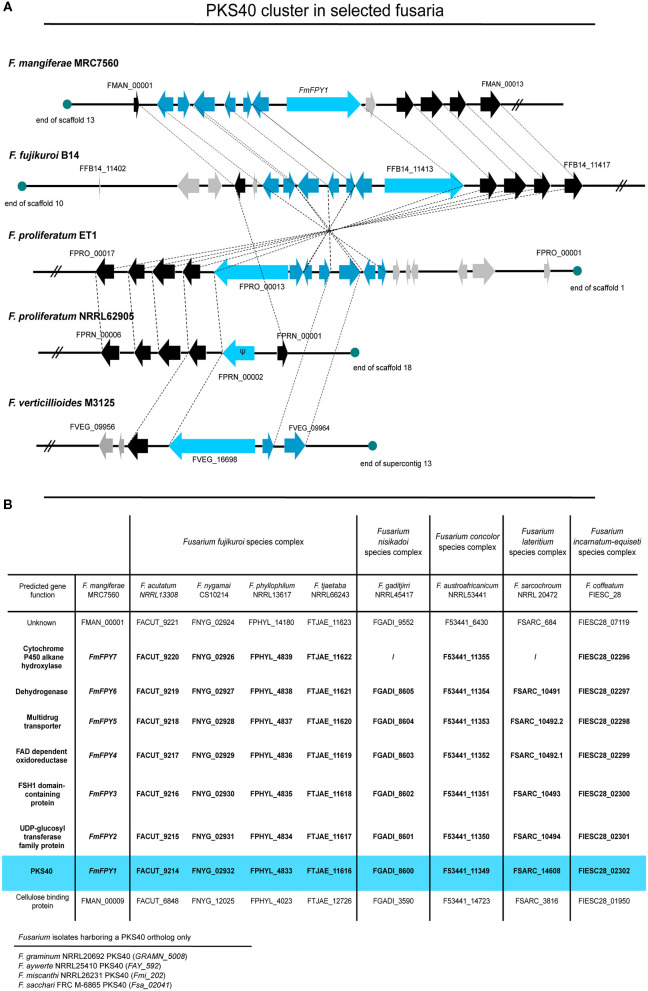
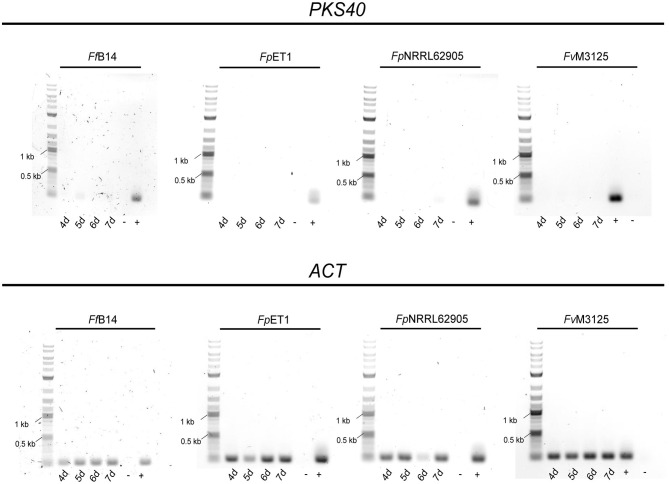
The phytopathogenic fungus Fusarium mangiferae belongs to the Fusarium fujikuroi species complex (FFSC). Members of this group cause a wide spectrum of devastating diseases on diverse agricultural crops. F. mangiferae is the causal agent of the mango malformation disease (MMD) and as such detrimental for agriculture in the southern hemisphere. During plant infection, the fungus produces a plethora of bioactive secondary metabolites (SMs), which most often lead to severe adverse defects on plants health. Changes in chromatin structure achieved by posttranslational modifications (PTM) of histones play a key role in regulation of fungal SM biosynthesis. Posttranslational tri-methylation of histone 3 lysine 9 (H3K9me3) is considered a hallmark of heterochromatin and established by the SET-domain protein Kmt1. Here, we show that FmKmt1 is involved in H3K9me3 in F. mangiferae. Loss of FmKmt1 only slightly though significantly affected fungal hyphal growth and stress response and is required for wild type-like conidiation. While FmKmt1 is largely dispensable for the biosynthesis of most known SMs, removal of FmKMT1 resulted in an almost complete loss of fusapyrone and deoxyfusapyrone, γ-pyrones previously only known from Fusarium semitectum. Here, we identified the polyketide synthase (PKS) FmPKS40 to be involved in fusapyrone biosynthesis, delineate putative cluster borders by co-expression studies and provide insights into its regulation.

Keywords: Fusarium fujikuroi species complex; Fusarium mangiferae; H3K9me3; deoxyfusapyrone; fusapyrone; heterochromatin; histone PTMs; secondary metabolism.


Conflict of interest statement

The authors declare that the research was conducted in the absence of any commercial or financial relationships that could be construed as a potential conflict of interest.

Figures

Figure 1
Figure 1
FmKmt1 is involved in H3K9me3 in F. mangiferae. (A) Graphical representation of the domain structure of Neurospora crassa DIM-5 and orthologs in other fungal species including F. mangiferae (FmWT). The conserved pre-Set domain, SET domain, and post-SET domain are indicated; InterPro accession numbers are shown in the domain description (B) For FmKMT1 expression analysis, FmWT, Δfmkmt1, and Δfmkmt1/FmKMT1Ces were grown on solid CM for 3 days at 30°C. For the determination of transcript levels, RNA was extracted and transcribed into cDNA prior to RT-qPCR. The FmWT FmKMT1 expression was arbitrarily set to 1. Mean values and standard deviations are shown. n.d., not detected; RE, relative expression. (C) Western blot analysis of FmWT, Δfmkmt1, Δfmkmt1/FmKMT1Ces, and FmH3K9R using two anti-H3K9me3-specific antibodies (AB, Abcam; AM, Active Motif), and one anti-H3K9ac-specific antibody. For referencing one anti-H3-specific antibody was used. Indicated strains were grown in liquid ICI medium supplemented with 120 mM NaNO3 for 4 days and subsequently total proteins were extracted. Roughly, 50 μg of total protein extracts were separated on a SDS gel prior to western blotting. For quantification, a densitometric analysis was performed and the respective wild-type strain was arbitrarily set to 100%. n.d., not detected via Image J analysis tool.
Figure 2
Figure 2
Impact of FmKMT1 deletion on vegetative growth and asexual development. (A) Radial hyphal growth of F. mangiferae wild-type (FmWT), Δfmkmt1 and Δfmkmt1/FmKMT1Ces was assessed on complete media (FCM, PDA, V8) and minimal media (FMM and ICI supplemented with 6 mM NaNO3). For this, strains were grown for 5 days at 30°C in the dark. Experiments were performed in biological triplicates. Hyphal growth of FmWT on the respective media was arbitrarily set to 100%. Mean values and standard deviations are shown in the diagram. For statistical analysis a student's t-test was performed. Asterisks above the bars denote significant differences in the vegetative growth of the indicated strains compared to the respective wild type, *p < 0.05; **p < 0.001. (B) FmWT conidia under L/D and D conditions. FmWT produces under L/D micro- and macroconidia, while under D conditions only microconidia are formed. Bar in the right corner represents 10 μm of size. (C) Conidiation assay under L/D and D conditions was performed on vegetable V8 media for FmWT, Δfmkmt1, and Δfmkmt1/FmKMT1Ces and assessed after 7 days of incubation. Experiments were performed in triplicates. Conidia production of FmWT was arbitrarily set to 100%. Statistical analysis were performed with a student's t-test. Asterisks above the bars denote significant differences in the conidia production of the indicated strains compared to the respective wild type, *p < 0.05; **p < 0.001.
Figure 3
Figure 3
Fusapyrone (FPY) and deoxyfusapyrone (dFPY) chemical profiles in F. mangiferae. (A) HPLC-HRMS chromatograms of FPY (1) and dFPY (2) production in the FmKMT1 deletion strain (Δfmkmt1) compared to the wild-type strain (FmWT). For this, FmWT and three independent Δfmkmt1 strains were cultivated in FPY-inducing media for 7 days at 30°C. Experiments were performed in triplicates. The measurement of fungal supernatants show that only traces of FPY and dFPY are produced by Δfmkmt1 compared to FmWT. (B) HPLC-HRMS chromatogram of FPY and dFPY standards (applied in a concentration of 2 μg/mL). Structures of the γ-pyrones FPY and dFPY are shown below. TIC chromatograms (positive ESI-mode) range from m/z 100 to 1,000.
Figure 4
Figure 4
Biosynthesis of fusapyrone (FPY) and deoxyfusapyrone (dFPY) is N-repressed but independent of the ambient pH in F. mangiferae. (A) Measurement of FPY and dFPY levels with HPLC-HRMS. Production of FPY by FmWT under standard laboratory culture conditions i.e., liquid ICI supplemented with 6 mM or 60 mM glutamine and 6 mM or 120 mM NaNO3 for 7 days at 30°C. FPY and dFPY are only produced in detectable amounts by FmWT in media supplemented with 6 mM NaNO3. Experiments were performed in triplicates. Mean values and standard deviations are shown in diagram. n.d., not detected in the supernatant. (B) Quantitative determination of FPY production levels by FmWT measured with HPLC-HRMS. FmWT was cultivated in 6 mM NaNO3 and 6 mM glutamine for 7 days at 30°C in the dark. The pH was set prior inoculation to respective levels using 100 mM NaH2PO4 (pH 4) and 100 mM Na2HPO4 (pH 8). pH levels were controlled after 7 days using pH paper. Experiments were performed in triplicates. Mean values and standard deviations are shown in diagram.
Figure 5
Figure 5
Fusapyrone (FPY) and deoxyfusapyrone (dFPY) are PKS-derived metabolites. (A) HPLC-HRMS chromatograms of supernatants from F. mangiferae (FmWT) and Δfmppt1 grown for 7 days at 30°C in the dark in liquid ICI supplemented with 6 mM NaNO3 as sole nitrogen source. Experiments were performed in triplicates. Peaks for FPY and dFPY (boxed) are present in FmWT but absent from Δfmppt1 cultures. The asterisk (*) indicates that the observed signal in the Δfmppt1 chromatogram with a similar retention time as dFPY is distinct from dFPY since the signal has a different mass. TIC chromatograms (positive ESI-mode) range from m/z 100 to 1,000. (B) Overview of PKS-encoding candidate genes for FPY biosynthesis. Sequences were retrieved from the publicly available genome sequence of F. mangiferae MRC7560 (Niehaus et al., 2016a). Depicted are the key enzymes, gene IDs, gene lengths, PKS types as well as the predicted domain organizations. Domain organization was analyzed using the NCBI Conserved Domain (Marchler-Bauer et al., 2017), InterPro (Blum et al., 2021), SBSPKSv2 (Khater et al., 2017); and the PKS/NRPS Analysis Web-site (Bachmann and Ravel, 2009). KS (red), keto synthase; AT (yellow), acyltransferase; DH (pink), dehydratase; MT (blue) C-methyltransferase; ER (gray) enoylreductase; KR (violet), ketoreductase; ACP (green), acyl carrier protein; cAT (orange), carnitine acyltransferase.
Figure 6
Figure 6
Expressional analysis of fusapyrone (FPY) and deoxyfusapyrone (dFPY) candidate genes in F. mangiferae. (A) Semi-quantitative PCR of candidate PKS genes for FPY and dFPY production. F. mangiferae (FmWT) was cultivated for 4–7 days in FPY-inducing media and subsequently RNA was extracted from lyophilized mycelia und transcribed to cDNA. Primer used for the detection of gene expression are listed in Supplementary Table 1. (B) Semi-quantitative PCR of gene expression in liquid ICI supplemented with different N-sources. FmWT was cultivated for 4 and 6 days in FPY-inducing [additionally 6 mM glutamine (gln)] and FPY-repressing conditions. Extracted RNA was then transcribed to cDNA for semi-quantitative PCR reaction. Primer pairs used for FmPKS8 and FmPKS40 expressional analysis are listed in Supplementary Table 1. (C) For the comparison of transcription levels, FmWT and Δfmkmt1 were cultivated for 4–6 days in FPY inducing conditions. From lyophilized mycelium RNA was extracted and cDNA synthesized. Expression levels of FmPKS8 and FmPKS40 were measured via RT-qPCR. Mean values and standard deviations are shown. RE, relative normalized expression. For cDNA control actin was amplified using the primers Actin_F//R. As size marker GeneRuler 1 kb Plus DNA Ladder (NEB) was used. As positive control (+) FmWT gDNA was used, while as negative control (-) sterile water was used.
Figure 7
Figure 7
HPLC-HRMS chromatograms of fusapyrone (FPY) and deoxyfusapyrone (dFPY) production in ΔfmPKS8 and ΔfmPKS40 cultures. F. mangiferae wild-type (FmWT) and indicated deletion strains were cultivated for 7 days in FPY-inducing media. Experiments were performed in triplicates. The measurement of fungal supernatants revealed that no FPY and dFPY is produced in ΔfmPKS40 cultures, while ΔfmPKS8 retained wild type-like production levels. TIC chromatograms (positive ESI-mode) range from m/z 100 to 1,000.
Figure 8
Figure 8
Co-expression studies of genes putatively involved in fusapyrone (FPY) and deoxyfusapyrone (dFPY) biosynthesis. (A) Heat map of FmFPY SMBGC co-expression studies. Here FmWT was cultivated at 30°C for 4 days under different N-sources and concentrations (ICI + 60/6 mM glutamine or 120/6 mM NaNO3). Subsequently RNA was extracted and transcribed into cDNA for RT-qPCR analysis. For data normalization, the house -keeping genes actin, GPD and β-tubulin were used. Primers are listed in Supplementary Table 1. (B) FmFPY1 is indicated as light blue rectangle, while associated cluster genes FmFPY2 - FmFPY7 are indicated as blue rectangles. The upstream border gene FMAN_00001 and the downstream border gene FMAN_00009 are depicted in black rectangles. Black arrows show translation direction. Turquoise circle indicates end of F. mangiferae scaffold 13. (C) Structure formula of FPY and dFPY. Green highlighted parts of the structure formula indicate functions of tailoring enzymes on the molecule.
Figure 9
Figure 9
Comparison of PKS40 cluster in different members of the FFSC. (A) The putative PKS40 gene cluster is only present in F. mangiferae MRC7560, F. fujikuroi B14, and F. proliferatum ET1. For F. proliferatum NRRL62905 only a remnant of PKS40 and no other putative cluster genes are present, while for F. verticillioides M3125 an orthologous PKS40 gene and only two cluster genes can be found. Light blue arrows indicate the respective PKS40 key enzyme, while blue arrows are designated putative cluster genes. Black arrows represent genes that are orthologes in other species and grey arrows show genes which do not have closely related orthologes. Ψ designates a pseudogene. (B) Table of several other Fusarium species from the FFSC and other Fusarium species complexes with orthologes PKS40 gene clusters. Data was retrieved from NCBI and an extended pBLAST search was performed of FmFPY1-FmFPY7 against other fusaria.
Figure 10
Figure 10
Semi-quantitative gene expression analysis of PKS40 in other members of the FFSC. The respective Fusarium strains were cultivated for 4–7 days in FPY-inducing conditions. Subsequently, RNA extraction and cDNA synthesis were performed. Gene expression was tested with the primer pair FfPKS40_F//FmPKS40_R for the indicated Fusarium species. As cDNA control the housekeeping gene actin was amplified using the primers Actin_F//R. As size marker the GeneRuler 1 kb Plus DNA Ladder (NEB) was used. As positive control (+) respective Fusarium sp. gDNA was used, while as negative control (-) sterile water was used.

References

    1. Alexander N. J., McCormick S. P., Hohn T. M. (1999). TRI12, a trichothecene efflux pump from Fusarium sporotrichioides : gene isolation and expression in yeast. Mol. Gen. Genet. 261, 977–984. 10.1007/s004380051046 - DOI - PubMed
    1. Ansari M. W., Rani V., Shukla A., Bains G., Pant R. C., Tuteja N. (2015). Mango (Mangifera indica L.) malformation: a malady of stress ethylene origin. Physiol. Mol. Biol. Plants 21:258. 10.1007/s12298-014-0258-y - DOI - PMC - PubMed
    1. Bachleitner S., Sørensen J. L., Gacek-Matthews A., Sulyok M., Studt L., Strauss J. (2019). Evidence of a demethylase- independent role for the H3K4- specific histone demethylases in Aspergillus nidulans and Fusarium graminearum secondary metabolism. Front. Microbiol. 10:1759. 10.3389/fmicb.2019.01759 - DOI - PMC - PubMed
    1. Bachleitner S., Sulyok M., Sørensen J. L., Strauss J., Studt L. (2021). The H4K20 methyltransferase Kmt5 is involved in secondary metabolism and stress response in phytopathogenic Fusarium species. (in press). - PubMed
    1. Bachmann B. O., Ravel J. (2009). Chapter 8 methods for in silico prediction of microbial polyketide and nonribosomal peptide biosynthetic pathways from DNA sequence data. Methods Enzymol. 458, 181–217. 10.1016/S0076-6879(09)04808-3 - DOI - PubMed