

Flor Yeasts Rewire the Central Carbon Metabolism During Wine Alcoholic Fermentation
- PMID: 37744152
- PMCID: PMC10512321
- DOI: 10.3389/ffunb.2021.733513
Flor Yeasts Rewire the Central Carbon Metabolism During Wine Alcoholic Fermentation
Abstract
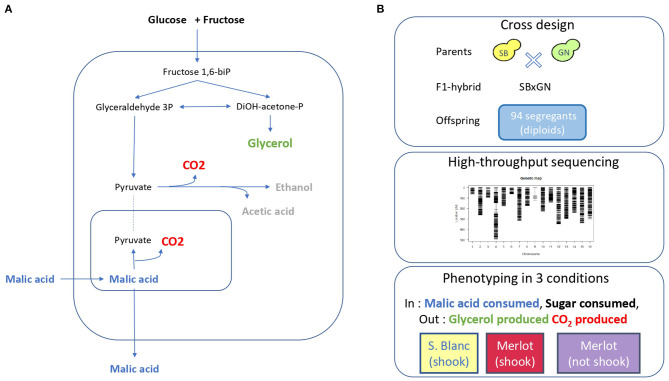
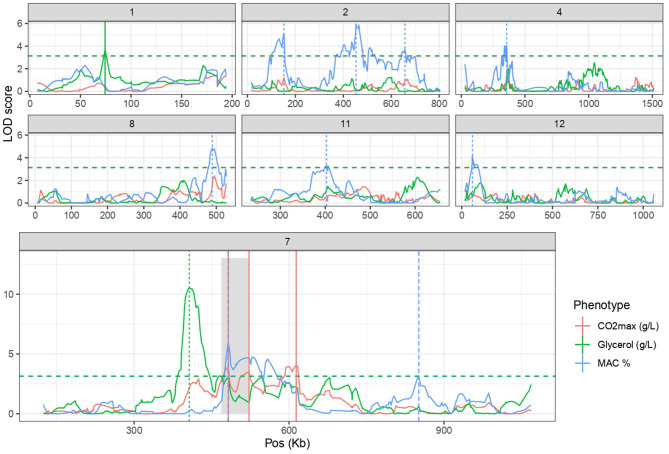
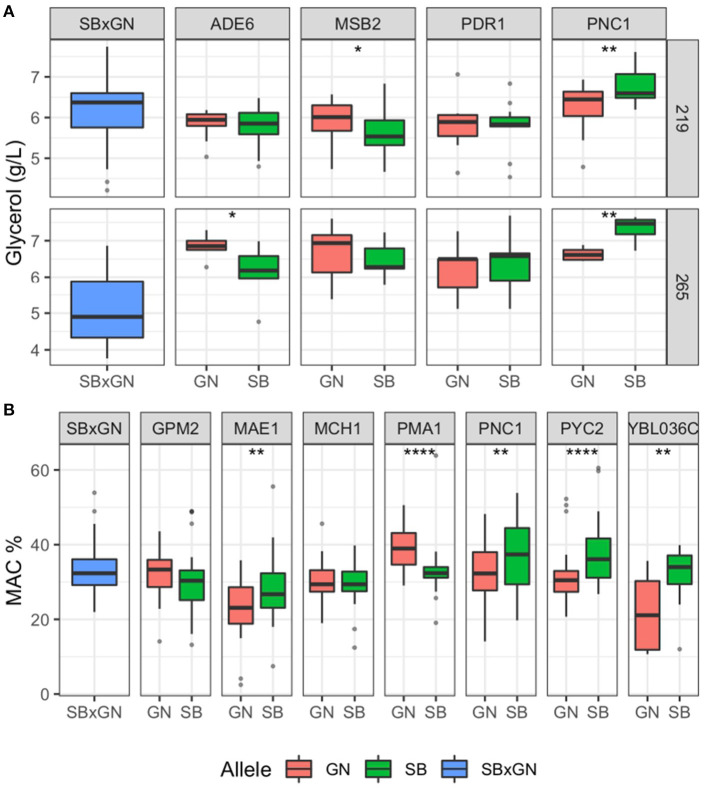
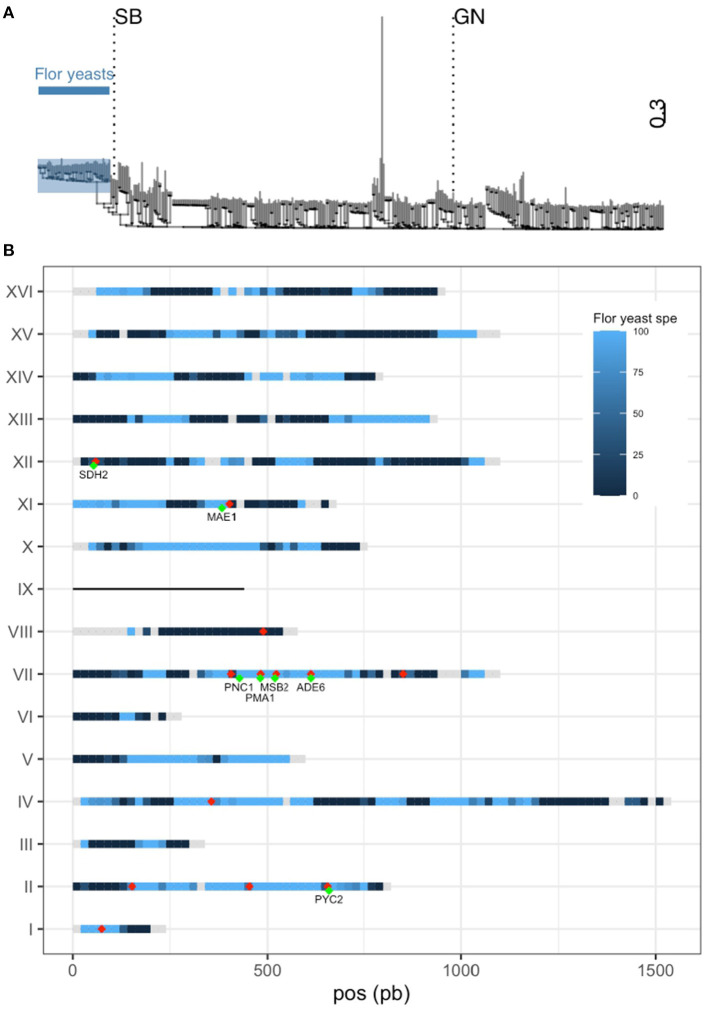
The identification of natural allelic variations controlling quantitative traits could contribute to decipher metabolic adaptation mechanisms within different populations of the same species. Such variations could result from human-mediated selection pressures and participate to the domestication. In this study, the genetic causes of the phenotypic variability of the central carbon metabolism of Saccharomyces cerevisiae were investigated in the context of the enological fermentation. The genetic determinism of this trait was found out by a quantitative trait loci (QTL) mapping approach using the offspring of two strains belonging to the wine genetic group of the species. A total of 14 QTL were identified from which 8 were validated down to the gene level by genetic engineering. The allelic frequencies of the validated genes within 403 enological strains showed that most of the validated QTL had allelic variations involving flor yeast specific alleles. Those alleles were brought in the offspring by one parental strain that contains introgressions from the flor yeast genetic group. The causative genes identified are functionally linked to quantitative proteomic variations that would explain divergent metabolic features of wine and flor yeasts involving the tricarboxylic acid cycle (TCA), the glyoxylate shunt and the homeostasis of proton and redox cofactors. Overall, this work led to the identification of genetic factors that are hallmarks of adaptive divergence between flor yeast and wine yeast in the wine biotope. These results also reveal that introgressions originated from intraspecific hybridization events promoted phenotypic variability of carbon metabolism observed in wine strains.
Keywords: QTL; Saccharomyces cerevisiae; alcoholic fermentation; flor yeast; linkage analysis; quantitative genetic; wine fermentation; yeast.
Copyright © 2021 Peltier, Vion, Abou Saada, Friedrich, Schacherer and Marullo.
Conflict of interest statement
EP was employed by Biolaffort. PM and CV are employed by Biolaffort. The remaining authors declare that the research was conducted in the absence of any commercial or financial relationships that could be construed as a potential conflict of interest. The handling editor CTH declared a past co-authorship with one of the authors JS.
Figures
Similar articles
-
Differential adaptation to multi-stressed conditions of wine fermentation revealed by variations in yeast regulatory networks.BMC Genomics. 2013 Oct 4;14:681. doi: 10.1186/1471-2164-14-681. BMC Genomics. 2013. PMID: 24094006 Free PMC article.
-
Targeted 1-H-NMR wine analyses revealed specific metabolomic signatures of yeast populations belonging to the Saccharomyces genus.Food Microbiol. 2024 Jun;120:104463. doi: 10.1016/j.fm.2024.104463. Epub 2024 Jan 10. Food Microbiol. 2024. PMID: 38431337
-
Comparative Study of the Proteins Involved in the Fermentation-Derived Compounds in Two Strains of Saccharomyces cerevisiae during Sparkling Wine Second Fermentation.Microorganisms. 2020 Aug 8;8(8):1209. doi: 10.3390/microorganisms8081209. Microorganisms. 2020. PMID: 32784425 Free PMC article.
-
Flor yeasts of Saccharomyces cerevisiae--their ecology, genetics and metabolism.Int J Food Microbiol. 2013 Oct 15;167(2):269-75. doi: 10.1016/j.ijfoodmicro.2013.08.021. Epub 2013 Sep 10. Int J Food Microbiol. 2013. PMID: 24141073 Review.
-
Diversity and adaptive evolution of Saccharomyces wine yeast: a review.FEMS Yeast Res. 2015 Nov;15(7):fov067. doi: 10.1093/femsyr/fov067. Epub 2015 Jul 22. FEMS Yeast Res. 2015. PMID: 26205244 Free PMC article. Review.
Cited by
-
Endo metabolomic profiling of flor and wine yeasts reveals a positive correlation between intracellular metabolite load and the specific glycolytic flux during wine fermentation.Front Microbiol. 2023 Oct 19;14:1227520. doi: 10.3389/fmicb.2023.1227520. eCollection 2023. Front Microbiol. 2023. PMID: 37928666 Free PMC article.
-
Marker Assisted Selection of Malic-Consuming Saccharomyces cerevisiae Strains for Winemaking. Efficiency and Limits of a QTL's Driven Breeding Program.J Fungi (Basel). 2021 Apr 15;7(4):304. doi: 10.3390/jof7040304. J Fungi (Basel). 2021. PMID: 33921151 Free PMC article.
References
-
- Bauer J., Luttik M. A. H., Flores C.-L., Dijken J. P., Pronk J. T., Niederberger P. (1999). By-product formation during exposure of respiring Saccharomyces cerevisiae cultures to excess glucose is not caused by a limited capacity of pyruvate carboxylase. FEMS Microbiol. Lett. 179, 107–113. 10.1111/j.1574-6968.1999.tb08715.x - DOI - PubMed
LinkOut - more resources
Full Text Sources