. 2023 Sep 8:14:1197746.
doi: 10.3389/fimmu.2023.1197746. eCollection 2023.

CD4+TGFβ+ cells infiltrated the bursa of Fabricius following IBDV infection, and correlated with a delayed viral clearance, but did not correlate with disease severity, or immunosuppression

Affiliations

CD4+TGFβ+ cells infiltrated the bursa of Fabricius following IBDV infection, and correlated with a delayed viral clearance, but did not correlate with disease severity, or immunosuppression

Salik Nazki et al. Front Immunol. .

Abstract

Introduction: Infectious Bursal Disease Virus (IBDV) causes immunosuppression in chickens. While B-cell destruction is the main cause of humoral immunosuppression, bursal T cells from IBDV-infected birds have been reported to inhibit the mitogenic response of splenocytes, indicating that some T cell subsets in the infected bursa have immunomodulatory activities. CD4+CD25+TGFβ+ cells have been recently described in chickens that have immunoregulatory properties and play a role in the pathogenesis of Marek's Disease Virus.

Methods: To evaluate if CD4+CD25+TGFβ+ cells infiltrated the bursa of Fabricius (BF) following IBDV infection, and influenced the outcome of infection, birds were inoculated at either 2 days or 2 weeks of age with vaccine strain (228E), classic field strain (F52/70), or PBS (mock), and bursal cell populations were quantified by flow cytometry.

Results: Both 228E and F52/70 led to atrophy of the BF, a significant reduction of Bu1+-B cells, and a significant increase in CD4+ and CD8α+ T cells in the BF, but only F52/70 caused suppression of immune responses to a test antigen in younger birds, and clinical signs in older birds. Virus was cleared from the BF more rapidly in younger birds than older birds. An infiltration of CD4+CD25+T cells into the BF, and elevated expression of bursal TGFβ-1+ mRNA was observed at all time points following infection, irrespective of the strain or age of the birds, but CD4+TGFβ+cells and CD4+CD25+TGFβ+ cells only appeared in the BF at 28 dpi in younger birds. In older birds, CD4+TGFβ+ cells and CD4+CD25+TGFβ+ cells were present at earlier time points, from 7dpi following 228E infection, and from 14 and 28 dpi following F52/70 infection, respectively.

Discussion: Our data suggest that an earlier infiltration of CD4+TGFβ+ cells into the BF correlated with a delayed clearance of virus. However, the influx of CD4+TGFβ+ cells and CD4+CD25+TGFβ+ into the BF did not correlate with increased pathogenicity, or immunosuppression.

Keywords: CD4+CD25+ T cells; IBDV; Infectious bursal disease virus; TGFβ; bursa of Fabricius; immunosuppression; regulatory T cells.


Conflict of interest statement

The authors declare that the research was conducted in the absence of any commercial or financial relationships that could be construed as a potential conflict of interest.

Figures

Figure 1
Figure 1
Overview of the animal studies. Two animal experiments were conducted in this study. In the first (A), 72 two-day old and 72 two-week old Rhode Island Red chicken were randomly divided into three groups of 24 birds each and inoculated intranasally with PBS, 228E, or F52/70. Six chicken from each group were culled at 7, 14, 28 and 35 dpi to collect tissues and sera. At 13 dpi, six chicken from each group were bled and same birds were vaccinated subcutaneously with an inactivated AIV vaccine, and later culled at 35 dpi to check the level of immunosuppression due to IBDV in these birds. In the second animal experiment (B), 54 two-day old chicken were divided into three groups of 18 birds each and inoculated intranasally with PBS, 228E, or F52/70. Six chickens from each group were culled at 3, 7, and 28 dpi to collect tissues. The body weight of each chicken was monitored daily, and the BF weight was observed at the day of cull.
Figure 2
Figure 2
Effect of IBDV infection on clinical parameters and humoral immunity. (A) Two-day old and (B) two-week old birds were examined for clinical signs at least twice daily for first 10 days post infection and scored using a points-based scoring system developed previously at The Pirbright Institute as mild (1–7), moderate (8–11), or severe (12–17). Sick birds were humanely culled on attaining humane endpoints of 11 or above. (C) Two-day old and (D) two-week old birds were weighed every day in the morning and the BF weight was measured on the day of cull to determine the Bursa: Body weight ratio to compare the level of bursal atrophy between the mock and 228E and F52/70 infected birds. The viral loads in the BF obtained from mock and infected (E) two-day old and (F) two-week old birds were quantified by real-time reverse transcription quantitative PCR. The Log10 fold change in viral VP2 gene expression per sample was normalized to a housekeeping gene (RPLPO) and expressed relative to mock-inoculated controls in a ΔΔCT analysis. Sera was collected at 35 dpi from the (G) two-day old and (H) two-week old birds vaccinated with AIV vaccine at 14 dpi to observe the effect of IBDV on humoral immunity in the birds. A Hemagglutination inhibition (HI) assay was conducted on the sera using whole UDL1/08 influenza virus and 1% chicken red blood cells. The bars represent the means, and the error bars represent the standard errors of the mean (SEM). The different letters over the bars correspond to the values with a statistically significant difference from each other. Bars showing asterisks (*) represent values that differ significantly from each other (* indicates p ≤ 0.05, ** indicates p ≤ 0.01, and **** indicates p ≤ 0.0001).
Figure 3
Figure 3
Quantification of the immune cell populations in the BF. Single-cell suspensions were immunostained to ascertain the frequencies of immune cell populations in BF collected from mock-inoculated birds, and birds inoculated with 228E and F52/70. The frequencies of Bu1+ cells in (A) two-day old and (B) two-week old, macrophages (Kul01+) in (C) two-day old and (D) two-week old, CD4brCD8α- in (E) two-day old and (F) two-week old, and CD4-CD8α+ cell populations in (G) two-day old and (H) two-week old infected and uninfected birds at each time point are presented in the graphs. The Live/Dead-Fixable Near IR stain was used for dead cell exclusion. The bars represent the mean ± SEM for each population, and the asterisk (*) indicates a statistically significant difference between the averages found among three groups at each time point (* indicates p ≤ 0.05, ** indicates p ≤ 0.01, *** indicates p ≤ 0.001, and **** indicates p ≤ 0.0001).
Figure 4
Figure 4
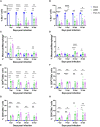
mRNA expression of cytokine genes in the BF. Analysis of mRNA transcription of IFN-γ in (A) two-day old and (B) two-week old, IL-10 in (C) two-day old and (D) two-week old, TGFβ-1 in (E) two-day old and (F) two-week old, TGFβ-2 in (G) two-day old and (H) two-week old, TGFβ-3 in (I) two-day old and (J) two-week old, and TGFβ receptor-1 in (K) two-day old and (L) two-week old in BF collected from infected and mock-inoculated birds was performed using RT-qPCR to compare the fold change in expression of the mRNA levels in infected birds compared to mock birds. Fold change was normalized the RPLPO housekeeping gene, and expressed relative to mock-inoculated birds in a in a ΔΔCT analysis. The bars correspond to the mean ± SEM for each population, and the asterisk (*) indicates a statistically significant difference between the groups (* indicates p ≤ 0.05, and ** indicates p ≤ 0.01).
Figure 5
Figure 5
Identification of TGFβ producing cells in BF in IBDV infected birds. (A) The representative gating scheme for regulatory T cells in BF. Mononuclear cells were isolated from the BF of mock and infected birds and were stained with anti-CD4-PE, anti-CD25-FITC and anti-TGFβ-APC mAbs or isotype controls. The Live/Dead-Fixable aqua stain was used for dead cell exclusion. The percentages of (B) CD4+CD25+ T cells, (C) TGF-β+ in CD4+ T cells and (D) TGF-β+ in CD4+CD25+ cells in mock-inoculated and 228E and F52/70- infected two-day old birds and (E) CD4+CD25+ T cells, (F) TGF-β+ in CD4+ T cells and (G) TGF-β+ in CD4+CD25+ cells in two-week old birds are shown. The mean ± SEM value are shown as bars. * indicates a statistically significant difference (* indicates p ≤ 0.05, ** indicates p ≤ 0.01, *** indicates p ≤ 0.001, and **** indicates p ≤ 0.0001).
Figure 6
Figure 6
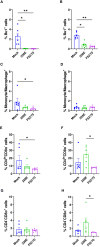
Quantification of the immune cell populations in the PBMCs. At 13 dpi, six birds from each group were bled to isolate PBMCs and stained for flow cytometric analysis. The frequencies of Bu1+ cells in (A) two-day old and (B) two-week old, macrophages (Kul01+) in (C) two-day old and (D) two-week old, CD4brCD8α- in (E) two-day old and (F) two-week old, and CD4-CD8α+ cell populations in (G) two-day old and (H) two-week old infected and uninfected birds are presented in the graphs. The bars represent the means, and the error bars represent the standard errors of the mean (SEM). An asterisk (*) over bar indicates a significant difference (* indicates p ≤ 0.05, and ** indicates p ≤ 0.01).
Figure 7
Figure 7
Quantification of the immune cell populations in the spleen. In the second animal experiment, splenocytes were isolated from the birds at 3, 7, and 28 dpi to detect the changes in the immune cell populations. In one panel, splenocytes were stained with anti-Bu1-FITC, anti-Chicken monocyte/macrophage-KUL01-PE, anti-CD4-PE/Cy7, and anti-CD8α-Pacific Blue. Another panel used anti-CD4-PE, anti-CD8α-Pacific Blue, anti-CD25-FITC, anti-TGF-β1,2,3-APC or isotype control to stain the splenocytes. Dead cells were excluded by using the Live/Dead-Fixable Near IR stain. Similar gating strategy as employed in BF was followed. The percentages of single positive (A) Bu1+ cells, (B) monocyte/macrophage+ (KUL01+), (C) CD4brCD8α- and (D) CD4-CD8α+ are represented in the graphs at the indicated time points. The changes in the percentages of (E) CD4+CD25+ and (F) TGFβ+ in CD4+CD25+ cells were also determined. The frequencies are represented as the mean ± SEM value and shown as bars. * indicates a statistically significant difference (* indicates p ≤ 0.05, *** indicates p ≤ 0.001, and **** indicates p ≤ 0.0001).

References

    1. Eterradossi N, Saif YM. Infectious bursal disease. Dis Poultry. (2020) 257–83. doi: 10.1002/9781119371199.ch7 - DOI
    1. Allan WH, Faragher JT, Cullen GA. Immunosuppression by the infectious bursal agent in chickens immunised against newcastle disease. Vet Rec (1972) 90(18):511–2. doi: 10.1136/vr.90.18.511 - DOI - PubMed
    1. Sharma JM, Kim IJ, Rautenschlein S, Yeh HY. Infectious bursal disease virus of chickens: pathogenesis and immunosuppression. Dev Comp Immunol (2000) 24(2-3):223–35. doi: 10.1016/s0145-305x(99)00074-9 - DOI - PubMed
    1. Berg TP. Acute infectious bursal disease in poultry: A review. Avian Pathol (2000) 29(3):175–94. doi: 10.1080/03079450050045431 - DOI - PubMed
    1. Cazaban C, Gardin Y, Oort R. Gumboro disease-a persisting problem. Libourne: Ceva Santé Animale (2017), 4–5.

Publication types

Substances