High Gamma-Aminobutyric Acid (GABA) Oolong Tea Alleviates High-Fat Diet-Induced Metabolic Disorders in Mice
- PMID: 37744823
- PMCID: PMC10515172
- DOI: 10.1021/acsomega.3c04874
High Gamma-Aminobutyric Acid (GABA) Oolong Tea Alleviates High-Fat Diet-Induced Metabolic Disorders in Mice
Abstract
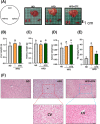
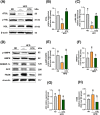
Obesity and overweight are associated with an increasing risk of developing health conditions and chronic non-communicable diseases, including cardiovascular diseases, cancer, musculoskeletal problems, respiratory problems, and mental health, and its prevalence is rising. Diet is one of three primary lifestyle interventions. Many bioactive components in tea especially oolong tea, including flavonoids, gamma-aminobutyric acid (GABA), and caffeine were reported to show related effects in reducing the risk of obesity. However, the effects of GABA oolong tea extracts (OTEs) on high-fat diet (HFD)-induced obesity are still unclear. Therefore, this study aims to explore whether the intervention of GABA OTEs can prevent HFD-induced obesity and decipher its underlying mechanisms using male C57BL/6 J mice. The result indicated that GABA OTEs reduced leptin expression in epididymal adipose tissue and showed a protective effect on nonalcoholic fatty liver disease. It promoted thermogenesis-related protein of uncoupling protein-1 and peroxisome proliferator-activated receptor-gamma coactivator (PGC-1α), boosted lipid metabolism, and promoted fatty acid oxidation. It also reduced lipogenesis-related protein levels of sterol regulatory element binding protein, acetyl-CoA carboxylase, and fatty acid synthase and inhibited hepatic triglyceride (TG) levels. These data suggest that regular drinking of GABA oolong tea has the potential to reduce the risk of being overweight, preventing obesity development through thermogenesis, lipogenesis, and lipolysis.
© 2023 The Authors. Published by American Chemical Society.
Conflict of interest statement
The authors declare no competing financial interest.
Figures


Similar articles
-
Oolong tea extract alleviates weight gain in high-fat diet-induced obese rats by regulating lipid metabolism and modulating gut microbiota.Food Funct. 2022 Mar 7;13(5):2846-2856. doi: 10.1039/d1fo03356e. Food Funct. 2022. PMID: 35179170
-
Novel insights of dietary polyphenols and obesity.J Nutr Biochem. 2014 Jan;25(1):1-18. doi: 10.1016/j.jnutbio.2013.09.001. J Nutr Biochem. 2014. PMID: 24314860 Free PMC article. Review.
-
Monascin and ankaflavin act as natural AMPK activators with PPARα agonist activity to down-regulate nonalcoholic steatohepatitis in high-fat diet-fed C57BL/6 mice.Food Chem Toxicol. 2014 Feb;64:94-103. doi: 10.1016/j.fct.2013.11.015. Epub 2013 Nov 22. Food Chem Toxicol. 2014. PMID: 24275089
-
P2Y2R Deficiency Ameliorates Hepatic Steatosis by Reducing Lipogenesis and Enhancing Fatty Acid β-Oxidation through AMPK and PGC-1α Induction in High-Fat Diet-Fed Mice.Int J Mol Sci. 2021 May 24;22(11):5528. doi: 10.3390/ijms22115528. Int J Mol Sci. 2021. PMID: 34073834 Free PMC article.
-
The ménage à trois of autophagy, lipid droplets and liver disease.Autophagy. 2022 Jan;18(1):50-72. doi: 10.1080/15548627.2021.1895658. Epub 2021 Apr 2. Autophagy. 2022. PMID: 33794741 Free PMC article. Review.
Cited by
-
Contributions of Gamma-Aminobutyric Acid (GABA) Produced by Lactic Acid Bacteria on Food Quality and Human Health: Current Applications and Future Prospects.Foods. 2024 Aug 1;13(15):2437. doi: 10.3390/foods13152437. Foods. 2024. PMID: 39123629 Free PMC article. Review.
-
Mechanism of Valeriana officinalis L. extract improving atherosclerosis by regulating PGC-1α/Sirt3/Epac1 pathway.Front Pharmacol. 2024 Nov 19;15:1483518. doi: 10.3389/fphar.2024.1483518. eCollection 2024. Front Pharmacol. 2024. PMID: 39629078 Free PMC article.
-
Fatty Acid Esterification of Octacosanol Attenuates Triglyceride and Cholesterol Synthesis in Mice.J Agric Food Chem. 2025 Jan 29;73(4):2430-2442. doi: 10.1021/acs.jafc.4c10201. Epub 2025 Jan 14. J Agric Food Chem. 2025. PMID: 39808738 Free PMC article.
-
Chronic hexavalent chromium exposure induces oxidative stress-mediated molecular cascades in Thymallus grubii gills: evidence from integrated transcriptomics and metabolomics.Front Immunol. 2025 Jul 9;16:1633174. doi: 10.3389/fimmu.2025.1633174. eCollection 2025. Front Immunol. 2025. PMID: 40703519 Free PMC article.
-
Caffeine: a potential mechanism for anti-obesity.Purinergic Signal. 2024 May 28. doi: 10.1007/s11302-024-10022-1. Online ahead of print. Purinergic Signal. 2024. PMID: 38802651 Review.
References
-
- WHO . Obesity and overweight, 2021.
-
- Barthelemy J.; Wolowczuk I. Influenza A virus infection induces white adipose tissue browning: a metabolic adaptation to infection?. J. Cell. Immunol. 2020, 2, 276–283. 10.33696/immunology.2.055. - DOI
LinkOut - more resources
Full Text Sources
Research Materials
Miscellaneous

