

Genetic assessment of the effect of red yeast (Sporidiobolus pararoseus) as a feed additive on mycotoxin toxicity in laying hens
- PMID: 37744913
- PMCID: PMC10512063
- DOI: 10.3389/fmicb.2023.1254569
Genetic assessment of the effect of red yeast (Sporidiobolus pararoseus) as a feed additive on mycotoxin toxicity in laying hens
Abstract
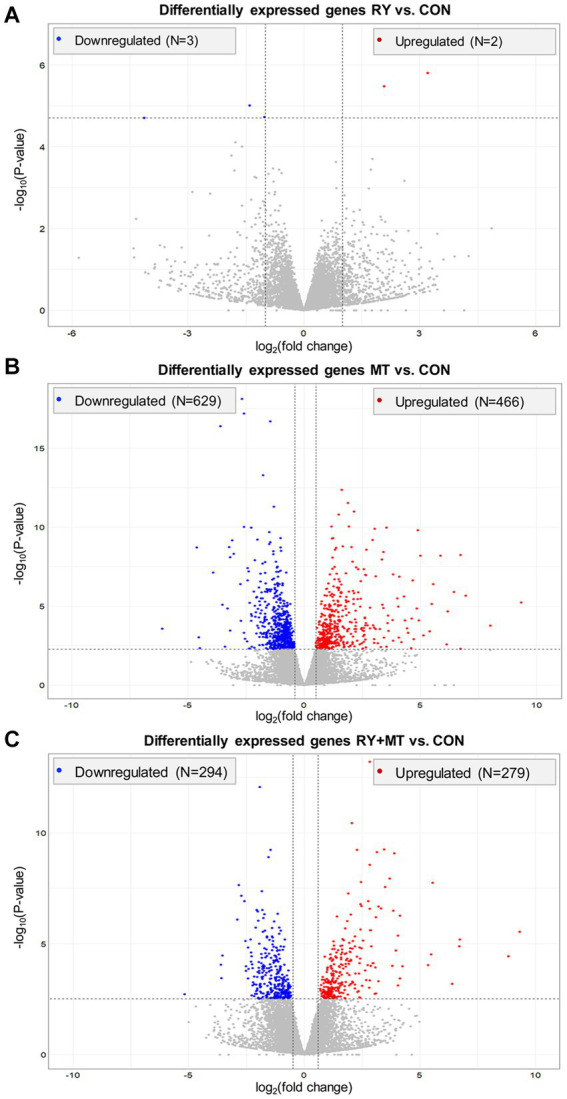
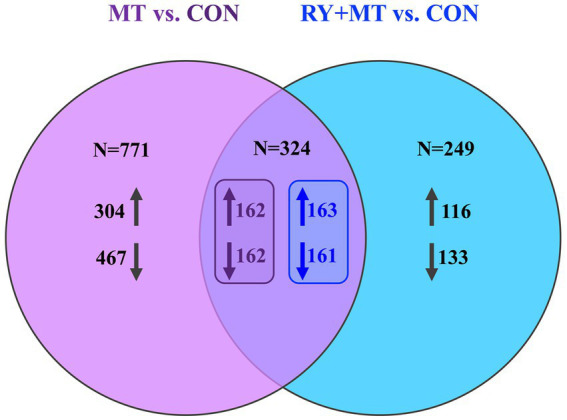
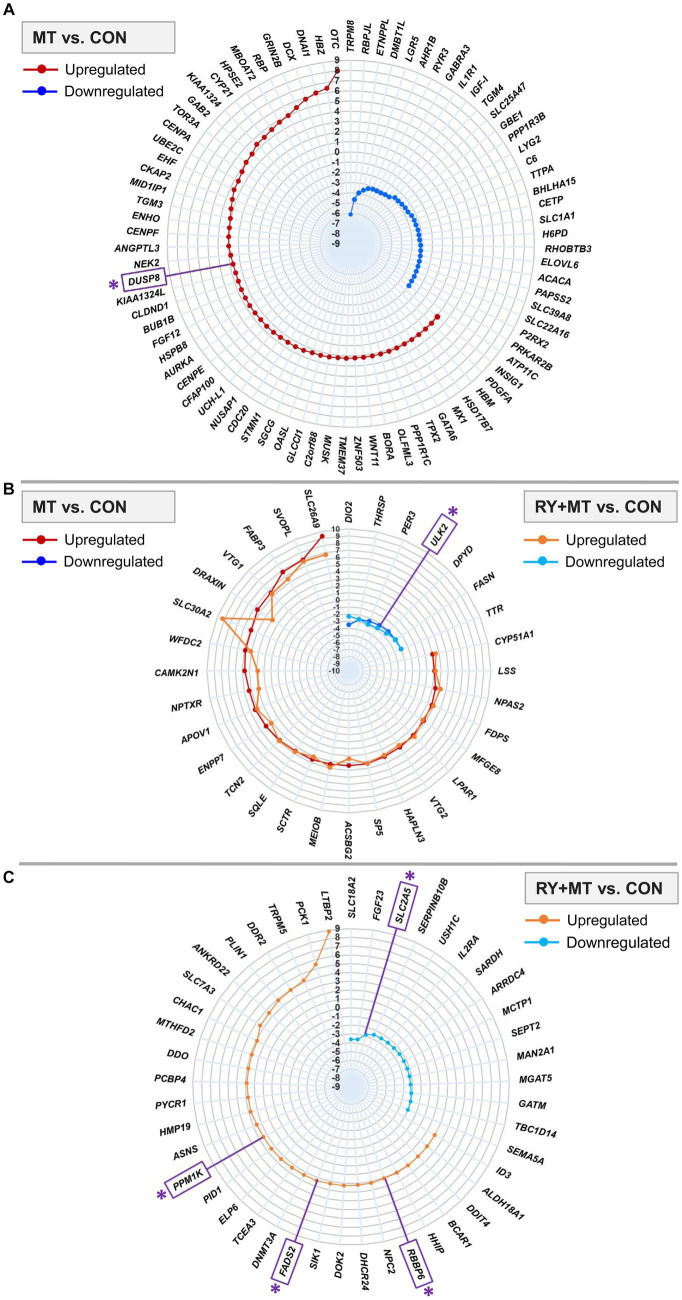
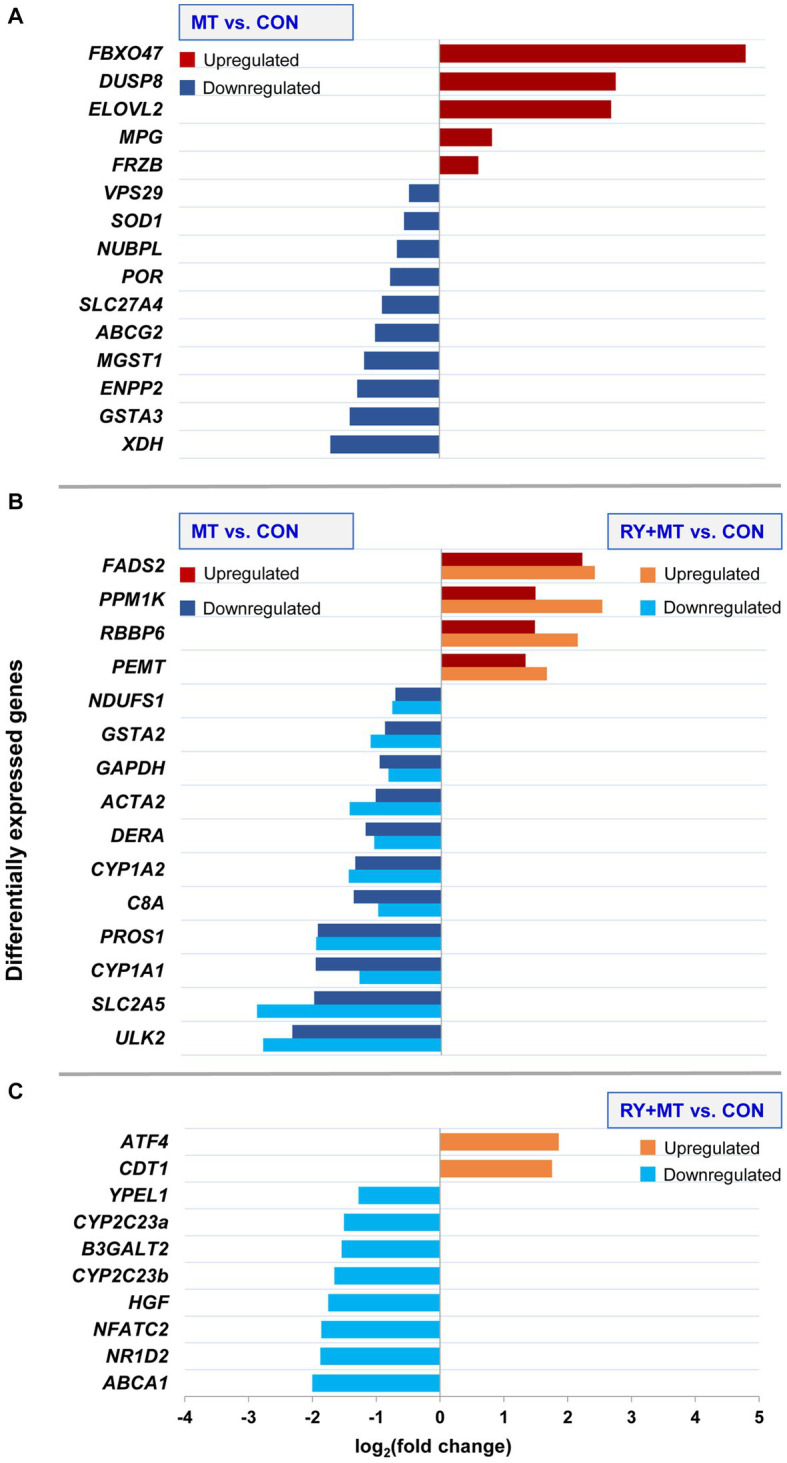
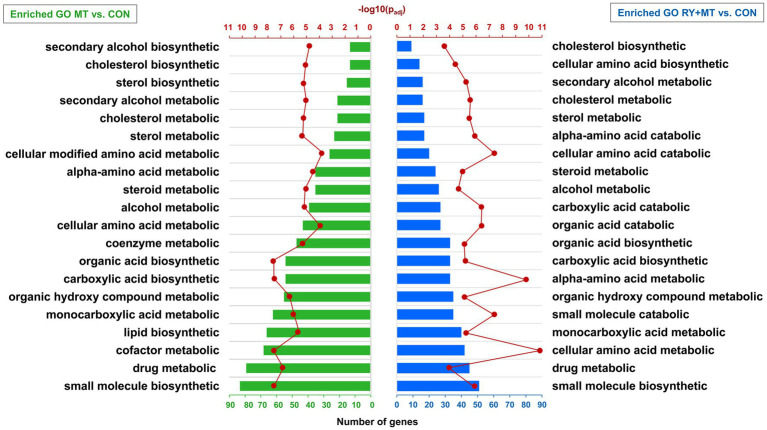
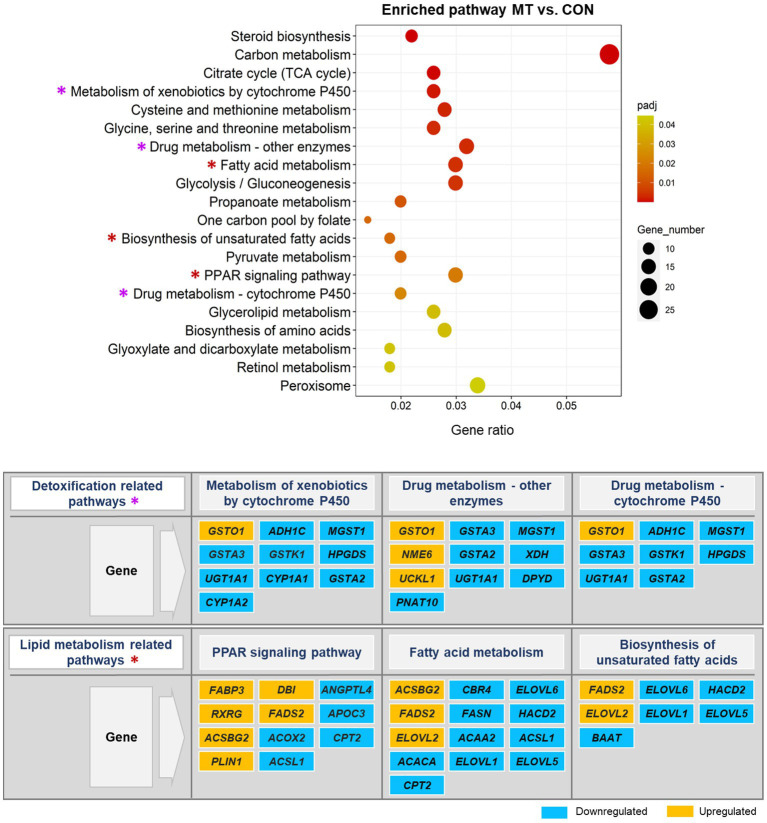
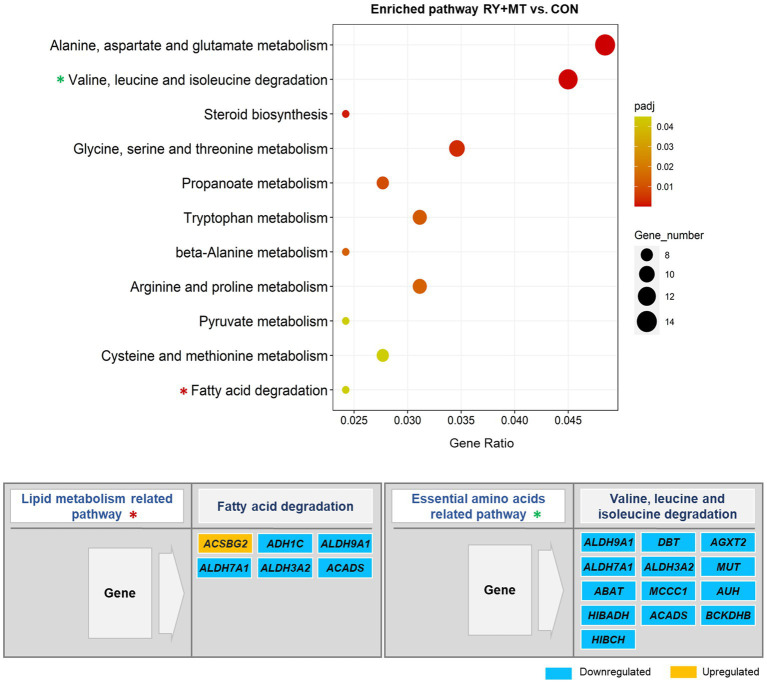
Toxic fungal species produce hazardous substances known as mycotoxins. Consumption of mycotoxin contaminated feed and food causes a variety of dangerous diseases and can even lead to death of animals and humans, raising global concerns for adverse health effects. To date, several strategies have been developed to counteract with mycotoxin contamination. Red yeast as a novel biological dietary agent is a promising strategy to eliminate mycotoxicity in living organisms. Poultry are most susceptible animals to mycotoxin contamination, as they are fed a mixture of grains and are at higher risk of co-exposure to multiple toxic fungal substances. Therefore, this study investigated the genetic mechanism underlying long-term feeding with red yeast supplementation in interaction with multiple mycotoxins using transcriptome profiling (RNA_Seq) in the liver of laying hens. The results showed a high number of significantly differentially expressed genes in liver of chicken fed with a diet contaminated with mycotoxins, whereas the number of Significantly expressed genes was considerably reduced when the diet was supplemented with red yeast. The expression of genes involved in the phase I (CYP1A1, CYP1A2) and phase II (GSTA2, GSTA3, MGST1) detoxification process was downregulated in animals fed with mycotoxins contaminated diet, indicating suppression of the detoxification mechanisms. However, genes involved in antioxidant defense (GSTO1), apoptosis process (DUSP8), and tumor suppressor (KIAA1324, FBXO47, NME6) were upregulated in mycotoxins-exposed animals, suggesting activation of the antioxidant defense in response to mycotoxicity. Similarly, none of the detoxification genes were upregulated in hens fed with red yeast supplemented diet. However, neither genes involved in antioxidant defense nor tumor suppressor genes were expressed in the animals exposed to the red yeast supplemented feed, suggesting decreases the adsorption of biologically active mycotoxins in the liver of laying hens. We conclude that red yeast can act as a mycotoxin binder to decrease the adsorption of mycotoxins in the liver of laying hens and can be used as an effective strategy in the poultry feed industry to eliminate the adverse effects of mycotoxins for animals and increase food safety for human consumers.
Keywords: RNA sequencing; detoxification; feed additive; gene expression; laying hens; mycotoxin; red yeast.
Copyright © 2023 Hosseini, Brenig, Winitchakorn, Kanmanee, Srinual, Tapingkae and Gatphayak.
Conflict of interest statement
The authors declare that the research was conducted in the absence of any commercial or financial relationships that could be construed as a potential conflict of interest.
Figures
Similar articles
-
Laying hens fed mycotoxin-contaminated feed produced by Fusarium fungi (T-2 toxin and fumonisin B1) and Saccharomyces cerevisiae lysate: Impacts on poultry health, productive efficiency, and egg quality.Microb Pathog. 2020 Dec;149:104517. doi: 10.1016/j.micpath.2020.104517. Epub 2020 Sep 29. Microb Pathog. 2020. PMID: 33007430
-
Can Red Yeast (Sporidiobolus pararoseus) Be Used as a Novel Feed Additive for Mycotoxin Binders in Broiler Chickens?Toxins (Basel). 2022 Sep 29;14(10):678. doi: 10.3390/toxins14100678. Toxins (Basel). 2022. PMID: 36287947 Free PMC article.
-
Effects of feeding grains naturally contaminated with Fusarium mycotoxins on hepatic fractional protein synthesis rates of laying hens and the efficacy of a polymeric glucomannan mycotoxin adsorbent.Poult Sci. 2005 Nov;84(11):1671-4. doi: 10.1093/ps/84.11.1671. Poult Sci. 2005. PMID: 16463962 Clinical Trial.
-
Potential adverse effects on animal health and performance caused by the addition of mineral adsorbents to feeds to reduce mycotoxin exposure.Mycotoxin Res. 2020 Feb;36(1):115-126. doi: 10.1007/s12550-019-00375-7. Epub 2019 Sep 13. Mycotoxin Res. 2020. PMID: 31515765 Free PMC article. Review.
-
Review of mycotoxin reduction in food and feed: from prevention in the field to detoxification by adsorption or transformation.Food Addit Contam Part A Chem Anal Control Expo Risk Assess. 2011 Nov;28(11):1590-609. doi: 10.1080/19440049.2011.595377. Epub 2011 Jul 20. Food Addit Contam Part A Chem Anal Control Expo Risk Assess. 2011. PMID: 21770849 Review.
References
-
- Benjamini Y., Hochberg Y. (1995). Controlling the false discovery rate: a practical and powerful approach to multiple testing. J. R. Stat. Soc. 57, 289–300. doi: 10.1111/j.2517-6161.1995.tb02031.x - DOI
LinkOut - more resources
Full Text Sources
Miscellaneous