

In vitro screening and characterization of lactic acid bacteria from Lithuanian fermented food with potential probiotic properties
- PMID: 37744916
- PMCID: PMC10516296
- DOI: 10.3389/fmicb.2023.1213370
In vitro screening and characterization of lactic acid bacteria from Lithuanian fermented food with potential probiotic properties
Abstract
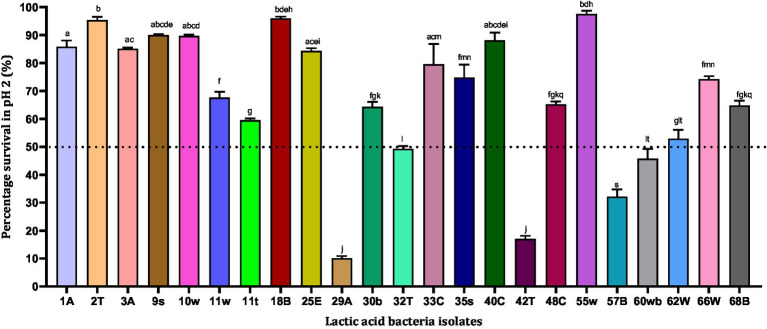
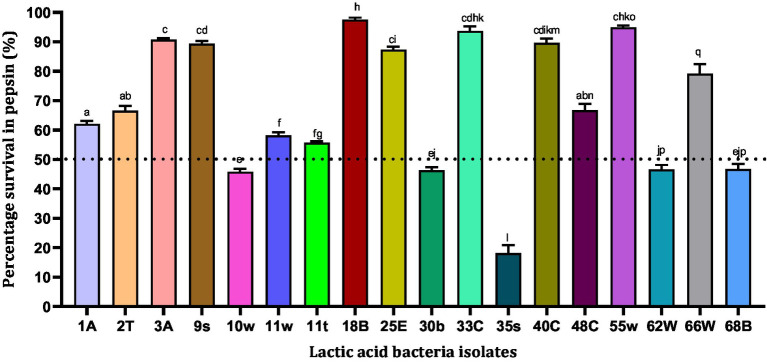
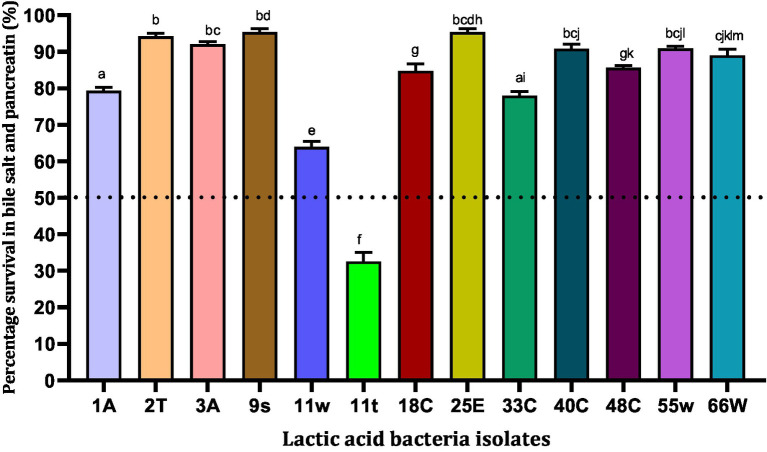
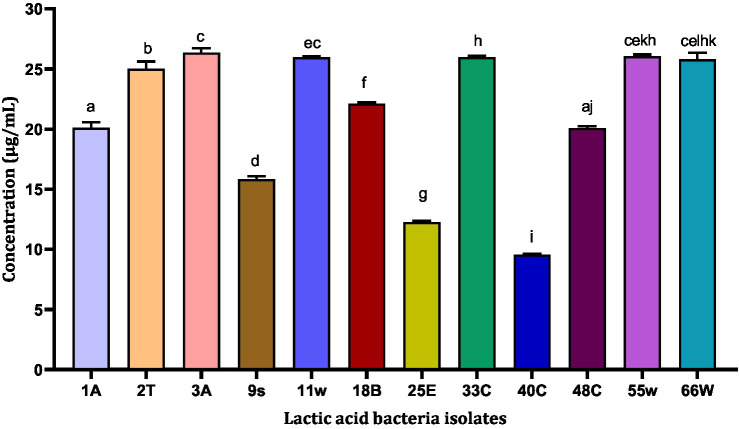
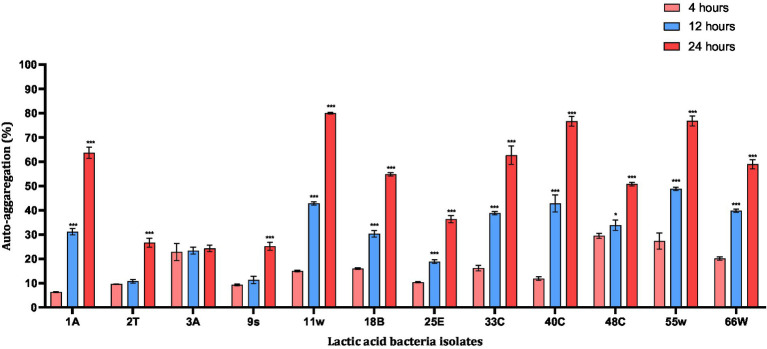
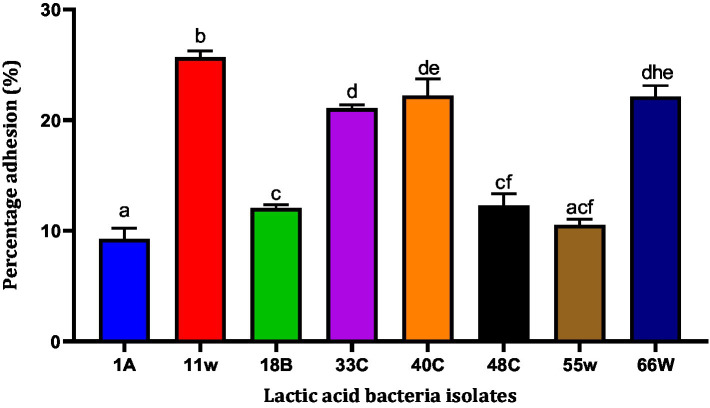
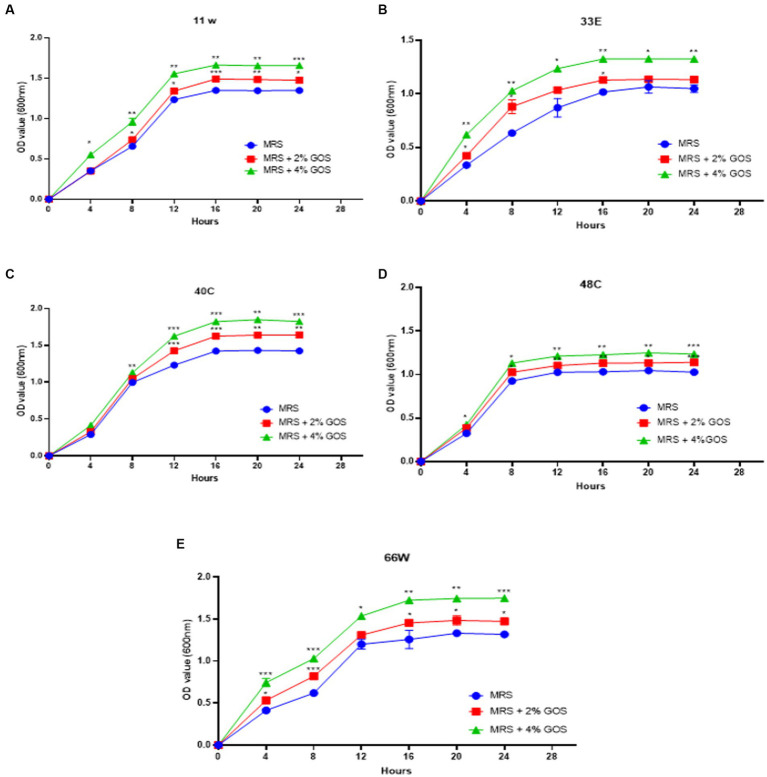
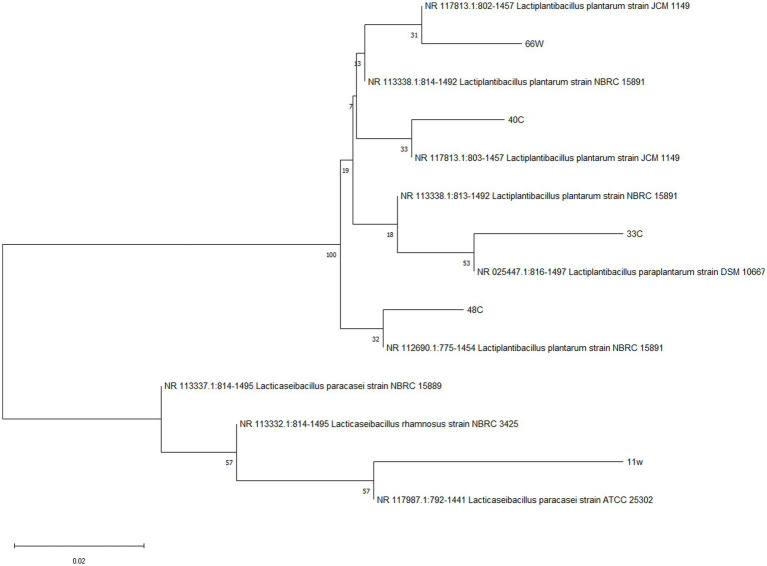
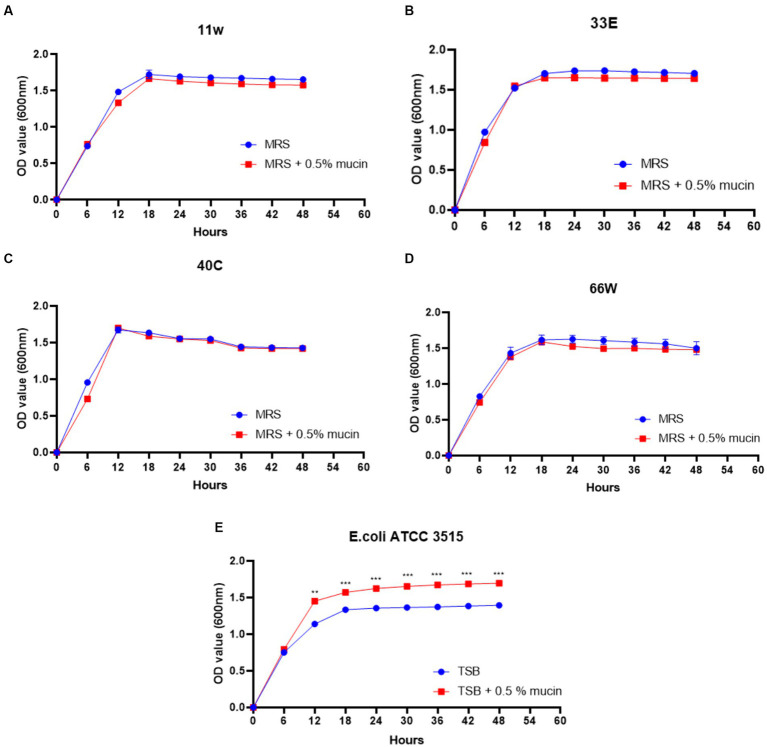
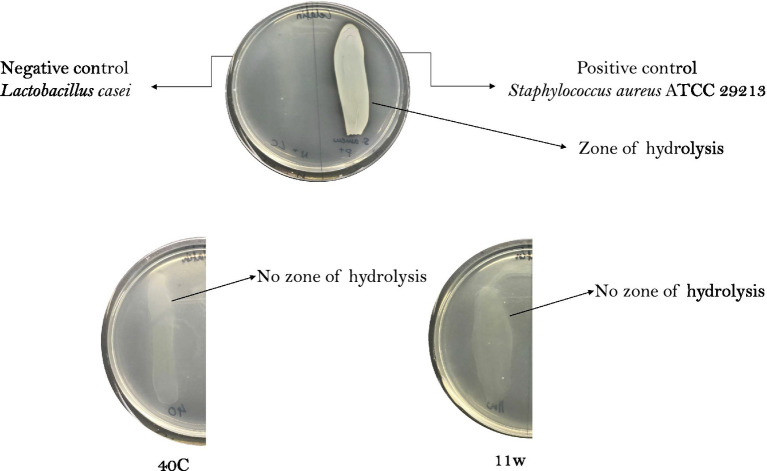
The present work aimed to identify probiotic candidates from Lithuanian homemade fermented food samples. A total of 23 lactic acid bacteria were isolated from different fermented food samples. Among these, only 12 showed resistance to low pH, tolerance to pepsin, bile salts, and pancreatin. The 12 strains also exhibited antimicrobial activity against Staphylococcus aureus ATCC 29213, Salmonella Typhimurium ATCC 14028, Streptococcus pyogenes ATCC 12384, Streptococcus pyogenes ATCC 19615, and Klebsiella pneumoniae ATCC 13883. Cell-free supernatants of isolate 3A and 55w showed the strongest antioxidant activity of 26.37 μg/mL and 26.06 μg/mL, respectively. Isolate 11w exhibited the strongest auto-aggregation ability of 79.96% as well as the strongest adhesion to HCT116 colon cells (25.671 ± 0.43%). The selected strains were tested for their synbiotic relation in the presence of a prebiotic. The selected candidates showed high proliferation in the presence of 4% as compared to 2% galactooligosaccharides. Among the strains tested for tryptophan production ability, isolate 11w produced the highest L-tryptophan levels of 16.63 ± 2.25 μm, exhibiting psychobiotic ability in the presence of a prebiotic. The safety of these strains was studied by ascertaining their antibiotic susceptibility, mucin degradation, gelatin hydrolysis, and hemolytic activity. In all, isolates 40C and 11w demonstrated the most desirable probiotic potentials and were identified by 16S RNA and later confirmed by whole genome sequencing as Lacticaseibacillus paracasei 11w, and Lactiplantibacillus plantarum 40C: following with the harboring plasmid investigation. Out of all the 23 selected strains, only Lacticaseibacillus paracasei 11w showed the potential and desirable probiotic properties.
Keywords: GIT-gastrointestinal tract; fermented food; in vitro screening; lactic acid bacteria; potential probiotics; probiotics LAB-lactic acid bacteria; safety assessment; tryptophan.
Copyright © 2023 Megur, Daliri, Balnionytė, Stankevičiūtė, Lastauskienė and Burokas.
Conflict of interest statement
The authors declare that the research was conducted in the absence of any commercial or financial relationships that could be construed as a potential conflict of interest.
Figures
Similar articles
-
In vitro properties of potential probiotic lactic acid bacteria originating from Ghanaian indigenous fermented milk products.World J Microbiol Biotechnol. 2021 Feb 17;37(3):52. doi: 10.1007/s11274-021-03013-6. World J Microbiol Biotechnol. 2021. PMID: 33594545
-
Probiotic and functional potential of lactic acid bacteria isolated from pulque and evaluation of their safety for food applications.Front Microbiol. 2023 Sep 12;14:1241581. doi: 10.3389/fmicb.2023.1241581. eCollection 2023. Front Microbiol. 2023. PMID: 37779722 Free PMC article.
-
Lactic Acid Bacteria from Northern Thai (Lanna) Fermented Foods: A Promising Source of Probiotics with Applications in Synbiotic Formulation.Foods. 2025 Jan 14;14(2):244. doi: 10.3390/foods14020244. Foods. 2025. PMID: 39856910 Free PMC article.
-
Characterization of Lactic Acid Bacterium Exopolysaccharide, Biological, and Nutritional Evaluation of Probiotic Formulated Fermented Coconut Beverage.Int J Food Sci. 2024 Sep 2;2024:8923217. doi: 10.1155/2024/8923217. eCollection 2024. Int J Food Sci. 2024. PMID: 39257841 Free PMC article. Review.
-
Lacticaseibacillus paracasei LB12, a Potential Probiotic Isolated from Traditional Iranian Fermented Milk (Doogh).Curr Microbiol. 2023 Sep 2;80(10):333. doi: 10.1007/s00284-023-03376-z. Curr Microbiol. 2023. PMID: 37658854 Review.
Cited by
-
Research progress in isolation and identification of rumen probiotics.Front Cell Infect Microbiol. 2024 May 21;14:1411482. doi: 10.3389/fcimb.2024.1411482. eCollection 2024. Front Cell Infect Microbiol. 2024. PMID: 38836057 Free PMC article. Review.
-
Screening of lactic acid bacteria from the milk of Sahiwal cows and characterization of their probiotic potential for preventing bovine mastitis.Int Microbiol. 2025 Aug;28(6):1349-1374. doi: 10.1007/s10123-024-00623-6. Epub 2024 Dec 11. Int Microbiol. 2025. PMID: 39661222
-
Assessing methods for estimating microbial lag phase duration: a comparative analysis using Saccharomyces cerevisiae empirical and simulated data.FEMS Yeast Res. 2025 Jan 30;25:foaf033. doi: 10.1093/femsyr/foaf033. FEMS Yeast Res. 2025. PMID: 40643251 Free PMC article.
-
Biotechnological Potential and Safety Evaluation of Dextran- and Riboflavin-Producing Weisella cibaria Strains for Gluten-Free Baking.Foods. 2023 Dec 24;13(1):69. doi: 10.3390/foods13010069. Foods. 2023. PMID: 38201097 Free PMC article.
-
Investigation of Probiotic Properties of Lacticaseibacillus casei 4 N-6 Strain Isolated From Cow Milk.Food Sci Nutr. 2025 Apr 24;13(4):e70205. doi: 10.1002/fsn3.70205. eCollection 2025 Apr. Food Sci Nutr. 2025. PMID: 40291923 Free PMC article.
References
-
- Amoah I., Cairncross C., Osei E. O., Yeboah J. A., Cobbinah J. C., Rush E. (2022). Bioactive properties of bread formulated with plant-based functional ingredients before consumption and possible links with health outcomes after consumption- a review. Plant Foods Hum. Nutr. 77, 329–339. doi: 10.1007/s11130-022-00993-0, PMID: - DOI - PMC - PubMed
-
- Aquilina G., Bories G., Chesson A., Cocconcelli P. S., De Knecht J., Dierick A., et al. . (2012). NNNN suggested citation: EFSA panel on additives and products or substances used in animal feed (FEEDAP); scientific opinion on title of the opinion. EFSA J. 2, 1–10. doi: 10.2903/j.efsa.20YY.NNNN - DOI
-
- Ayivi R. D., Gyawali R., Krastanov A., Aljaloud S. O., Worku M., Tahergorabi R., et al. . (2020). Lactic acid bacteria: food safety and human health applications. Dairy 1, 202–232. doi: 10.3390/dairy1030015 - DOI
-
- Ayyash M. M., Abdalla A. K., AlKalbani N. S., Baig M. A., Turner M. S., Liu S.-Q., et al. . (2021). Invited review: characterization of new probiotics from dairy and nondairy products-insights into acid tolerance, bile metabolism and tolerance, and adhesion capability. J. Dairy Sci. 104, 8363–8379. doi: 10.3168/jds.2021-20398, PMID: - DOI - PubMed
-
- Ballini A., Gnoni A., Vito D. D. E., Dipalma G., Cantore S., Gargiulo Isacco C., et al. . (2019). Effect of probiotics on the occurrence of nutrition absorption capacities in healthy children: a randomized double-blinded placebo-controlled pilot study. Eur. Rev. Med. Pharmacol. Sci. 23, 8645–8657. doi: 10.26355/eurrev_201910_19182, PMID: - DOI - PubMed
LinkOut - more resources
Full Text Sources
Molecular Biology Databases
Miscellaneous