. 2023 Sep 1;3(1):vbad118.
doi: 10.1093/bioadv/vbad118. eCollection 2023.

An improved framework for detecting discrete epidemiologically meaningful partitions in hierarchically clustered genetic data

Affiliations

An improved framework for detecting discrete epidemiologically meaningful partitions in hierarchically clustered genetic data

David K Jacobson et al. Bioinform Adv. .

Abstract

Motivation: Hierarchical clustering of microbial genotypes has the limitation that hierarchical clusters are nested, where smaller groups of related isolates exist within larger groups that get progressively larger as relationships become increasingly distant. In an epidemiologic context, investigators must dissect hierarchical trees into discrete groupings that are epidemiologically meaningful. We recently described a statistical framework (Method A) for dissecting hierarchical trees that attempts to minimize investigator bias. Here, we apply a modified version of that framework (Method B) to a hierarchical tree constructed from 2111 genotypes of the foodborne parasite Cyclospora, including 639 genotypes linked to epidemiologically defined outbreaks. To evaluate Method B's performance, we examined the concordance between these epidemiologically defined groupings and the genetic partitions identified. We also used the same epidemiologic clusters to evaluate the performance of Method A, plus two tree-dissection methods (cutreeHybrid and cutreeDynamic) available within the Dynamic Tree Cut R package, in addition to the TreeCluster method and PARNAS.

Results: Compared to the other methods, Method B, TreeCluster, and PARNAS were the most accurate (99.4%) in identifying genetic groups that reflected the epidemiologic groupings, noting that TreeCluster and PARNAS performed identically on our dataset. CutreeHybrid identified groups reflecting patterns in the wider Cyclospora population structure but lacked finer, strain-level discrimination (Simpson's D: cutreeHybrid=0.785). CutreeDynamic displayed good strain discrimination (Simpson's D = 0.933), though lacked sensitivity (77%). At two different threshold/radius settings TreeCluster/PARNAS displayed similar utility to Method B. However, Method B computes a tree-dissection threshold automatically, and the threshold/radius settings used when executing TreeCluster/PARNAS here were computed using Method B. Using a TreeCluster threshold of 0.045 as recommended in the TreeCluster documentation, epidemiologic utility dropped markedly below that of Method B.

Availability and implementation: Relevant code and data are publicly available. Source code (Method B) and instructions for its use are available here: https://github.com/Joel-Barratt/Hierarchical-tree-dissection-framework.


Conflict of interest statement

None declared.

Figures

Figure 1.
Figure 1.
Hierarchical tree generated using the present Cyclospora dataset and analysis of the genetic distance distribution observed for this dataset. A hierarchical tree generated for the present Cyclospora dataset using Ward’s method (A) reflects two distinct Cyclospora populations. Gray branches (indicated with a star) represent genotypes of C.ashfordi (along with a single isolate of C.henanensis that clusters within the C.ashfordi clade). Black branches reflect genotypes obtained from C.cayetanensis. Rare mixed-species genotypes may cluster in either of these two clades depending on their haplotype composition. The matrix used to compute this hierarchical tree was used to generate 1000 iterations of matrix M2, and a density plot was generated from the average of these 1000 M2 iterations. The distribution of distances in this average M2 matrix was bimodal, asymmetrical, and skewed (B). A quantile–quantile plot (Q–Q plot) generated from the same distribution (C) also supports that the data are not normally distributed; the gray line reflects the plot expected for a normal distribution, while the black open circles reflect the plotted coordinates obtained for the distribution of distances in (B).
Figure 2.
Figure 2.
Empiric distribution of genetic distances generated by taking the mean of 1000 iterations of M2_cayetanensis and M2_ashfordi and their corresponding Q–Q plots. Following removal of self-to-self distances, density plots were produced by taking the mean of 1000 iterations of M2_cayetanensis (A) and M2_ashfordi (C). Compared to the distribution shown in Fig. 1B, the present distributions more closely resemble a normal distribution. The Q–Q plots generated from the C.cayetanensis distribution (B) and the C.ashfordi distribution (D) support this. The gray line in (B) and (D) reflect the plot expected for a normal distribution, while the black open circles reflect the plot obtained from the corresponding distance distributions.
Figure 3.
Figure 3.
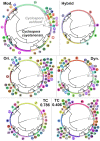
Hierarchical trees showing partitions identified using the various methods. The partitions identified via each method are indicated by colored peripheral bars, which also correspond to the colored numbers placed in near proximity to bars of the same color. Note that the numbers also correspond to the partition memberships provided in Supplementary File S1 for each method, which also provides a key to the epidemiologic linkages of genotypes (see tabs C through H). A total of 34 partitions are shown on the largest dendrogram (Mod.) generated using “Method B;” this comprises 19 partitions for C.cayetanensis (black branches) and 14 for the C.ashfordi/C.henanensis clade (gray branches, gray star). The partitions generated using “Method A” (Ori., k=52), cutreeDynamic (Dyn., k= 26), cutreeHybrid (Hyrbid, k = 6), TreeCluster; t=0.786 (TC; k = 24), and TreeCluster; t=0.406 (TC; k=52) are shown on the smaller dendrograms. For the cutreeDynamic method partitions are not always monophyletic, accounting for the multiple occurrence of some clades with the same color/number. The tree generated for PARNAS is not shown; results for PARNAS (r=0.786 and r=0.406) were identical to those obtained using TreeCluster (t=0.786 and t=0.406) except that the arbitrarily assigned partition numbers differed.

References

    1. Ahart L, Jacobson D, Rice M. et al. Retrospective evaluation of an integrated molecular-epidemiological approach to cyclosporiasis outbreak investigations - United States, 2021. Epidemiol Infect 2023;151:e131. - PMC - PubMed
    1. Anonymous. Domestically acquired cases of cyclosporiasis—United States, May–August 2018. Centers for Disease Control and Prevention, 2018.
    1. Anonymous. Domestically acquired cases of cyclosporiasis—United States, May–August 2019. Centers for Disease Control and Prevention, 2019a.
    1. Anonymous. Outbreak of cyclospora infections linked to fresh basil from Siga Logistics de RL de CV of Morelos, Mexico. Centers for Disease Control and Prevention, 2019b.
    1. Anonymous. Domestically acquired cases of cyclosporiasis—United States, May–August 2020. Centers for Disease Control and Prevention, 2020.