. 2023 Sep 14:64:102210.
doi: 10.1016/j.eclinm.2023.102210. eCollection 2023 Oct.

Characterization of long COVID temporal sub-phenotypes by distributed representation learning from electronic health record data: a cohort study

Collaborators, Affiliations

Characterization of long COVID temporal sub-phenotypes by distributed representation learning from electronic health record data: a cohort study

Arianna Dagliati et al. EClinicalMedicine. .

Abstract

Background: Characterizing Post-Acute Sequelae of COVID (SARS-CoV-2 Infection), or PASC has been challenging due to the multitude of sub-phenotypes, temporal attributes, and definitions. Scalable characterization of PASC sub-phenotypes can enhance screening capacities, disease management, and treatment planning.

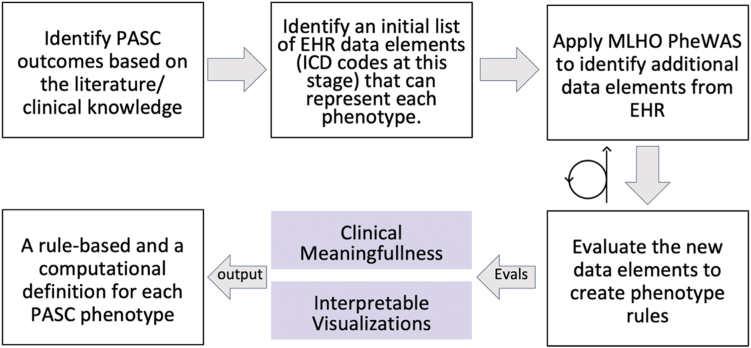
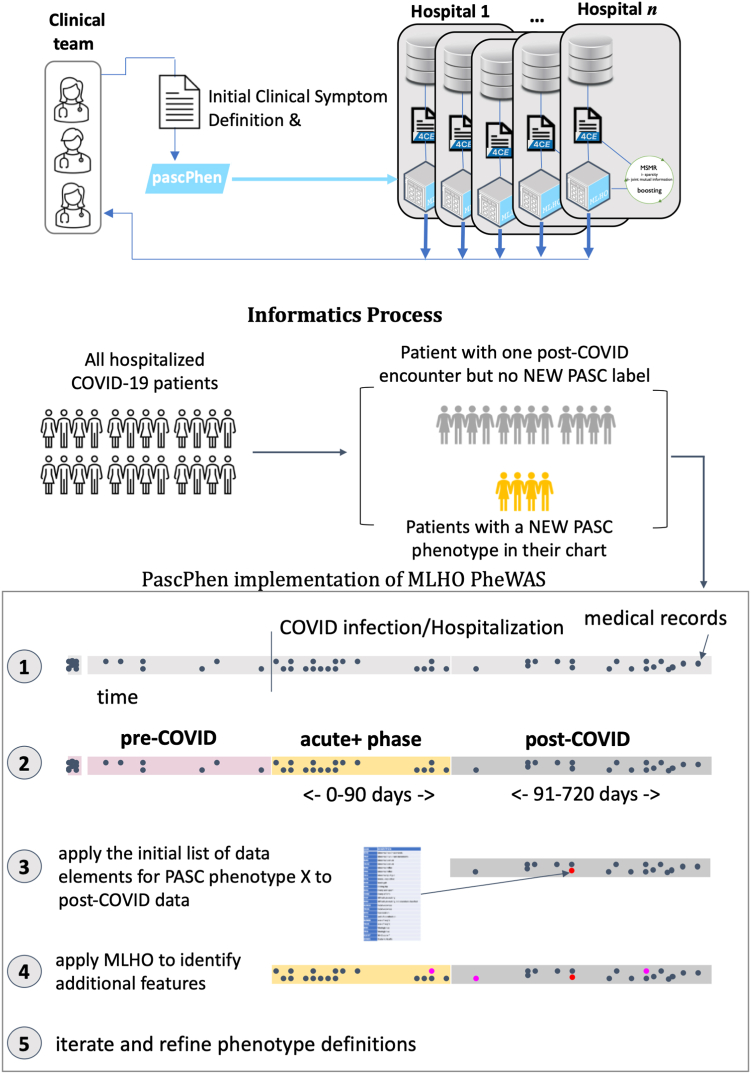
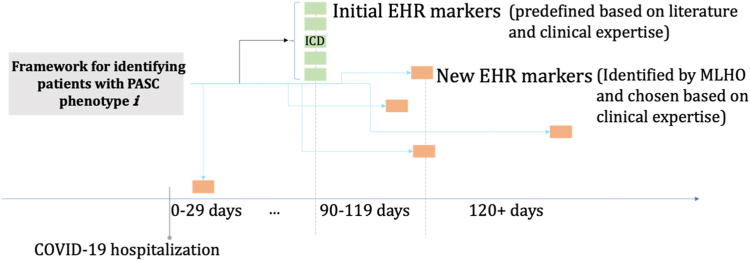
Methods: We conducted a retrospective multi-centre observational cohort study, leveraging longitudinal electronic health record (EHR) data of 30,422 patients from three healthcare systems in the Consortium for the Clinical Characterization of COVID-19 by EHR (4CE). From the total cohort, we applied a deductive approach on 12,424 individuals with follow-up data and developed a distributed representation learning process for providing augmented definitions for PASC sub-phenotypes.

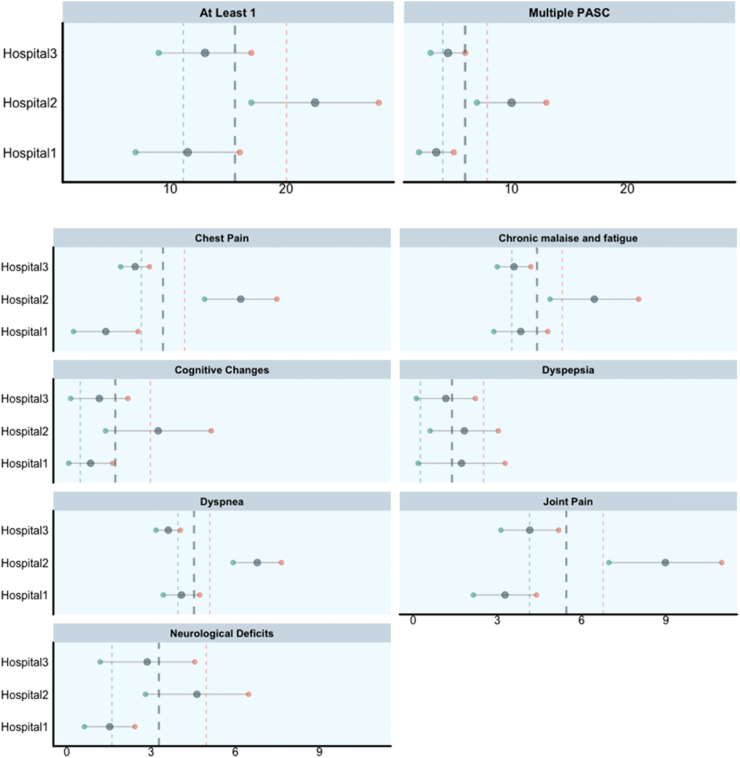
Findings: Our framework characterized seven PASC sub-phenotypes. We estimated that on average 15.7% of the hospitalized COVID-19 patients were likely to suffer from at least one PASC symptom and almost 5.98%, on average, had multiple symptoms. Joint pain and dyspnea had the highest prevalence, with an average prevalence of 5.45% and 4.53%, respectively.

Interpretation: We provided a scalable framework to every participating healthcare system for estimating PASC sub-phenotypes prevalence and temporal attributes, thus developing a unified model that characterizes augmented sub-phenotypes across the different systems.

Funding: Authors are supported by National Institute of Allergy and Infectious Diseases, National Institute on Aging, National Center for Advancing Translational Sciences, National Medical Research Council, National Institute of Neurological Disorders and Stroke, European Union, National Institutes of Health, National Center for Advancing Translational Sciences.

Keywords: COVID-19; Electronic health records; PASC; Post-acute sequelae of SARS-CoV-2; SARS-CoV-2.


Conflict of interest statement

Riccardo Bellazzi is shareholder of Biomeris s. r.l. Gilbert Omenn holds patents for U.S. Application No. 16/169,048 Filed: 24-October- 2018 and License 2023–0632 with Radial Therapeutics, Inc.; Invention Disclosure No. 2022-382.

Figures

Fig. 1
Fig. 1
Overview of the Deductive Study Pipeline in Phase 1 of the Study. MLHO leverages the informatics infrastructures developed by the 4CE for a distributed study of PASC sub-phenotypes in a deductive data-driven pipeline, in which we augmented clinical knowledge using an iterative approach.
Fig. 2
Fig. 2
The data-driven process for enriching initial PASC sub-phenotype definitions. Leveraging the initial PASC sub-phenotype definitions, we developed a distributed representation learning that identifies additional EHR data elements (i.e., encounter records) that associate with a patient having a diagnosis code for a PASC problem 90 days or longer after COVID-19 hospitalization. The process included the following steps: 1. 4CE data model is transformed to MLHO input; 2. EHR data are time stamped based on the index data into pre-COVID, acute + phase, and post-COVID; 3. Using the initial data elements, we identified potential patients with specific symptoms after a SARS-2-CoV infection; 4. The initial (core) features are removed and MLHO is applied to identify data elements during the post-COVID and acute + phase that can predict the label for a given phenotype; 5. Step 4 is iterated 5 times to compute MLHO confidence score, which quantifies the number of times a feature is identified as a predictor for a prediction/classification task.
Fig. 3
Fig. 3
Illustration of Louvain method used to cluster features. This figure shows the graph structure used to cluster core and MLHO features. Nodes annotated with f represent the features, and t nodes show the time. The weight of each connection presents the percentage of patients diagnosed with corresponding feature f at time t. In this example, clusters are separated using different colors.
Fig. 4
Fig. 4
Schematic construction of the augmented definition for a PASC sub-phenotypes. An augmented definition for a PASC sub-phenotype encompassed time-stamped features from patients' EHRs. Core features (initial EHR markers) have an a priori temporal definition of being recorded for the first time 90 days or longer after the hospitalization. MLHO features (new EHR markers) can be observed any time post hospitalization, but are time stamped to capture the temporal relationships with the core features.
Fig. 5
Fig. 5
Prevalence estimates for the overall PASC phenotype and specific PASC sub-phenotypes in the hospitalized population. Each plot reports on the horizontal axes the prevalence values as percentages of subjects identified by CORE and/or MLHO features over the total of COVID-19 hospitalized subjects. Each row represents a site via lollipop plots, reporting lower limit (green, col1), upper limit (red, col2) and average (gray, col3) values. Vertical lines represent average prevalence across hospitals, using as weight the number of subjects enrolled in the analyses by each site.
Fig. 6
Fig. 6
PASC sub-phenotype features temporal distribution. For each PASC sub-phenotype we report the number of features in each 30-day time window. The plot, which reports days on the y-axis, illustrates kernel densities on the right of each PASC sub-phenotype, mean and standard deviation (the points and the intervals over the violin plots), and jittered raw data points on the left. Temporal distributions of PASC features were compared by pairwise Wilcoxon test, with a Bonferroni correction; p-values for significant results (<0.05) are reported on the vertical lines that connect different PASC sub-phenotypes.
Fig. 7
Fig. 7
Clustered presentation and temporal distribution of the core and MLHO features. The clusters are defined using Louvain clustering. Each node of the clustering graph is presented as (f,t,p), where f presents the feature, t presents the time and p shows the percentage of patients. Blank squares present missing values and the gradient-colored dots show the value of p. The diamonds next to the features on the y-axis define the type of each feature (i.e., core vs. MLHO) and the sparklines on the right side present the overall temporal distribution of each feature.

References

    1. Huang L. 1-year outcomes in hospital survivors with COVID-19: a longitudinal cohort study. Lancet. 2021;398:747–758. - PMC - PubMed
    1. Estiri H., Strasser Z.H., Brat G.A., et al. Evolving phenotypes of non-hospitalized patients that indicate long COVID. BMC Med. 2021;19(1):249. doi: 10.1186/s12916-021-02115-0. - DOI - PMC - PubMed
    1. Al-Aly Z., Xie Y., Bowe B. High-dimensional characterization of post-acute sequelae of COVID-19. Nature. 2021;594(7862):259–264. doi: 10.1038/s41586-021-03553-9. - DOI - PubMed
    1. Zhang H. Data-driven identification of post-acute SARS-CoV-2 infection subphenotypes. Nat Med. 2022;29(1):226–235. doi: 10.1038/s41591-022-02116-3. - DOI - PMC - PubMed
    1. McGrath L.J. Use of the postacute sequelae of COVID-19 diagnosis code in routine clinical practice in the US. JAMA Netw Open. 2022;5:2235089. - PMC - PubMed

LinkOut - more resources