

Total saponins from Trillium tschonoskii Maxim promote neurological recovery in model rats with post-stroke cognitive impairment
- PMID: 37745057
- PMCID: PMC10513410
- DOI: 10.3389/fphar.2023.1255560
Total saponins from Trillium tschonoskii Maxim promote neurological recovery in model rats with post-stroke cognitive impairment
Abstract
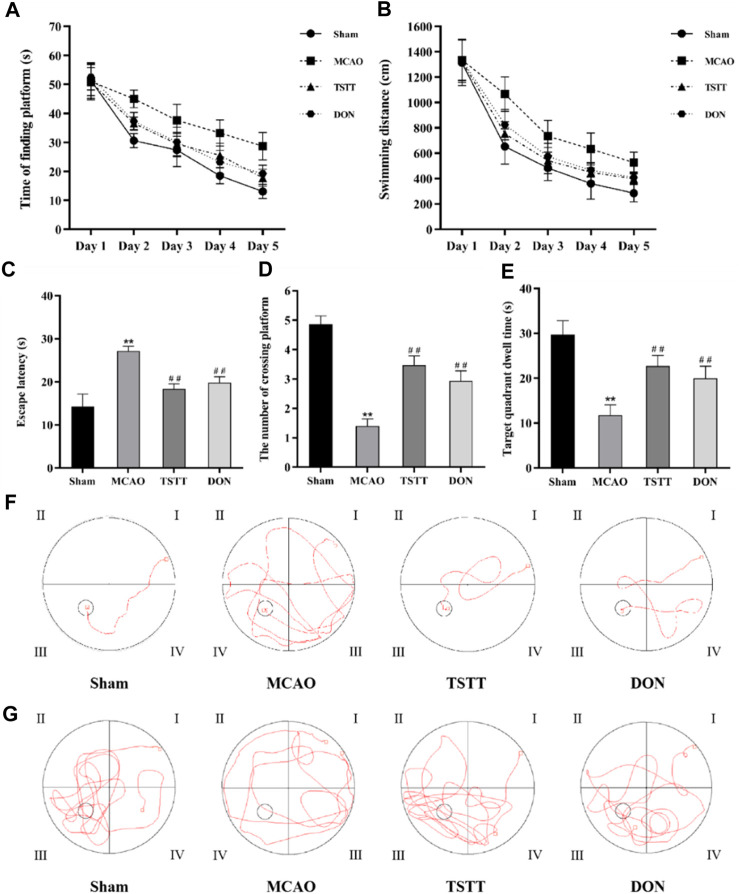
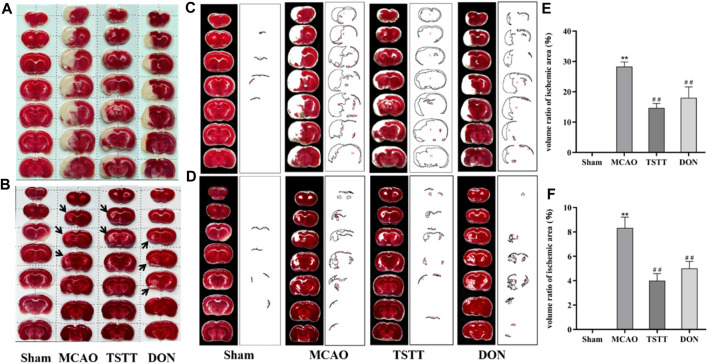
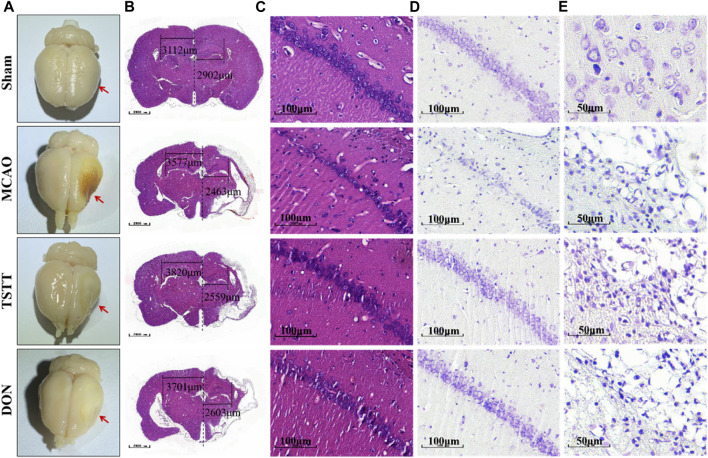
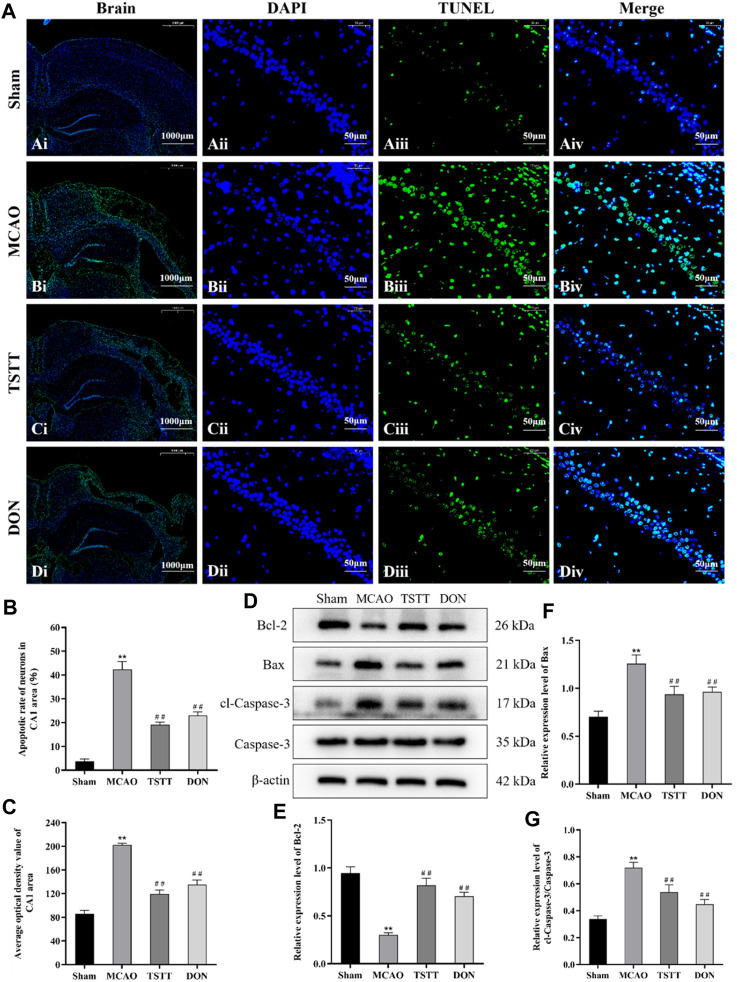
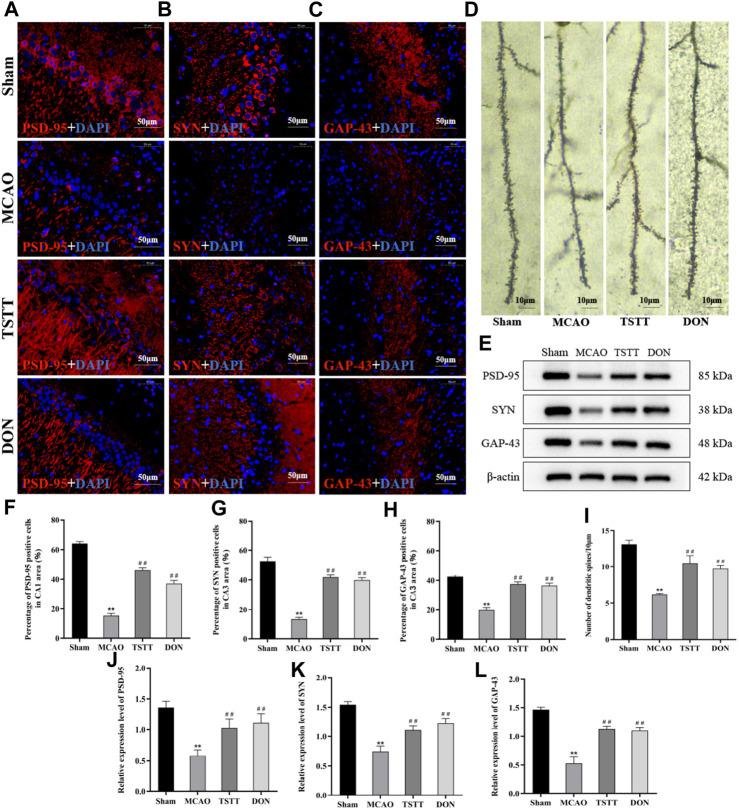
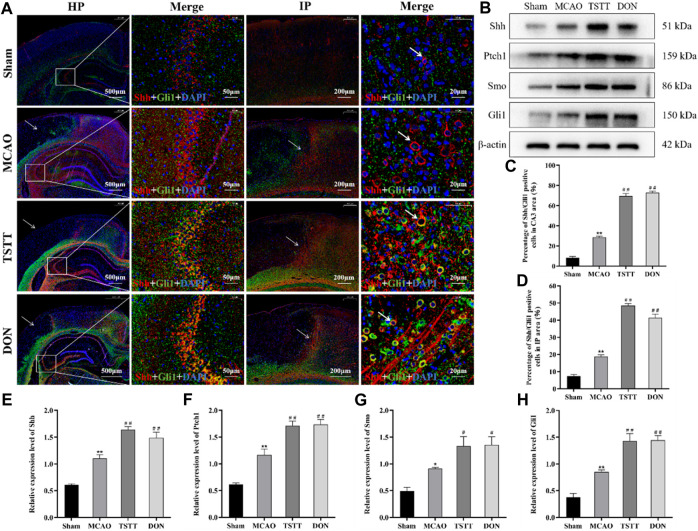
Total saponins from Trillium tschonoskii Maxim (TSTT), a bioactive component of local natural herbs in the Enshi area, China, have been demonstrated to have functions of restoring cognitive capacity and promoting axonal regeneration post-stroke, but the mechanism of this process remains unclear. The hippocampus is a critical tissue for controlling learning and memory capacity, and the sonic hedgehog (Shh) signaling pathway plays a major role in the patterning and synaptic plasticity of hippocampal neural circuits. Therefore, we aimed to investigate whether TSTT could restore learning and cognitive functions by modulating the Shh pathway in rats with post-stroke cognitive impairment (PSCI). The ischemia model was established by permanent middle cerebral artery occlusion (MCAO) in 100 Sprague-Dawley (SD) rats, and the model rats were administered using TSTT (100 mg/kg) or donepezil hydrochloride as the positive control (daily 0.45 mg/kg, DON) for 4 weeks after the operation. As assessed by the Morris water maze test, the cognitive function of PSCI rats was significantly improved upon TSTT treatment. Meanwhile, the cerebral infarct volume reduced with TSTT, as shown by HE and TTC staining, and the number of Nissl bodies and dendritic spine density were significantly increased, as shown by Nissl and Golgi staining. In addition, TSTT upregulated PSD-95, SYN, and GAP-43, and inhibited neuronal apoptosis, as evidenced by increased Bcl-2 levels along with decreased Bax and caspase-3 expression. TSTT could also significantly upregulate Shh, Ptch1, Smo, and Gli1 proteins, indicating the activation of the Shh signaling pathway. Therefore, TSTT can protect PSCI rats by inhibiting apoptosis and promoting neuronal synaptic remodeling. The Shh pathway is also involved.
Keywords: Shh signaling pathway; apoptosis; neuronal synaptic; post-stroke cognitive impairment; total saponins from Trillium tschonoskii Maxim.
Copyright © 2023 Wang, Tang, Zhao, Qin, Wang, Yang, Zhu and Chen.
Conflict of interest statement
The authors declare that the research was conducted in the absence of any commercial or financial relationships that could be construed as a potential conflict of interest.
Figures
Similar articles
-
Trillium tschonoskii rhizomes' saponins induces oligodendrogenesis and axonal reorganization for ischemic stroke recovery in rats.J Ethnopharmacol. 2021 Oct 28;279:114358. doi: 10.1016/j.jep.2021.114358. Epub 2021 Jun 21. J Ethnopharmacol. 2021. PMID: 34166736
-
Effects of total saponins from Trillium tschonoskii rhizome on grey and white matter injury evaluated by quantitative multiparametric MRI in a rat model of ischemic stroke.J Ethnopharmacol. 2018 Apr 6;215:199-209. doi: 10.1016/j.jep.2018.01.006. Epub 2018 Jan 5. J Ethnopharmacol. 2018. PMID: 29309860
-
Effect of Neurorepair for Motor Functional Recovery Enhanced by Total Saponins From Trillium tschonoskii Maxim. Treatment in a Rat Model of Focal Ischemia.Front Pharmacol. 2021 Dec 10;12:763181. doi: 10.3389/fphar.2021.763181. eCollection 2021. Front Pharmacol. 2021. PMID: 34955834 Free PMC article.
-
Trillium tschonoskii rhizome saponin improves spatial learning and memory by enhancing neurovascular restorative in ischemic rats.Phytomedicine. 2024 Dec;135:156096. doi: 10.1016/j.phymed.2024.156096. Epub 2024 Sep 27. Phytomedicine. 2024. PMID: 39396404
-
[Effects of total saponins from Trillium tschonoskii Maxim on vascular cognitive impairment and its mechanisms].Zhongguo Ying Yong Sheng Li Xue Za Zhi. 2022 Nov;38(6):797-802. doi: 10.12047/j.cjap.6355.2022.145. Zhongguo Ying Yong Sheng Li Xue Za Zhi. 2022. PMID: 37308438 Chinese.
Cited by
-
Electroacupuncture alleviated post-stroke cognitive impairment via the mTOR/NLRP3-mediated autophagy-inflammatory pathway.Eur J Med Res. 2024 Nov 5;29(1):532. doi: 10.1186/s40001-024-02131-9. Eur J Med Res. 2024. PMID: 39497200 Free PMC article.
-
Specific Mode Electroacupuncture Stimulation Mediates the Delivery of NGF Across the Hippocampus Blood-Brain Barrier Through p65-VEGFA-TJs to Improve the Cognitive Function of MCAO/R Convalescent Rats.Mol Neurobiol. 2025 Feb;62(2):1451-1466. doi: 10.1007/s12035-024-04337-8. Epub 2024 Jul 12. Mol Neurobiol. 2025. PMID: 38995444 Free PMC article.
-
Steroidal saponins: Natural compounds with the potential to reverse tumor drug resistance (Review).Oncol Lett. 2024 Oct 3;28(6):585. doi: 10.3892/ol.2024.14719. eCollection 2024 Dec. Oncol Lett. 2024. PMID: 39421314 Free PMC article. Review.
References
LinkOut - more resources
Full Text Sources
Research Materials
Miscellaneous