Accelerated stenotic flow in the left anterior descending coronary artery explains the causes of impaired coronary flow reserve: an integrated transthoracic enhanced Doppler study
- PMID: 37745100
- PMCID: PMC10515222
- DOI: 10.3389/fcvm.2023.1186983
Accelerated stenotic flow in the left anterior descending coronary artery explains the causes of impaired coronary flow reserve: an integrated transthoracic enhanced Doppler study
Abstract
Background: Accelerated stenotic flow (AsF) in the entire left anterior descending coronary artery (LAD), assessed by transthoracic enhanced color Doppler (E-Doppler TTE), can reveal coronary stenosis (CS) and its severity, enabling a distinction between the microcirculatory and epicardial causes of coronary flow reserve (CFR) impairment.
Methods: Eighty-four consecutive patients with a CFR <2.0 (1.5 ± 0.4), as assessed by E-Doppler TTE, scheduled for coronary angiography (CA) and eventually intracoronary ultrasounds (IVUS), were studied. CFR was calculated by the ratio of peak diastolic flow velocities: during i.v. adenosine (140 mcg/Kg/m) over resting; AsF was calculated as the percentage increase of localized maximal velocity in relation to a reference velocity.
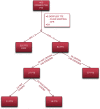
Results: CA showed ≥50% lumen diameter narrowing of the LAD (critical CS) in 68% of patients (57/84) vs. non-critical CS in 32% (27/84). Based on the established CA/IVUS criteria, the non-critical CS subgroup was further subdivided into 2 groups: subcritical/diffuse [16/27 pts (57%)] and no atherosclerosis [11/27 pts (43%)]. CFR was similar in the three groups: 1.4 ± 0.3 in critical CS, 1.5 ± 0.4 in subcritical/diffuse CS, and 1.6 ± 0.4 in no atherosclerosis (p = ns). Overall, at least one segment of accelerated stenotic flow in the LAD was found in 73 patients (87%), while in 11 (13%) it was not. The AsF was very predictive of coronary segmental narrowing in both angio subgroups of atherosclerosis but as expected with the usage of different cutoffs. On the basis of the ROC curve, the optimal cutoff was 109% and 16% AsF % increment to successfully distinguish critical from non-critical CS (area under the curve [AUC] = 0.99, p < 0.001) and diffuse/subcritical from no CS (AUC = 0.91%, p < 0.001). Sensitivity and specificity were 96% and 100% and 82% and 100%, respectively.
Conclusion: E-Doppler TTE is highly feasible and reliable in detecting the CS of any grade of severity, distinguishing epicardial athero from microvascular causes of a severe CFR reduction.
Keywords: accelerated stenotic flow; coronary flow reserve (CFR); coronary physiology; critical coronary stenosis; diffuse coronary atherosclerosis; enhanced transthoracic Doppler echocardiography; subcritical coronary stenosis.
© 2023 Caiati, Pollice, Iacovelli, Sturdà and Lepera.
Conflict of interest statement
The authors declare that the research was conducted in the absence of any commercial or financial relationships that could be construed as a potential conflict of interest.
Figures


Similar articles
-
Hidden Coronary Atherosclerosis Assessment but Not Coronary Flow Reserve Helps to Explain the Slow Coronary Flow Phenomenon in Patients with Angiographically Normal Coronary Arteries.Diagnostics (Basel). 2022 Sep 8;12(9):2173. doi: 10.3390/diagnostics12092173. Diagnostics (Basel). 2022. PMID: 36140575 Free PMC article.
-
Coronary Flow and Reserve by Enhanced Transthoracic Doppler Trumps Coronary Anatomy by Computed Tomography in Assessing Coronary Artery Stenosis.Diagnostics (Basel). 2021 Feb 5;11(2):245. doi: 10.3390/diagnostics11020245. Diagnostics (Basel). 2021. PMID: 33562448 Free PMC article.
-
Assessment of the Severity of Left Anterior Descending Coronary Artery Stenoses by Enhanced Transthoracic Doppler Echocardiography: Validation of a Method Based on the Continuity Equation.Diagnostics (Basel). 2023 Jul 29;13(15):2526. doi: 10.3390/diagnostics13152526. Diagnostics (Basel). 2023. PMID: 37568889 Free PMC article.
-
Simultaneous transesophageal Doppler assessment of coronary flow reserve in the left anterior descending artery and coronary sinus allows differentiation between proximal and non-proximal left anterior descending artery stenoses.Eur J Echocardiogr. 2004 Jan;5(1):25-33. doi: 10.1016/s1525-2167(03)00047-7. Eur J Echocardiogr. 2004. PMID: 15113009
-
Transthoracic Doppler echocardiography - noninvasive diagnostic window for coronary flow reserve assessment.Cardiovasc Ultrasound. 2003 Apr 11;1:4. doi: 10.1186/1476-7120-1-4. Cardiovasc Ultrasound. 2003. PMID: 12740038 Free PMC article. Review.
Cited by
-
Ability of the coronary angiography-derived index of microcirculatory resistance to predict microvascular obstruction in patients with ST-segment elevation.Front Cardiovasc Med. 2024 Apr 22;11:1187599. doi: 10.3389/fcvm.2024.1187599. eCollection 2024. Front Cardiovasc Med. 2024. PMID: 38711790 Free PMC article.
-
Innovations in Intracoronary Imaging: Present Clinical Practices and Future Outlooks.J Clin Med. 2024 Jul 12;13(14):4086. doi: 10.3390/jcm13144086. J Clin Med. 2024. PMID: 39064126 Free PMC article. Review.
-
Cellular and Molecular Bases for the Application of Polyphenols in the Prevention and Treatment of Cardiovascular Disease.Diseases. 2025 Jul 15;13(7):221. doi: 10.3390/diseases13070221. Diseases. 2025. PMID: 40710011 Free PMC article. Review.
-
Comparative study of myocardial perfusion and coronary flow velocity reserve derived from adenosine triphosphate stress myocardial contrast echocardiography in coronary lesions with no/mild stenosis.Front Cardiovasc Med. 2024 Sep 23;11:1353736. doi: 10.3389/fcvm.2024.1353736. eCollection 2024. Front Cardiovasc Med. 2024. PMID: 39380633 Free PMC article.
-
Association between optical coherence tomography-defined culprit morphologies and changes in hyperemic coronary flow after elective stenting assessed by transthoracic Doppler echocardiography.PLoS One. 2024 Aug 15;19(8):e0307384. doi: 10.1371/journal.pone.0307384. eCollection 2024. PLoS One. 2024. PMID: 39146288 Free PMC article.
References
-
- Henzel J, Kępka C, Kruk M, Makarewicz-Wujec M, Wardziak Ł, Trochimiuk P, et al. High-risk coronary plaque regression after intensive lifestyle intervention in nonobstructive coronary disease: a randomized study. JACC Cardiovasc Imaging. (2021) 14(6):1192–202. 10.1016/j.jcmg.2020.10.019 - DOI - PubMed
-
- Miller ER, Erlinger TP, Sacks FM, Svetkey LP, Charleston J, Lin P-H, et al. A dietary pattern that lowers oxidative stress increases antibodies to oxidized LDL: results from a randomized controlled feeding study. Atherosclerosis. (2005) 183(1):175–82. 10.1016/j.atherosclerosis.2005.04.001 - DOI - PubMed
LinkOut - more resources
Full Text Sources
Miscellaneous

