. 2023 Sep 7:14:1216267.
doi: 10.3389/fphys.2023.1216267. eCollection 2023.

Blocking cholesterol formation and turnover improves cellular and mitochondria function in murine heart microvascular endothelial cells and cardiomyocytes

Affiliations

Blocking cholesterol formation and turnover improves cellular and mitochondria function in murine heart microvascular endothelial cells and cardiomyocytes

Alicja Braczko et al. Front Physiol. .

Abstract

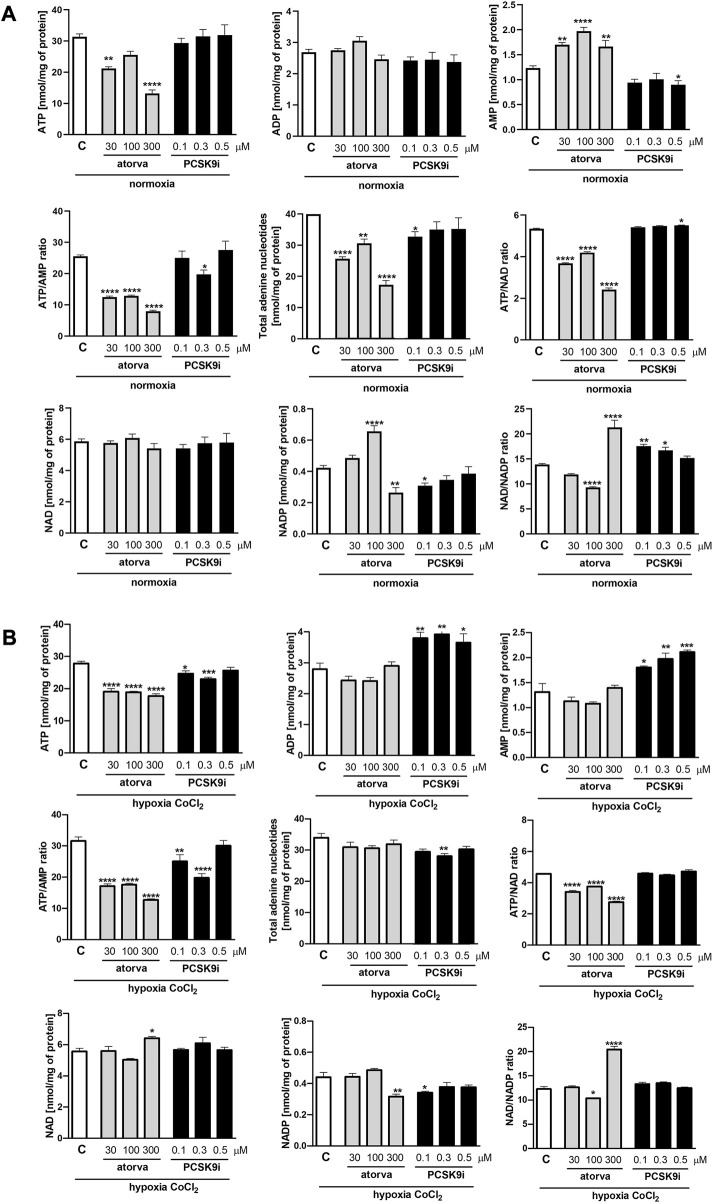
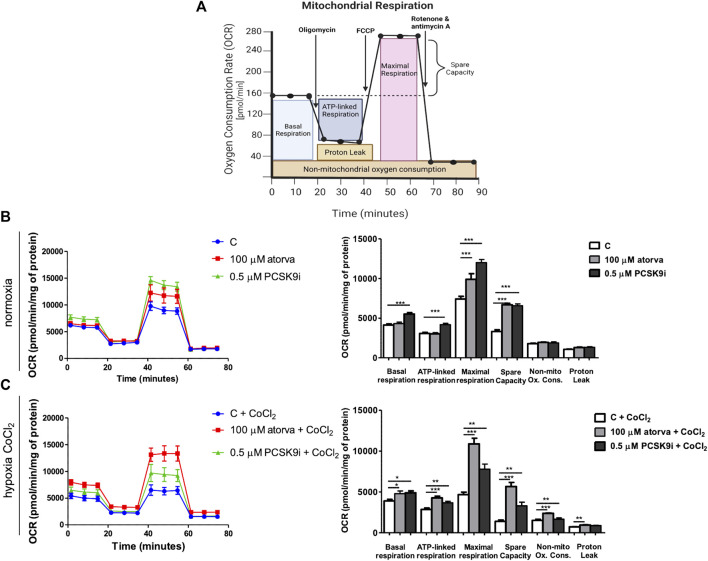
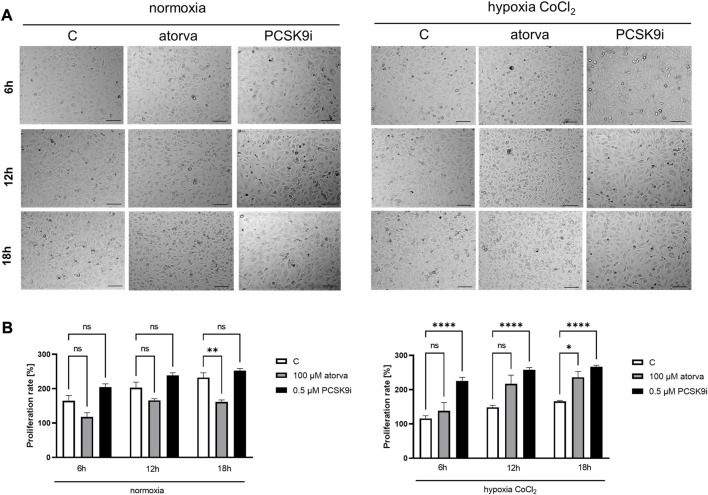
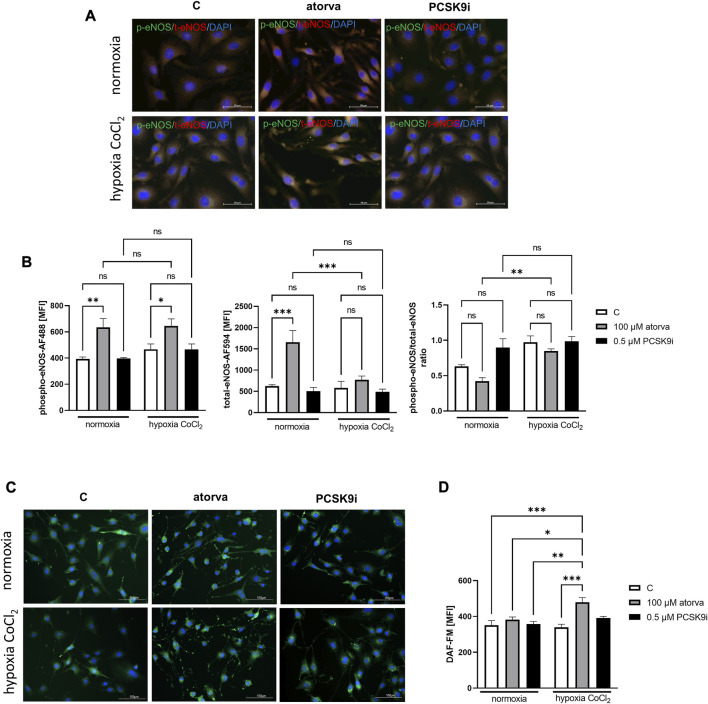
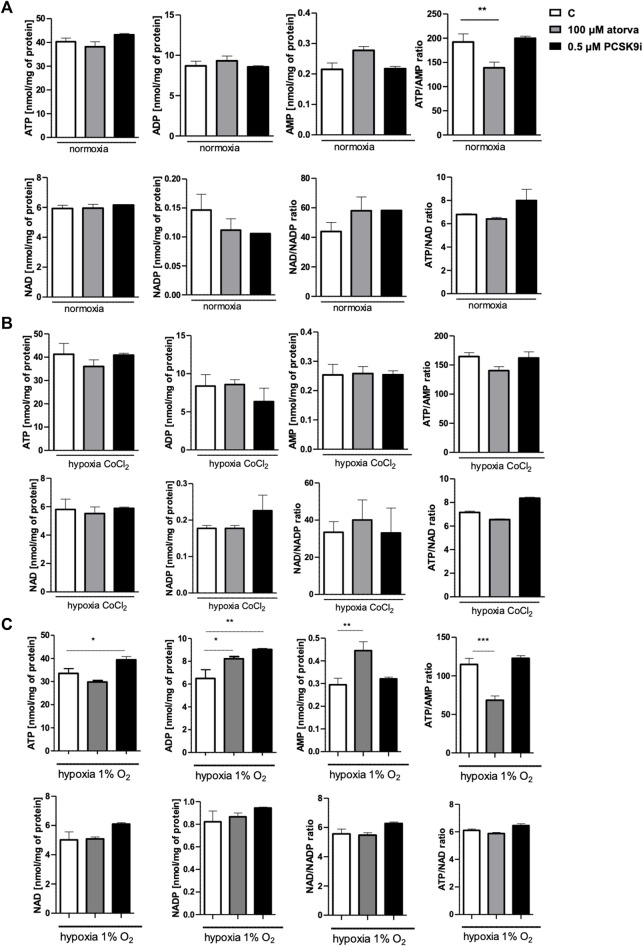
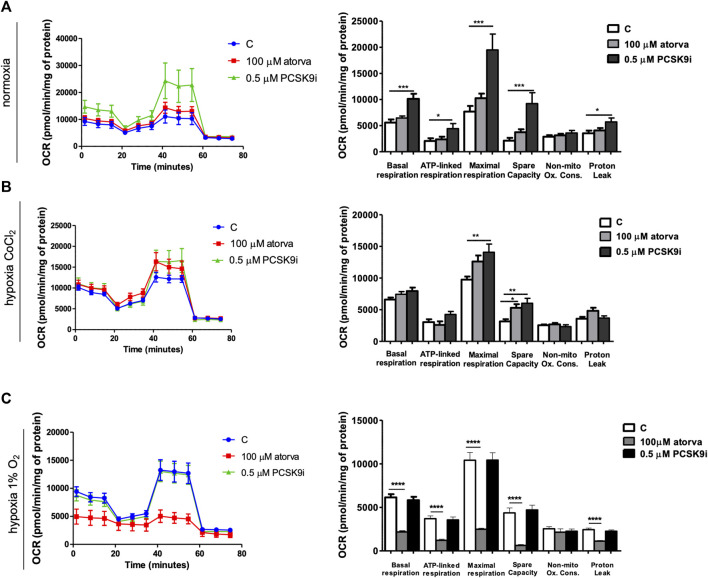
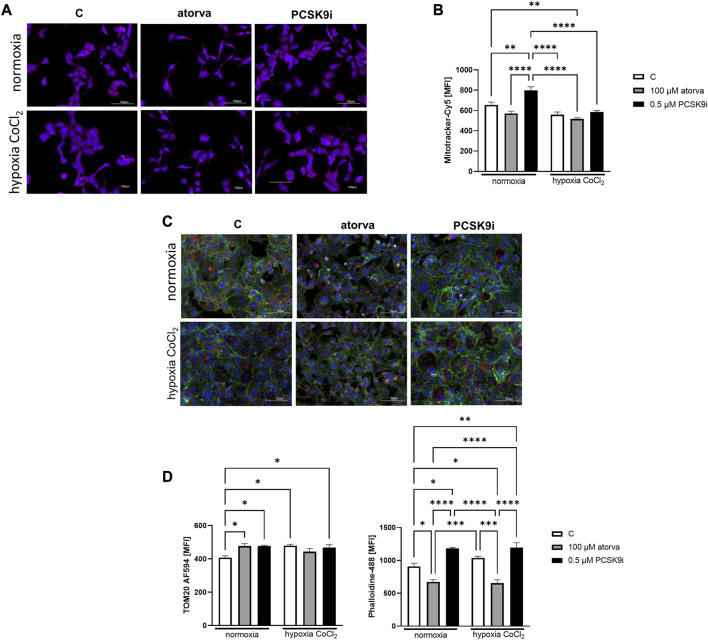
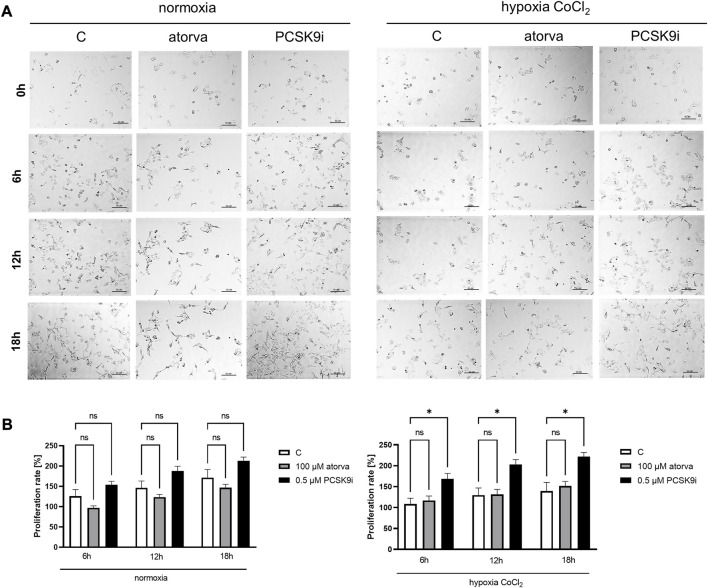
Background: Statins and proprotein convertase subtilisin/kexin type 9 inhibitors (PCSK9i) are cornerstones of therapy to prevent cardiovascular disease, acting by lowering lipid concentrations and only partially identified pleiotropic effects. This study aimed to analyze impacts of atorvastatin and synthetic peptide PCSK9i on bioenergetics and function of microvascular endothelial cells and cardiomyocytes. Methods: Mitochondrial function and abundance as well as intracellular nucleotides, membrane potential, cytoskeleton structure, and cell proliferation rate were evaluated in mouse heart microvascular endothelial cells (H5V) and cardiomyocytes (HL-1) under normal and hypoxia-mimicking conditions (CoCl2 exposure). Results: In normal conditions PCSK9i, unlike atorvastatin, enhanced mitochondrial respiratory parameters, increased nucleotide levels, prevented actin cytoskeleton disturbances and stimulated endothelial cell proliferation. Under hypoxia-mimicking conditions both atorvastatin and PCSK9i improved the mitochondrial respiration and membrane potential in both cell types. Conclusion: This study demonstrated that both treatments benefited the endothelial cell and cardiomyocyte bioenergetics, but the effects of PCSK9i were superior.

Keywords: cardiomyocytes; endothelial cells; mitochondria; proprotein convertase subtilisin/kexin type 9 (PCSK9) inhibitor; statins.


Conflict of interest statement

The authors declare that the research was conducted in the absence of any commercial or financial relationships that could be construed as a potential conflict of interest.

Figures

FIGURE 1
FIGURE 1
Intracellular nucleotide concentration in murine heart endothelial cells (H5V) after atorvastatin and PCSK9 inhibitor (PCSK9i) treatment in normoxia and hypoxia-mimicking conditions. The concentrations of adenosine triphosphate (ATP), adenosine diphosphate (ADP), adenosine monophosphate (AMP), nicotinamide adenine dinucleotide (NAD+), nicotinamide adenine dinucleotide phosphate (NADP) and the ratios of ATP/ADP and ATP/NAD + after 0.03, 0.1 and 0.3 mM atorvastatin and 100, 300, and 500 nM PCSK9i treatment under normoxia (A), CoCl2-mimicking hypoxia (0.1 mM CoCl2, 24 h) (B) conditions. Values are shown as mean ± SEM; n = 6; *p < 0.05, **p < 0.01, ***p < 0.001, ****p < 0.0001 vs. untreated cells in normoxia.
FIGURE 2
FIGURE 2
Mitochondria function in murine heart endothelial cells (H5V) after atorvastatin and PCSK9 inhibitor (PCSK9i) treatment under normoxia and hypoxia-mimicking conditions. Scheme of MitoStress Test created with BioRender.com (A), Oxygen consumption rate (OCR) as presented by the Seahorse XF Extracellular Flux Analyzer after the sequential injection of oligomycin, carbonyl cyanide-p-trifluoromethoxyphenylhydrazone (FCCP) and mix of rotenone and antimycin A, and parameters of mitochondrial function in control (vehicle-pre-treated) cells and cells pre-treated with 100 µM atorvastatin or 0.5 µM PCSK9 inhibitor, after following incubation in normoxia (B) and CoCl2-mimicking hypoxia (24 h with 0.1 mM CoCl2) (C) conditions. Values are shown as mean ± SEM; n = 4; *p < 0.05, **p < 0.01, ***p < 0.001, ****p < 0.0001.
FIGURE 3
FIGURE 3
Mitochondria abundance and membrane potential in murine heart endothelial cells (H5V) after atorvastatin and PCSK9 inhibitor (PCSK9i) treatment under normoxia and hypoxia-mimicking conditions. Representative images of Mitotracker-Cy5 fluorescence staining (A) and quantitative analysis of mean fluorescence intensity (MFI) for Mitotracker-Cy5 in control (vehicle-pre-treated) cells and cells pre-treated with 100 µM atorvastatin or 0.5 µM PCSK9 inhibitor, after following incubation under normoxia and CoCl2-mimicking hypoxia (24 h with 0.1 mM CoCl2) conditions (B). Representative images for TOM20-AF594 (red), α-actin-Phalloidin488 (green) and nuclei-DAPI (blue) staining analysed using fluorescence microscope (C) and quantitative analysis of MFI for TOM20-AF584 (D). Quantitative analysis of mean fluorescence intensity for α-actin-Phalloidin488 (E). Representative images of endothelial cell mitochondria in control cells and cells pre-treated with 100 µM atorvastatin or 0.5 µM PCSK9 inhibitor, after following incubation under normoxia and CoCl2-mimicking hypoxia (24 h with 0.1 mM CoCl2) conditions (F). Values are shown as mean ± SEM; n = 6; *p < 0.05, **p < 0.01, ***p < 0.001, ****p < 0.0001.
FIGURE 4
FIGURE 4
Proliferation rates of murine heart endothelial cells (H5V) in the presence of atorvastatin and PCSK9i under normoxia and hypoxia-mimicking conditions. Representative images (A) and quantitative results of the proliferation rates of control (vehicle-pre-treated) cells and cells pre-treated with 100 µM atorvastatin or 0.5 µM PCSK9 inhibitor, after following incubation in normoxia and CoCl2-mimicking hypoxia (24 h with 0.1 mM CoCl2) conditions (B). Values are shown as mean ± SEM; n = 6; *p < 0.05, **p < 0.01, ****p < 0.0001.
FIGURE 5
FIGURE 5
Nitric oxide production in murine heart endothelial cells (H5V) after treatment with atorvastatin and PCSK9i in normoxia and hypoxia-mimicking conditions. Representative images of the co-localization (yellow area) of phosphorylated endothelial nitric oxide synthase (phospho-eNOS) stained with Alexa Fluor 488 (green) and total eNOS stained with Alexa Fluor 594 (red) (A). Quantitative analysis of mean fluorescence intensity (MFI) for phospho-eNOS, total-eNOS and phospho-eNOS/t-eNOS ratio in control (vehicle-pre-treated) cells and cells treated with 0.1 mM atorvastatin or 500 nM PCSK9 inhibitor in normoxia and CoCl2-mimicking hypoxia (24 h with 0.1 mM CoCl2) conditions (B). Representative images of NO staining by DAF-FM (green) (C) and quantitative analysis of MFI for DAF-FM (D) in control (vehicle-pre-treated) cells and cells pre-treated with 100 µM atorvastatin or 0.5 µM PCSK9 inhibitor, after following incubation under normoxia and CoCl2-mimicking hypoxia (24 h with 0.1 mM CoCl2) (B) conditions. Values are shown as mean ± SEM; n = 6; *p < 0.05, **p < 0.01, ***p < 0.001.
FIGURE 6
FIGURE 6
Intracellular nucleotide concentration in murine cardiomyocytes (HL-1) after atorvastatin and PCSK9 inhibitor (PCSK9i) treatment in normoxia, hypoxia-mimicking conditions (CoCl2) and hypoxia (1% O2). The concentrations of adenosine triphosphate (ATP), adenosine diphosphate (ADP), adenosine monophosphate (AMP), nicotinamide adenine dinucleotide (NAD+), nicotinamide adenine dinucleotide phosphate (NADP) and the ratios of ATP/ADP and ATP/NAD+ after 100 µM atorvastatin and 0.5 µM PCSK9i treatment under normoxia (A), CoCl2-mimicking hypoxia (0.1 mM CoCl2, 24 h) (B) and hypoxia (1% O2 in hypoxic chamber, 24 h) (C) conditions. Values are shown as mean ± SEM; n = 6; *p < 0.05, **p < 0.01, ***p < 0.001, ****p < 0.0001 vs. untreated cells in normoxia.
FIGURE 7
FIGURE 7
Mitochondria function in murine cardiomyocytes (HL-1) after atorvastatin and PCSK9 inhibitor (PCSK9i) treatment in normoxia, hypoxia-mimicking conditions and hypoxia (1% O2). Oxygen consumption rate (OCR) as presented by the Seahorse XFp Extracellular Flux Analyzer after the sequential injection of oligomycin, carbonyl cyanide-p-trifluoromethoxyphenylhydrazone (FCCP) and mix of rotenone and antimycin A, and parameters of mitochondrial function in control (vehicle-pre-treated) cells and cells pre-treated with 100 µM atorvastatin or 0.5 µM PCSK9 inhibitor, after following incubation in normoxia (A), CoCl2-mimicking hypoxia (24 h with 0.1 mM CoCl2) (B) and hypoxia (1% O2 in hypoxic chamber, 24 h) (C) conditions. Values are shown as mean ± SEM; n = 4; *p < 0.05, **p < 0.01, ***p < 0.001.
FIGURE 8
FIGURE 8
Mitochondria abundance and membrane potential in murine cardiomyocytes (HL-1) after atorvastatin and PCSK9 inhibitor (PCSK9i) treatment in normoxia and hypoxia-mimicking conditions. Representative images of Mitotracker-Cy5 fluorescence staining (A) and quantitative analysis of mean fluorescence intensity for Mitotracker-Cy5 in control (vehicle-pre-treated) cells and cells pre-treated with 100 µM atorvastatin or 0.5 µM PCSK9 inhibitor, after following incubation in normoxia and CoCl2-mimicking hypoxia (24 h with 0.1 mM CoCl2) (B) conditions. Representative images for TOM20-AF594 (red), α-actin-Phalloidin488 (green) and nuclei-DAPI (blue) staining analysed using fluorescence microscope (C) and quantitative analysis of MFI for TOM20-AF594 (D) and quantitative analysis of mean fluorescence intensity for α-actin-Phalloidin488 (D). Values are shown as mean ± SEM; n = 6; **p < 0.01, ****p < 0.0001.
FIGURE 9
FIGURE 9
Proliferation rates of murine cardiomyocytes (HL-1) in the presence of atorvastatin and PCSK9 inhibitor (PCSK9i) in normoxia and hypoxia-mimicking conditions. Representative images (A) and quantitative results (B) of the proliferation rates of control (vehicle-pre-treated) cells and cells pre-treated with 100 µM atorvastatin or 0.5 µM PCSK9 inhibitor, after incubation in normoxia and CoCl2-mimicking hypoxia (24 h with 0.1 mM CoCl2) conditions. Values are shown as mean ± SEM; n = 6; *p < 0.05.

Similar articles

Cited by

References

    1. Bates K., Ruggeroli C. E., Goldman S., Gaballa M. A. (2002). Simvastatin restores endothelial NO-mediated vasorelaxation in large arteries after myocardial infarction. Am. J. Physiol. Heart Circ. Physiol. 283, H768–H775. 10.1152/AJPHEART.00826.2001 - DOI - PubMed
    1. Berberich A. J., Hegele R. A. (2022). A modern approach to dyslipidemia. Endocr. Rev. 43, 611–653. 10.1210/ENDREV/BNAB037 - DOI - PMC - PubMed
    1. Bierhansl L., Conradi L. C., Treps L., Dewerchin M., Carmeliet P. (2017). Central role of metabolism in endothelial cell function and vascular disease. Physiol. (Bethesda) 32, 126–140. 10.1152/PHYSIOL.00031.2016 - DOI - PMC - PubMed
    1. Bland A. R., Payne F. M., Ashton J. C., Jamialahmadi T., Sahebkar A. (2022). The cardioprotective actions of statins in targeting mitochondrial dysfunction associated with myocardial ischaemia-reperfusion injury. Pharmacol. Res. 175, 105986. 10.1016/J.PHRS.2021.105986 - DOI - PubMed
    1. Bouitbir J., Charles A. L., Echaniz-Laguna A., Kindo M., Daussin F., Auwerx J., et al. (2012). Opposite effects of statins on mitochondria of cardiac and skeletal muscles: A “mitohormesis” mechanism involving reactive oxygen species and PGC-1. Eur. Heart J. 33, 1397–1407. 10.1093/EURHEARTJ/EHR224 - DOI - PMC - PubMed