[Preprint]. 2023 Sep 15:2023.09.11.557241.
doi: 10.1101/2023.09.11.557241.

Regulation of human interferon signaling by transposon exonization

Affiliations

Regulation of human interferon signaling by transposon exonization

Giulia Irene Maria Pasquesi et al. bioRxiv. .

Update in

  • Regulation of human interferon signaling by transposon exonization.
    Pasquesi GIM, Allen H, Ivancevic A, Barbachano-Guerrero A, Joyner O, Guo K, Simpson DM, Gapin K, Horton I, Nguyen LL, Yang Q, Warren CJ, Florea LD, Bitler BG, Santiago ML, Sawyer SL, Chuong EB. Pasquesi GIM, et al. Cell. 2024 Dec 26;187(26):7621-7636.e19. doi: 10.1016/j.cell.2024.11.016. Epub 2024 Dec 12. Cell. 2024. PMID: 39672162

Abstract

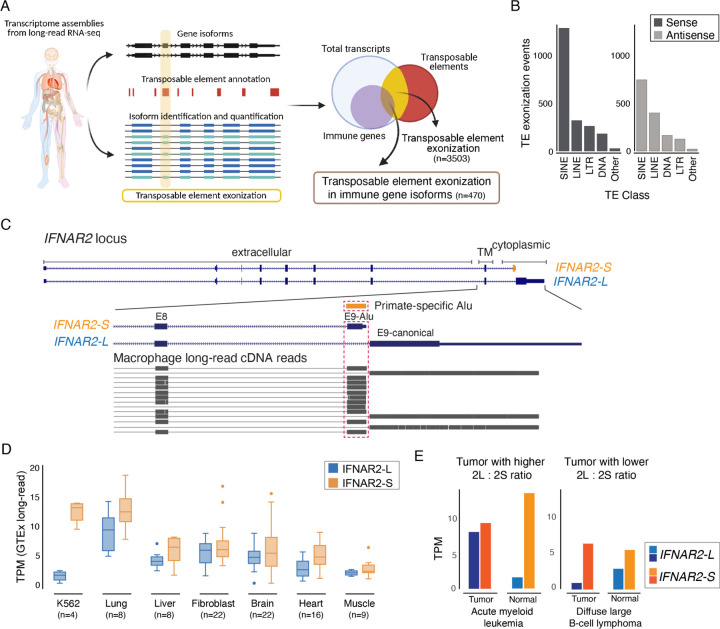
Innate immune signaling is essential for clearing pathogens and damaged cells, and must be tightly regulated to avoid excessive inflammation or autoimmunity. Here, we found that the alternative splicing of exons derived from transposable elements is a key mechanism controlling immune signaling in human cells. By analyzing long-read transcriptome datasets, we identified numerous transposon exonization events predicted to generate functional protein variants of immune genes, including the type I interferon receptor IFNAR2. We demonstrated that the transposon-derived isoform of IFNAR2 is more highly expressed than the canonical isoform in almost all tissues, and functions as a decoy receptor that potently inhibits interferon signaling including in cells infected with SARS-CoV-2. Our findings uncover a primate-specific axis controlling interferon signaling and show how a transposon exonization event can be co-opted for immune regulation.

Keywords: alternative splicing; innate immunity; transposable elements; type I IFN.


Conflict of interest statement

Declaration of Interests: We have a patent application related to this work (PCT Application No. PCT/US2023/066767). Authors declare that they have no further competing interests.

Figures

Fig. 1.
Fig. 1.. Human IFNAR2 is constitutively spliced into two main isoforms.
A) Schematic of the approach to identify candidate exonized transposable elements (TEs) in immune genes from long-read RNA sequencing data. B) Count of TE exonization events for each main TE class based on their orientation compared to that of the protein-coding gene they provide the alternative splice site to (sense= same orientation, to the left; antisense = opposite orientation, to the right). Only TEs that overlapped a protein-coding gene exon for 80% of their length and a splice site for isoforms with TPM > 5 in at least one sample were included. C) Read alignments from long-read cDNA sequencing data of human macrophages over the short IFNAR2 alternative isoform (IFNAR2-S) and the canonical long IFNAR2 isoform (IFNAR2-L). D) Long-read RNA-seq read counts comparing IFNAR2-S (orange) and IFNAR2-L (blue) expression across normal human tissues (GTEx). E) Expression levels of IFNAR2-S and IFNAR2-L in matched healthy (lighter shade) and tumor (darker shade) samples in acute myeloid leukemia and diffuse large B-cell lymphoma (TCGA,). The two tumor types show extreme changes in the relative isoform expression levels compared to matched healthy samples: increase in IFNAR2-L relative expression in leukemia, and decrease in IFNAR2-L relative expression in lymphoma. TM = transmembrane domain. TPM = Transcripts per million.
Fig. 2.
Fig. 2.. IFNAR2-S functions as a decoy receptor for type I IFN signaling.
A) Schematic model of isoform-specific knockouts (KOs) of the IFNAR2 gene (not drawn to scale). IFNAR2-S KO cell lines were generated by deleting the E9-Alu exon (orange); IFNAR2-L KO cell lines were generated by deleting the E9-canonical exon (blue); complete IFNAR2 KO cell lines were generated by deleting exon 7 (E7 KO/IFNAR2 KO). B) Plot shows changes in normalized STAT1 phosphorylation levels as detected by phospho-flow cytometry in wild-type and knockout HeLa cell lines upon 30min treatment with increasing doses of IFNβ. Data shown are mean fluorescence intensity (MFI) normalized against untreated cells of the same genotype. C-D) STAT2 and phosphorylated STAT2 (pSTAT2) signal from wild-type and knockout A549 cell line. On the left, C: violin plots show the ratio of nuclear to cytoplasmic STAT2 signal in cells treated with 1000U/ml of IFNβ normalized to untreated cells (wild-type n=663, IFNAR2-L KO n=377, IFNAR2-S n=574); D: histograms show total pSTAT2 signal in untreated cells and cells treated with 10U/ml and 1000U/ml of IFNβ. On the right, immunofluorescence pictures of STAT2 and pSTAT2 from which fluorescence signals were quantified. Pink = (p)STAT2 signal. Scale bar= 50mm. E) RT-qPCR measurements of OASL and ISG15 fold-change induction comparing untreated to 4hrs 10U/ml IFNβ treatment in HeLa wild-type and KO cell lines. For each genotype, 3 biological replicates (different KO clonal cell lines) were tested and assayed in triplicate. F) RNA-Seq MA-plot showing differences in 4hrs 10U/ml IFNβ treatment comparing wild-type and IFNAR2-S KO HeLa cells. Significantly differentially induced genes with annotated immune or inflammatory functions (GO:0006955 and GO:0006954) are labeled. G) Heatmap of the top 30 most significantly upregulated genes (based on adjusted p-value) by IFNβ in IFNAR2-S KO cells. Displayed are the log2fold change values from treated vs untreated pairwise comparisons for each HeLa cell line. H) RT-qPCR measurements of OASL and ISG15 fold-change induction comparing untreated to 4hrs 10U/ml IFNβ treatment in wild-type or IFNAR2-S KO cells overexpressing empty vector or IFNAR2-S. I) RT-qPCR measurements of OASL and ISG15 fold-change induction in response to a 4hrs 10U/ml IFNβ treatment in wild-type HeLa cells transfected with negative control, anti-IFNAR2-L, or anti-IFNAR2-S siRNAs. Asterisks (*) indicate a significant difference in the effect of treatment (p-value < 0.05) between conditions as calculated through an ANOVA emmean pairwise contrast statistical test.
Fig. 3.
Fig. 3.. IFNAR2-S acts as a decoy receptor for the type I IFN signaling.
A) Western blot of IFNβ in lysates of wild-type and knockout HeLa cells either untreated or treated with 1000U/ml IFNβ for 30min shows that both IFNAR2 isoform can bind IFNβ. B) Western blots of STAT2, IFNAR1 and β-actin in total lysates and pull-down fractions of IFNAR2 KO HeLa cells overexpressing either the IFNAR2-S or the IFNAR2-L isoform tagged with a C-terminus HaloTag. The HaloTag was used to perform isoform-specific pull-downs to identify interactors of IFNAR2-L and IFNAR2-S independently in untreated cells and cells treated with IFNα for 10min or IFNβ for 5min. Target proteins were detected in total cell lysates (pre-pull-down fraction) in all treatment conditions. STAT2 was detected only in IFNAR2-L HaloTag pull-downs, and IFNAR1 in cells treated with IFNβ. Signal was barely detectable in cells treated with IFNα, consistent with the lower affinity of IFNα to IFNAR2. β-actin was not identified in the pull-down fractions. C) Immunofluorescent labeling of IFNAR2-L-HaloTag and IFNAR2-S-HaloTag in untreated conditions (cnt, on the left) and after 30min of IFNβ treatment (100U/ml). Compared to the diffused signal of cells expressing an empty HaloTag vector, both cell lines expressing IFNAR2-L-HaloTag and IFNAR2-S-HaloTag show clear punctuated signal in the cytoplasm and at the cell membrane. Magnification = 40x; Green = wga; membrane staining; Blue = DAPI, nucleus; Red = permeable JFX549 HaloTag ligand. D) Brightfield images of HeLa cells at 4x magnification either untreated or treated with 10U/ml IFNβ for 4 days (left) and matched normalized cell viability measured by crystal violet staining for the same cells. Scale bar = 1000μm. E) Normalized cell viability measured by crystal violet staining of wild-type cells transfected with 5μM negative control, anti-IFNAR2-L, and anti-IFNAR2-S siRNAs and treated with 10U/ml IFNβ for 4 days. F) Normalized cell viability measured by crystal violet staining of wild-type cells transfected with increasing concentration of scrambled, anti-IFNAR2-L, and anti-IFNAR2-S siRNAs and treated with 10U/ml IFNβ for 4 days. G) Dose-response curves of normalized cell viability measured by CellTiter-Glo in response to treatment with increasing doses of IFNβ (0 to 100U/ml). H) Cell viability measured by crystal violet staining of wild-type and KO cells treated with 100U/ml of IFNα, IFNβ and IFNγ for 7 days. All treatments were performed in triplicate and depicted as mean and standard error and normalized to untreated controls. Asterisks (*) indicate a significant difference in the effect of treatment (p-value < 0.05) between conditions as calculated through an ANOVA emmean pairwise contrast statistical test.
Fig. 4.
Fig. 4.. The IFNAR2-L : IFNAR2-S ratio affects cellular responses to viral infection.
A) Box plots show dynamic modulation of IFNAR2 isoform expression levels (TPM) in human cell lines infected with different viruses. SARS-CoV-2 data from (42) and Influenza B data from (43). B) Variants associated with severe COVID-19 located in and near exon E9-Alu as identified in GWAS studies by the COVID-19 Host Genetic Initiative. C) Bar plot shows the protective effect of IFNβ in the context of SARS-CoV-2 (B.1.617.2) viral infection in wild-type and knockout A549-ACE2 cells. Each bar represents the ratio of viral genome copies in the media of cells that were not pre-treated with IFNβ over viral genome copies in the media of cells that were pre-treated with increasing doses of IFNβ. SARS-CoV-2 copy number was measured by RT-qPCR. D) Based on three independent SARS-CoV-2 infection experiments, the IFNβ IC50 was calculated for wild-type and IFNAR2-S KO A549-ACE2 cells. Bars show the average and distribution of IC50 values for the two genotypes. E) Histogram shows the protective effect of IFNβ in the context of dengue virus 2 (DENV-2) viral infection in wild-type and knockout HeLa cells. Protective effect was calculated as the ratio of viral genome load detectable in lysates by RT-qPCR of unstimulated cells over the viral genome load in lysates of cells that were pre-stimulated with 100U/ml of IFNβ. Asterisks (*) indicate a significant difference in the effect of treatment (p-value < 0.05) between conditions as calculated through an ANOVA emmean pairwise contrast statistical test
Fig. 5.
Fig. 5.. Evolution of the IFNAR2-S isoform and signaling.
A) Primate phylogeny illustrates the evolution of IFNAR2-S at the time of evolution of simian primates ~70–60 mya. B) Schematic reconstruction of IFNAR2-S evolution through the conversion of a syntenic ancestral FAM SINE by a simian primate-specific Alu-Jr Alu. Mutations in the Alu-Jr then allowed for its exonization and the evolution of IFNAR2-S. C) Sequence conservation of IFNAR2-S at the nucleotide (nucleotide diversity on top) and amino acid levels (alignment at the bottom). A dot represents a conserved amino acid. D) IFNAR2 exon coverage from NCBI aggregate RNA-seq data for three different simian primates. E) Model of IFNAR2 signaling in primates, where the type I IFN pathway is modulated by the presence of the decoy receptor IFNAR2-S, which binds IFN molecules but cannot initiate a signaling response. F). Cellular immune homeostasis can be tuned by the IFNAR2-L : IFNAR2-S ratio.

References

    1. Hanada T., and Yoshimura A. (2002). Regulation of cytokine signaling and inflammation. Cytokine Growth Factor Rev. 13, 413–421. 10.1016/s1359-6101(02)00026-6. - DOI - PubMed
    1. Bengtsson A.A., and Rönnblom L. (2017). Role of interferons in SLE. Best Pract. Res. Clin. Rheumatol. 31, 415–428. 10.1016/j.berh.2017.10.003. - DOI - PubMed
    1. Rönnblom L., and Eloranta M.-L. (2013). The interferon signature in autoimmune diseases. Curr. Opin. Rheumatol. 25, 248–253. 10.1097/BOR.0b013e32835c7e32. - DOI - PubMed
    1. Brito-Zerón P., Baldini C., Bootsma H., Bowman S.J., Jonsson R., Mariette X., Sivils K., Theander E., Tzioufas A., and Ramos-Casals M. (2016). Sjögren syndrome. Nat Rev Dis Primers 2, 16047. 10.1038/nrdp.2016.47. - DOI - PubMed
    1. Roelofs M.F., Wenink M.H., Brentano F., Abdollahi-Roodsaz S., Oppers-Walgreen B., Barrera P., van Riel P.L.C.M., Joosten L.A.B., Kyburz D., van den Berg W.B., et al. (2009). Type I interferons might form the link between Toll-like receptor (TLR) 3/7 and TLR4-mediated synovial inflammation in rheumatoid arthritis (RA). Ann. Rheum. Dis. 68, 1486–1493. 10.1136/ard.2007.086421. - DOI - PubMed

Publication types