[Preprint]. 2023 Sep 13:2023.09.13.557508.
doi: 10.1101/2023.09.13.557508.

Competition and Synergy of Arp2/3 and Formins in Nucleating Actin Waves

Affiliations

Competition and Synergy of Arp2/3 and Formins in Nucleating Actin Waves

Xiang Le Chua et al. bioRxiv. .

Update in

Abstract

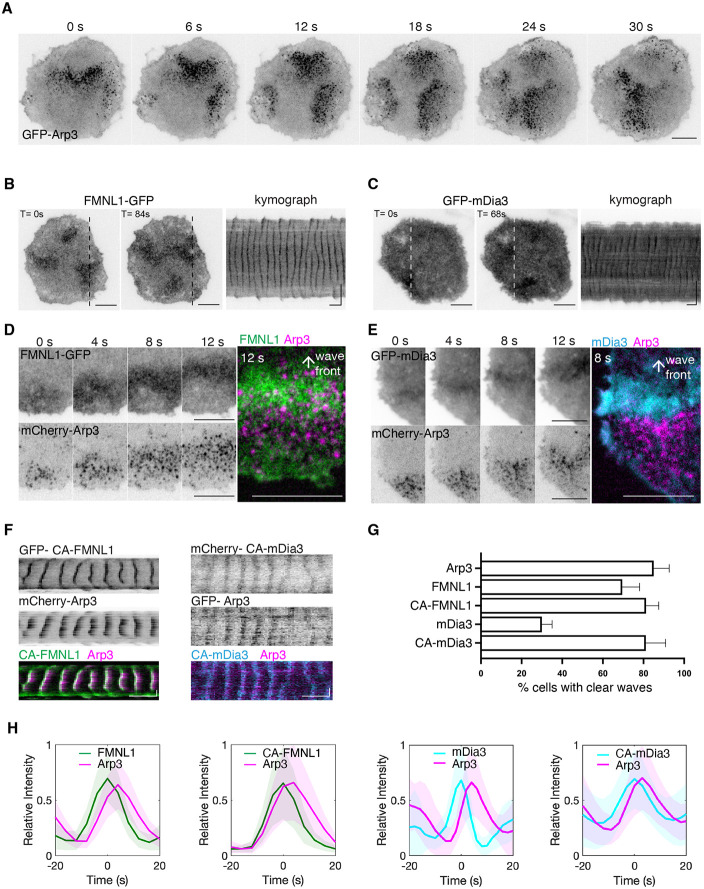
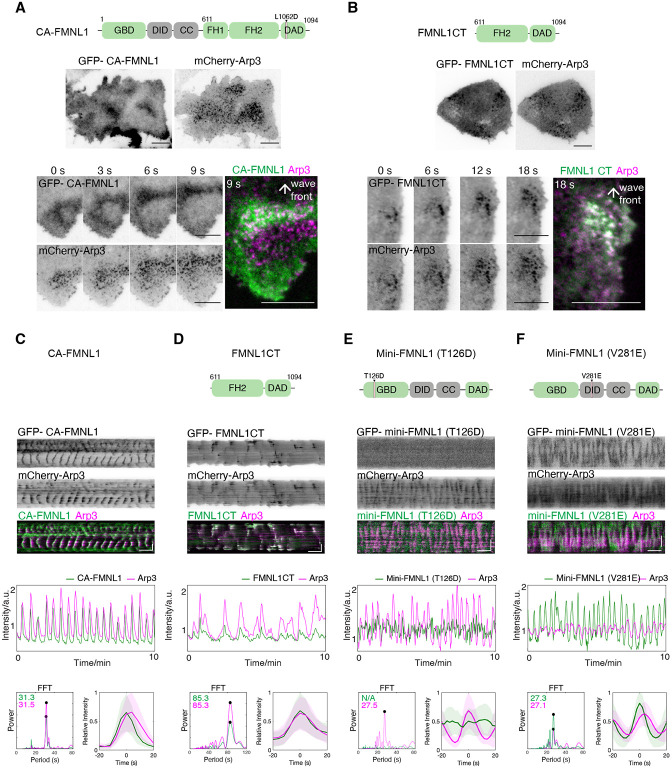
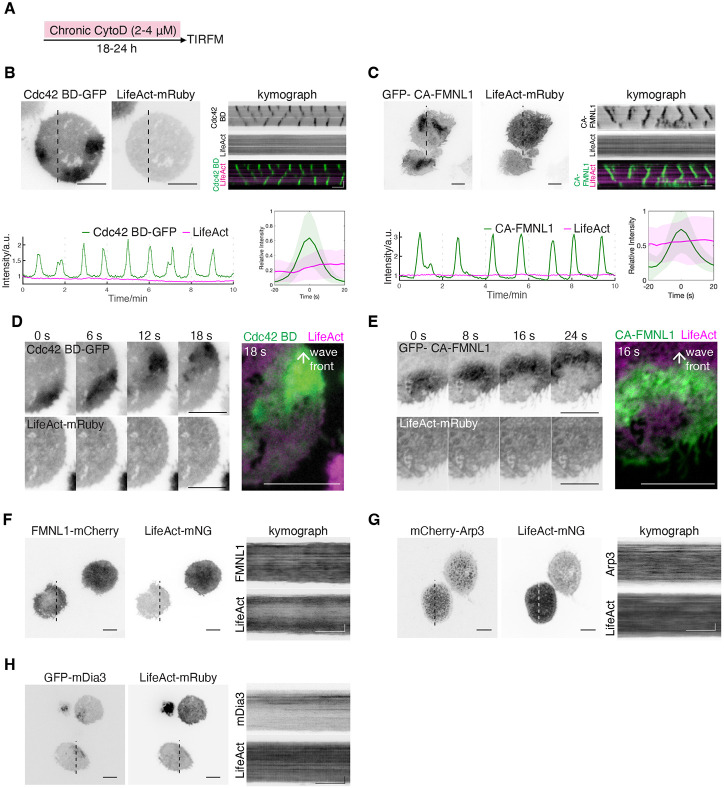
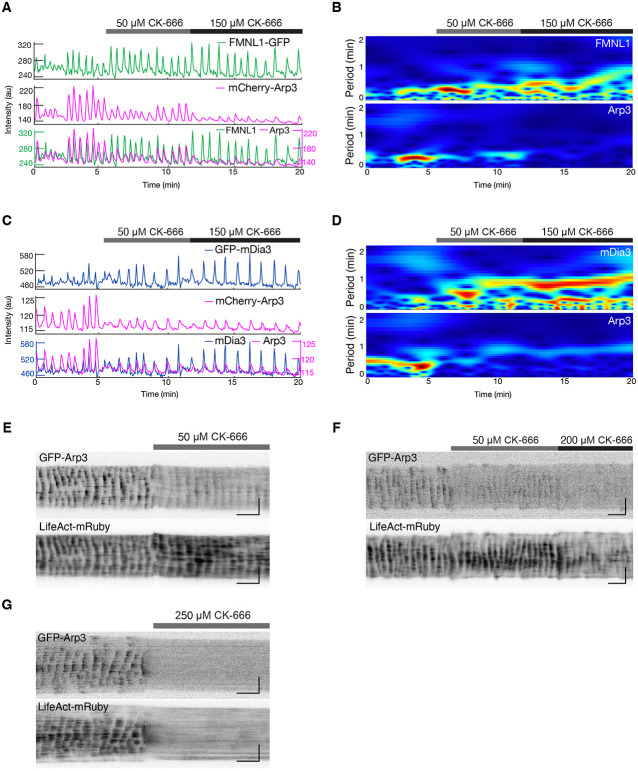
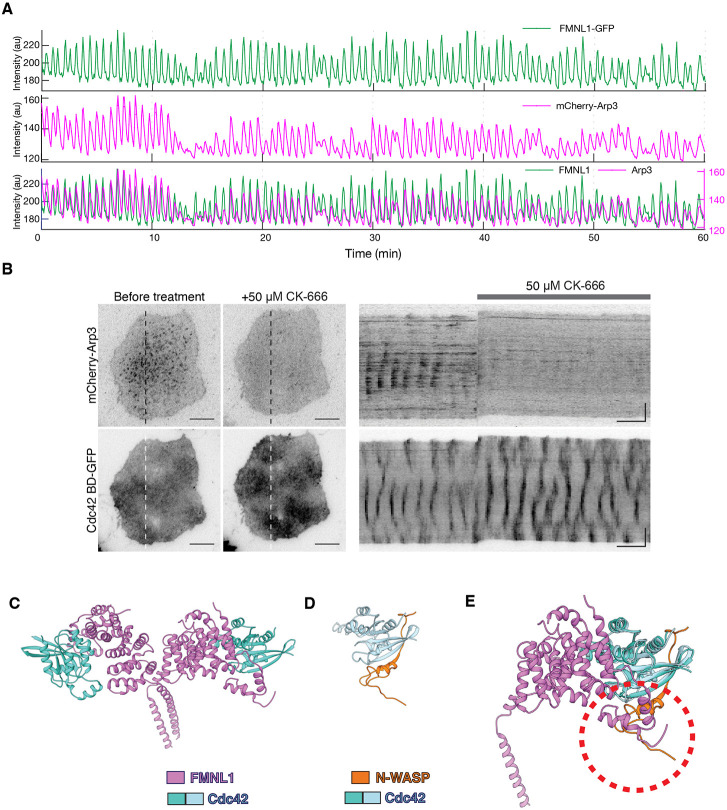
The assembly and disassembly of actin filaments and their regulatory proteins are crucial for maintaining cell structure or changing physiological state. However, because of the tremendous global impact of actin on diverse cellular processes, dissecting the specific role of actin regulatory proteins remains challenging. In this study, we employ actin waves that propagate on the cortex of mast cell to investigate the interplay between formins and the Arp2/3 complex in the nucleating and turnover of cortical actin. Our findings reveal that the recruitment of FMNL1 and mDia3 precedes the Arp2/3 complex in cortical actin waves. Membrane and GTPase-interaction can drive oscillations of FMNL1 in an actin-dependent manner, but active Cdc42 waves or constitutively-active FMNL1 mutant can form without actin waves. In addition to the apparent coordinated assembly of formins and Arp2/3, we further reveal their antagonism, where inhibition of Arp2/3 complex by CK-666 led to a transient increase in the recruitment of formins and actin polymerization. Our analysis suggest that the antagonism could not be explained for the competition between FMNL1 and Arp2/3 for monomeric actin. Rather, it is regulated by a limited pool of their common upstream regulator, Cdc42, whose level is negatively regulated by Arp2/3. Collectively, our study highlights the multifaceted interactions, cooperative or competitive, between formins and Arp2/3 complex, in the intricate and dynamic control of actin cytoskeletal network.


Figures

Figure 1.
Figure 1.. Localization of Arp3, FMNL1 and mDia3 in cortical traveling waves.
(A) Representative TIRFM time-lapse montage of six frames (6s interval) of a cell expressing GFP-Arp3. (B-C) Representative micrographs and kymographs of a cell expressing (B) FMNL1-GFP and (C) GFP-mDia3. (D-E) Sequential montage of four frames (4s interval) of a region of a representative cell co-expressing (D) FMNL1-GFP and mCherry-Arp3, (E) GFP-mDia3 and mCherry-Arp3, followed by a two-color merge micrograph showing the wave front of (D) FMNL1-GFP (green) and mCherry-Arp3 (magenta) and (E) GFP-mDia3 (cyan) and mCherry-Arp3 (magenta). (F) Representative kymographs of a cell co-expressing GFP-CA-FMNL1 (green) and mCherry-Arp3 (magenta), mCherry- CA-mDia3 (cyan) and GFP-Arp3. (G) Quantification for the percentage of cells exhibiting clear waves of different formin constructs from unbiased selection exp (> 11 cells from 2-3 independent experiments; n= 85 % of cells exhibiting clear waves of either GFP-Arp3 or mCherry-Arp3 in 3 exp; n= 69.5 % of cells exhibiting clear waves of FMNL1-GFP or FMNL1-mCherry in 3 exp; n= 81.3 % of cells exhibiting clear waves of GFP-CA-FMNL1 in 2 exp; n= 30 % of cells exhibiting clear waves of GFP-mDia3 or mCherry-mDia3 in 3 exp; n= 81.2 % cells exhibiting clear waves of mCherry-CA-mDia3 in 2 exp). (H) Fluorescence intensity profiles of GFP- or mCherry-Arp3 (magenta) aligned with respect to FMNL1-GFP (green), GFP-CA-FMNL1 (green), GFP-mDia3 (cyan), mCherry- CA-mDia3. All greyscale micrographs and kymographs are shown in inverted lookup table. Horizontal scale bars in micrographs: 10 μm. Vertical scale bars in kymographs: 10 μm. Horizontal scale bars in kymographs: 1 min.
Figure 2.
Figure 2.. GTPase-binding domain and relieved auto-inhibition are necessary for FMNL1 assembly in waves.
(A-B) Domain schematics of CA- and C-termini- mutants of FMNL1 used in our study. Representative micrographs and sequential montage of four frames (3-6s interval) of a region of a cell co-expressing mCherry-Arp3 (magenta) and (A) GFP- CA-FMNL1 (green) or (B) GFP- FMNL1CT (green). (C) Representative kymographs, intensity plot and FFT profile of a cell co-expressing GFP- CA-FMNL1 (green) and mCherry-Arp3 (magenta). (D-F) Domain schematics of truncated and point mutants of FMNL1 used in our study. Representative kymographs, intensity and FFT profiles of a cell co-expressing mCherry-Arp3 (magenta) and the (D) C-termini-, (E) mini-FMNL1 truncated of FH1-FH2 with T126D mutation at GBD motif-, or (F) mini-FMNL1 truncated of FH1-FH2 with V281E mutation at DID motif- mutant of FMNL1. FMNL1 mutants are false-colored green. Representative intensity profiles of mCherry-Arp3 (magenta) aligned with respect to FMNL1 mutants (green). All greyscale micrographs and kymographs are shown in inverted lookup table.
Figure 3.
Figure 3.. Cortical waves of active Cdc42 and constitutively-active FMNL1 persist in actin-depleted state.
(A) Treatment schematic for the chronic depletion of F-actin with cytochalasin-D. (B) Representative micrographs and kymographs of a chronically pre-treated cell stably-expressing Cdc42 BD-GFP (green) co-transfected with LifeAct-mRuby (magenta). Representative intensity plot and profile of Cdc42 BD-GFP (green) and LifeAct-mRuby (magenta). (C) Representative greyscale micrographs and kymographs of a chronically-treated cell co-expressing GFP- CA-FMNL1 (green) and LifeAct-mRuby (magenta). Representative intensity plot and profile of GFP- CA-FMNL1 (green) and LifeAct-mRuby (magenta). (D-F) Representative micrographs and kymographs of chronically pre-treated cells co-expressing LifeAct-mRuby or LifeAct-mNG and (D) FMNL1-mCherry, (E) mCherry-Arp3, or (F) GFP-mDia3 (n= 0/3 cells exhibiting waves of FMNL1-GFP and LifeAct-mRuby in 2 exp; n= 0/18 cells exhibiting waves of mCherry-Arp3 and LifeAct-mNG in 2 exp; n= 0/13 cells exhibiting waves of GFP-mDia3 and LifeAct-mRuby in 2 exp). All greyscale micrographs and kymographs are shown in inverted lookup table. Horizontal scale bars in micrographs: 10 μm. Vertical scale bars in kymographs: 10 μm. Horizontal scale bars in kymographs: 1 min.
Figure 4.
Figure 4.. Enhanced formin-mediated actin polymerization in response to Arp2/3 inhibition
(A-B) Representative (A) intensity plots and (B) wavelet analyses of a cell co-expressing FMNL1-GFP (green) and mCherry-Arp3 (magenta) before and after treated with 50 μM, followed by 150 μM CK-666. (C-D) Representative (C) intensity plots and (D) wavelet analyses of a cell co-expressing GFP-mDia3 (blue) and mCherry-Arp3 (magenta) before and after treated with 50 μM, followed by 150 μM CK-666. (E) Representative kymographs of a cell co-expressing GFP-Arp3 and mCherry-Arp3 before and getting treated by 50 μM CK-666. (F) Representative kymographs of a cell co-expressing GFP-Arp3 and mCherry-Arp3 before and getting treated by 50 μM, followed by 200 μM CK-666. (G) Representative kymographs of a cell co-expressing GFP-Arp3 and mCherry-Arp3 before and getting treated by 250 μM CK-666. Horizontal scale bars in micrographs: 10 μm. Vertical scale bars in kymographs: 10 μm. Horizontal scale bars in kymographs: 1 min.
Figure 5.
Figure 5.. FMNL1 and Arp2/3 complex compete for upstream Cdc42 GTPase.
(A) Representative intensity profile of a cell co-expressing FMNL1-GFP (green) and mCherry-Arp3 (magenta) over an acquisition period of 1 h (n= 14 cells co-expressing clear waves of FMNL1-GFP and mCherry-Arp3 acquired between 20 – 60 min in 8 exp). (B) Representative micrographs and kymographs of a cell stably-expressing Cdc42 BD-GFP co-transfected with mCherry-Arp3 before, and after treatment with 50 μM CK-666. (C) Left: Structure of the dimeric Cdc42/FMNL1 complex (pdb: 4ydh). (D) Structure of the Cdc42/N-WASP complex (pdb: 1cee) (E) Structure of the Cdc42/N-WASP complex aligned with the structure of monomeric Cdc42/FMNL1 complex on the basis of Cdc2 using Chimera. Models of Cdc42 are shown in light blue and turquoise, model of the GTPase binding domain of N-WASP is shown in orange, and the model of the N-terminal domain of FMNL1 is shown in purple. Red dashed circle shows the region where FMNL1 and N-WASP will clash.

Similar articles

References

    1. Abdul-Manan N, Aghazadeh B, Liu GA, Majumdar A, Ouerfelli O, Siminovitch KA, Rosen MK. 1999. Structure of Cdc42 in complex with the GTPase-binding domain of the “Wiskott–Aldrich syndrome” protein. Nature 399:379–383. - PubMed
    1. Bement WM, Leda M, Moe AM, Kita AM, Larson ME, Golding AE, Pfeuti C, Su KC, Miller AL, Goryachev AB, Von Dassow G. 2015. Activator-inhibitor coupling between Rho signalling and actin assembly makes the cell cortex an excitable medium. Nat Cell Biol 17:1471–1483. - PMC - PubMed
    1. Bershadsky A. 2004. Magic touch: how does cell-cell adhesion trigger actin assembly? Trends Cell Biol 14:1–5. - PubMed
    1. Bieling P, Li T De, Weichsel J, McGorty R, Jreij P, Huang B, Fletcher DA, Mullins RD. 2016. Force Feedback Controls Motor Activity and Mechanical Properties of Self-Assembling Branched Actin Networks. Cell 164:115–127. - PMC - PubMed
    1. Bolado-Carrancio A, Rukhlenko OS, Nikonova E, Tsyganov MA, Wheeler A, Garcia-Munoz A, Kolch W, Kriegsheim A von, Kholodenko BN. 2020. Periodic propagating waves coordinate rhogtpase network dynamics at the leading and trailing edges during cell migration. Elife 9:1–34. - PMC - PubMed

Publication types