[Preprint]. 2023 Sep 14:2023.09.12.557273.
doi: 10.1101/2023.09.12.557273.

Reviving immunogenic cell death upon targeting TACC3 enhances T-DM1 response in HER2-positive breast cancer

Affiliations

Reviving immunogenic cell death upon targeting TACC3 enhances T-DM1 response in HER2-positive breast cancer

Mustafa Emre Gedik et al. bioRxiv. .

Update in

Abstract

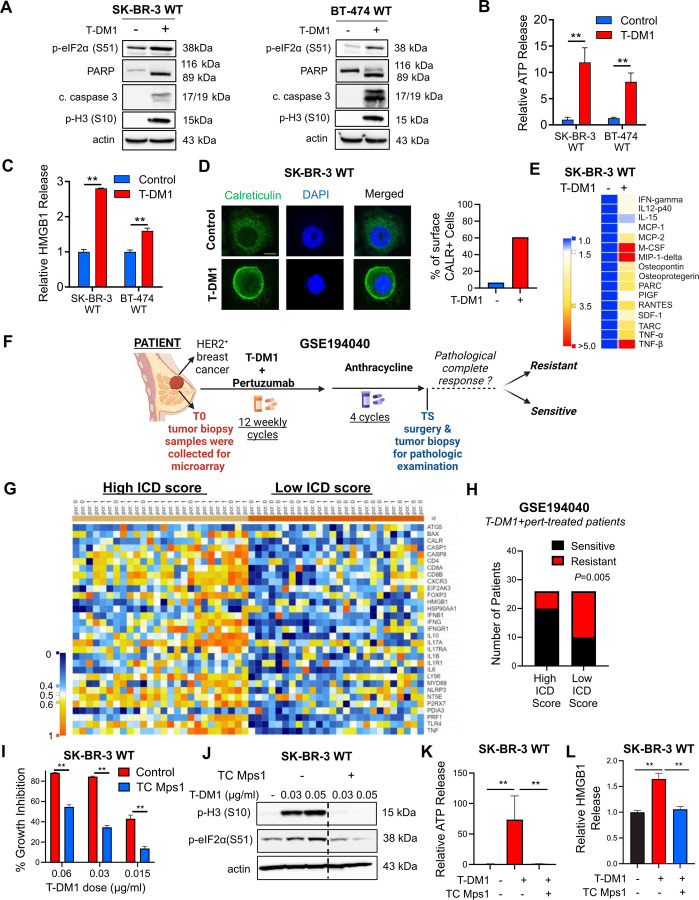
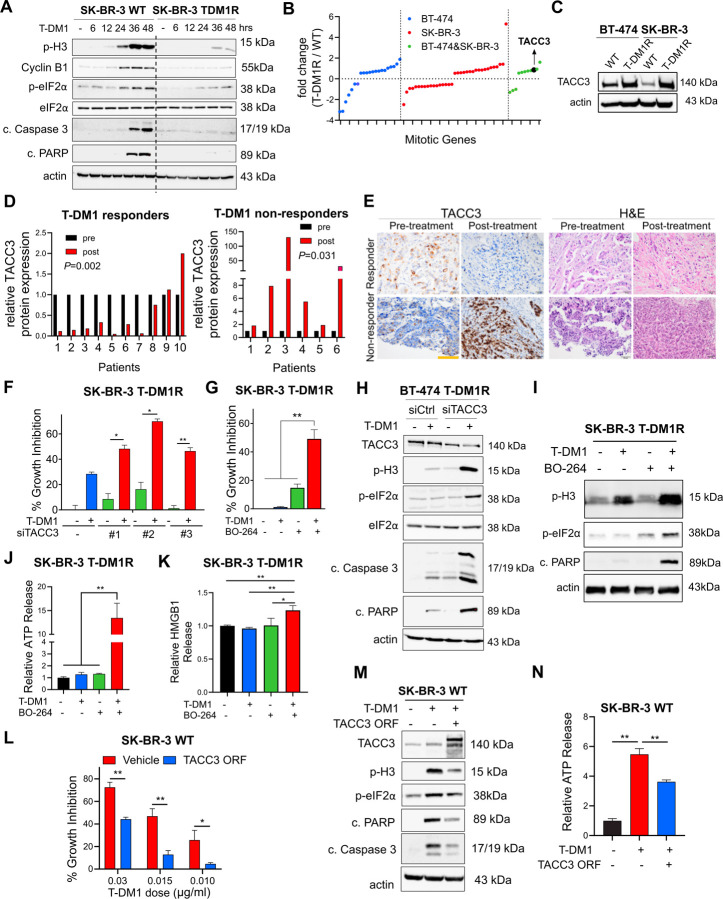
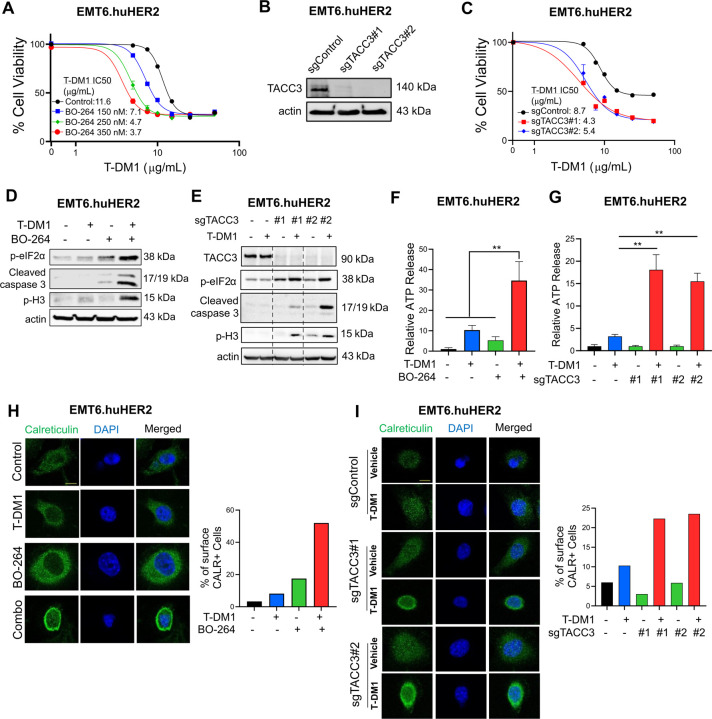
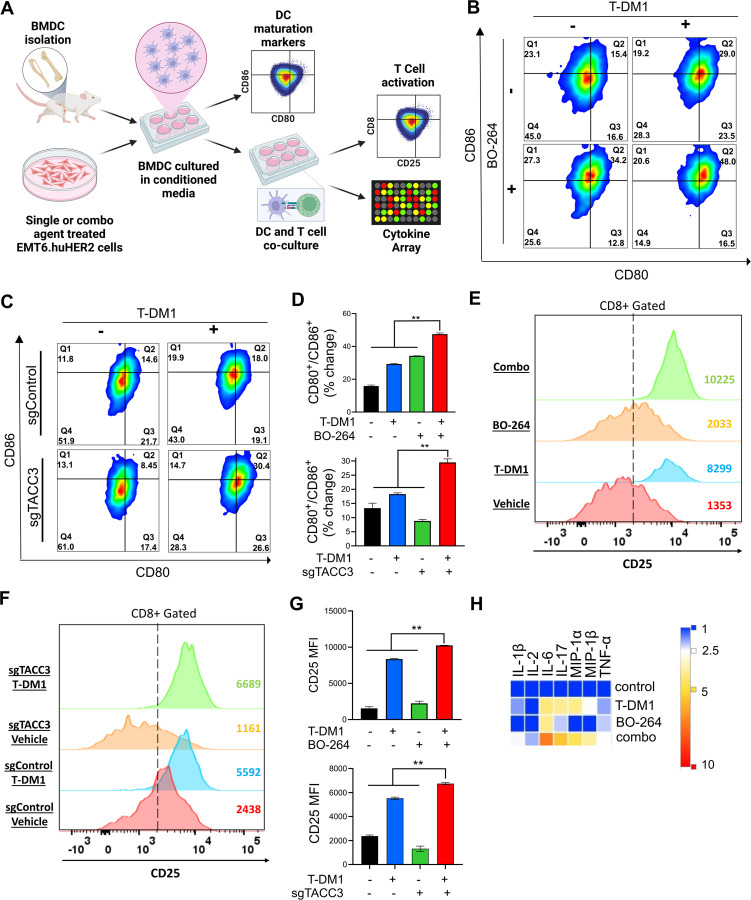
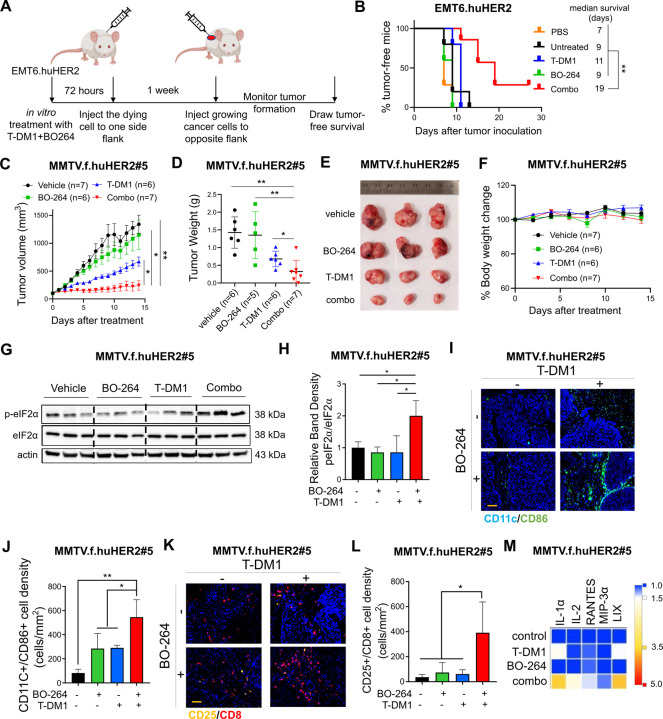
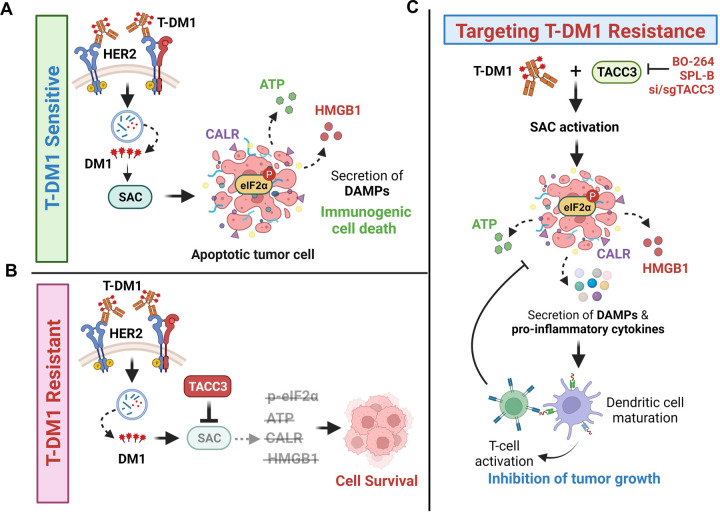
Immunogenic cell death (ICD), an immune-priming form of cell death, has been shown to be induced by several different anti-cancer therapies. Despite being the first and one of the most successful antibody-drug conjugates (ADCs) approved for refractory HER2-positive breast cancer, little is known if response and resistance to trastuzumab emtansine (T-DM1) involves ICD modulation that can be leveraged to enhance T-DM1 response. Here, we report that T-DM1 induces spindle assembly checkpoint (SAC)-dependent ICD in sensitive cells by inducing eIF2α phosphorylation, surface exposure of calreticulin, ATP and HMGB1 release, and secretion of ICD-related cytokines, all of which are lost in resistance. Accordingly, an ICD-related gene signature correlates with clinical response to T-DM1-containing therapy. We found that transforming acidic coiled-coil containing 3 (TACC3) is overexpressed in T-DM1 resistant cells, and that T-DM1 responsive patients have reduced TACC3 protein while the non-responders exhibited increased TACC3 expression during T-DM1 treatment. Notably, genetic or pharmacological inhibition of TACC3 revives T-DM1-induced SAC activation and induction of ICD markers in vitro. Finally, TACC3 inhibition elicits ICD in vivo shown by vaccination assay, and it potentiates T-DM1 by inducing dendritic cell (DC) maturation and enhancing infiltration of cytotoxic T cells in the human HER2-overexpressing MMTV.f.huHER2#5 (Fo5) transgenic model. Together, our results show that ICD is a key mechanism of action of T-DM1 which is lost in resistance, and that targeting TACC3 restores T-DM1-mediated ICD and overcomes resistance.

Keywords: Immunologic cell death; T-DM1; TACC3; antibody drug conjugate; breast cancer; drug resistance; mitotic arrest.


Conflict of interest statement

Declaration of Interest O. Sahin, B.C. and E.B. are the co-founders of OncoCube Therapeutics LLC. O. Sahin is the president of LoxiGen, Inc. The other authors declare no potential conflicts of interest.

Figures

Figure 1.
Figure 1.. T-DM1 induces ICD markers in T-DM1 sensitive breast cancer cells in a mitotic arrest-dependent manner and ICD correlates with T-DM1 sensitivity in patients.
A Western blot analysis of mitotic arrest, apoptosis and ICD markers in T-DM1-treated SK-BR-3 WT (left) and BT-474 WT (right) cells. B, C Relative ATP release (B) and HMGB1 release (C) from T-DM1-treated SK-BR-3 WT and BT-474 WT cells (n=3, 4). D IF cell surface staining of calreticulin (green) in T-DM1 treated SK-BR-3 WT cells. Scale bar=10 µm. DAPI was used to stain the nucleus. Its quantification is provided on the right. E Cytokine array blot analysis showing the differentially secreted cytokines in T-DM1-treated SK-BR-3 WT cells. F. Schematic summary of the treatment scheme and the sample collection timeline in GSE194040. This figure was drawn using Biorender.com. G. Heatmap of ICD-related genes found in the ICD gene signature score and their correlation with pCR in T-DM1+pertuzumab-treated patients from GSE194040. pCR: 1, sensitive; pCR: 0, resistant. H. Chi-square analysis of sensitive vs. resistant tumors expressing low vs. high ICD score from G. I Percent growth inhibition in SK-BR-3 WT cells treated with T-DM1 alone or in combination with 1 µM TC Mps1 (Mps1 inhibitor) (n=4). J Western blot analysis of p-H3 and p-eIF2α in SK-BR-3 WT cells treated with T-DM1 alone or in combination with 1 µM TC Mps1. Actin is used as a loading control. K, L Relative ATP (K) and HMGB1 (L) release in SK-BR-3 WT cells treated with T-DM1 alone or in combination with 1 µM TC Mps1 (n=3). Data correspond to mean values ± standard deviation (SD). P-values for the bar graphs were calculated with the unpaired, two-tailed Student’s t test. Significance for the Chi-square analysis was calculated with Chi-square testing. **, P<0.01.
Figure 2.
Figure 2.. ICD-related factors are lost in T-DM1 resistance upon TACC3 overexpression, TACC3 correlates with clinical T-DM1 resistance, and its inhibition overcomes T-DM1 resistance and restores ICD markers in vitro.
A Western blot analysis of mitotic arrest, apoptosis, and ICD markers in SK-BR-3 WT and T-DM1 resistant (T-DM1R) cells treated with 0.05 µg/mL T-DM1 in a time-dependent manner. B The log fold change of the mitotic genes differentially expressed only in BT-474, SK-BR-3 or both T-DM1R cells compared to WT counterparts in RNA-seq analysis. C Western blot analysis of TACC3 protein expression in BT-474 and SK-BR-3 WT vs. T-DM1R cells. Actin is used as a loading control. D Bar graphs showing relative protein expression of TACC3 in the T-DM1-treated tumors of responder vs. non-responder patients before and after treatment (n=6–10). E Representative TACC3 IHC and H&E staining in the tumor tissues of patients from D. Scale bar=100 µm. F Percent growth inhibition in SK-BR-3 T-DM1R cells transfected with siTACC3 and treated with 0.03 µM T-DM1 (n=4–6). G Percent growth inhibition in SK-BR-3 T-DM1R cells treated with T-DM1 alone or in combination with 1 µM TACC3 inhibitor (BO-264) (n=4–6). H Western blot analysis of mitotic arrest, apoptosis, and ICD markers in BT-474 T-DM1R cells transfected with siTACC3 and treated with T-DM1. Actin is used as a loading control. I Western blot analysis of mitotic arrest, apoptosis, and ICD markers in SK-BR-3 T-DM1R cells treated with T-DM1 alone or in combination with BO-264. Actin is used as a loading control. J Relative ATP release from SK-BR-3 T-DM1R cells treated with T-DM1 alone or in combination with BO-264 (n=3, 4). K Relative HMGB1 release from SK-BR-3 T-DM1R cells treated with T-DM1 alone or in combination with BO-264 (n=3). L Percent growth inhibition in SK-BR-3 WT cells overexpressing TACC3 and treated with T-DM1 (n=3). M Western blot analysis of mitotic arrest, apoptosis and ICD markers in SK-BR-3 WT cells overexpressing TACC3 and treated with T-DM1. Actin is used as a loading control. N Relative ATP release from SK-BR-3 WT cells overexpressing TACC3 and treated with T-DM1 (n=3). Data correspond to mean values ± standard deviation (SD). Significance for D was calculated with one way Wilcoxon signed-rank test. P-values for other subfigures were calculated with the unpaired, two-tailed Student’s t test. *, P<0.05; **, P<0.01.
Figure 3.
Figure 3.. Targeting TACC3 sensitizes the human HER2-expressing EMT6.huHER2 cells to T-DM1 and induces ICD markers.
A Cell viability assay in EMT6.huHER2 cells treated with increasing doses of T-DM1 alone or combination with different dose of BO-264 for 3 days (n=4). B Validation of TACC3 knockout in EMT6.huHER2 cells obtained using CRISPR/Cas9 system. C Cell viability assay in EMT6.huHER2.sgTACC3 vs. sgControl cells treated with increasing doses of T-DM1 for 3 days (n=4). D Western blot analysis of mitotic arrest, apoptosis and ICD markers in EMT6.huHER2 cells treated with T-DM1 alone or in combination with BO-264. Actin is used as a loading control. E. Western blot analysis of TACC3, mitotic arrest, apoptosis, and ICD markers in EMT6.huHER2.sgTACC3 vs. sgControl cells treated with T-DM1. Actin is used as a loading control. F Relative ATP release from EMT6.huHER2 cells treated with T-DM1 alone or in combination with BO-264 (n=3). G Relative ATP release from EMT6.huHER2.sgTACC3 vs. sgControl cells treated with T-DM1 (n=3, 4). H IF cell surface staining of calreticulin (green) in EMT6.huHER2 cells treated with T-DM1 alone or in combination with BO-264. Its quantification is provided on the right. I IF cell surface staining of calreticulin (green) in EMT6.huHER2.sgTACC3 vs. sgControl cells treated with T-DM1. Its quantification is provided on the right. Data correspond to mean values ± standard deviation (SD). P-values were calculated with the unpaired, two-tailed Student’s t test. **, P<0.01.
Figure 4.
Figure 4.. Inhibition of TACC3 in combination with T-DM1 leads to ex vivo DC maturation, T cell activation, and release of ICD related pro-inflammatory cytokines.
A Schematic representation of the experimental workflow for DC maturation, T cell activation and cytokine profiling experiments, drawn using Biorender.com. B, C Flow cytometry analysis of DC maturation markers in DC cells incubated with the conditioned media collected from EMT6.huHER2 cells treated with 7.5 µg/ml T-DM1 and 500 nM BO-264, alone or in combination (B) or in EMT6.huHER2.sgControl vs. sgTACC3 cells treated with 7.5 µg/ml T-DM1 (C). D Quantification of CD80+/CD86+ cells from B and C (n=2). E, F Flow cytometry analysis of T cell activation marker, CD25 in CD8+ T cells co-cultured with DCs from B and C. G Quantification of the CD25 mean fluorescence intensity (MFI) from E and F (n=2). H Levels of pro-inflammatory cytokines in the media collected from DC-T cell co-cultures from E, F. Data correspond to mean values ± standard deviation (SD). P-values were calculated with the unpaired, two-tailed Student’s t test. **, P<0.01.
Figure 5.
Figure 5.. TACC3 inhibition elicits ICD in vivo and potentiates TDM1 response via increasing the infiltration of anti-tumor immune cells in vivo.
A Schematic representation of the in vivo vaccination assay drawn using Biorender.com. B Tumor-free survival curves of BALB/c mice vaccinated with PBS or single agent or combination treated EMT6.huHER2 cells (n=5–7). C Tumor growth of the MMTV.f.huHER2#5 model under low dose T-DM1 (5 mg/kg, once) in combination with BO-264 (50 mg/kg, daily) (n=6, 7). D Tumor weights of the mice in C after 14 days of treatment. E, F Representative resected tumor pictures (E) and body weights (F) from mice in C. G Western blot analysis of p-eIF2α and eIF2α protein expression levels in tumors from C. Actin is used as a loading control. H Relative band density graphs for p-eIF2α normalized to eIF2α from G (n=3). I, J Multiplex IF staining of CD11c/CD86 and CD25/CD8 in short-term-treated MMTV.f.huHER2#5 tumors and its quantification (n=3). K, L Multiplex IF staining of CD11c/CD86 and CD25/CD8 in short-term-treated MMTV.f.huHER2#5 tumors and its quantification (n=3). Scale bar=100 µm. M Levels of the cytokines in the serums of the mice with short-term-treated MMTV.f.huHER2#5 tumors (n=3). Data for the bar graphs and box plots correspond to mean values ±SD, while data for the tumor volume and body weight graphs correspond to mean values ± standard error of the mean (SEM). End-point criteria for mice in C and F are treatment for 14 days or until reaching ethical tumor size cut-off. P-values for the bar graphs and box plots were calculated with the unpaired, two-tailed Student’s t test. Significance for the tumor volume graph and multiplex IHC quantification was calculated with two-way and one-way ANOVA, respectively. *, P<0.05; **, P<0.01.
Figure 6.
Figure 6.. Schematic summary of the proposed model of T-DM1 sensitivity, resistance and targeting T-DM1 resistance.
A In T-DM1 sensitive tumors, the activation of spindle assembly checkpoint (SAC) and mitotic arrest lead to apoptosis and activation of ICD markers, e.g., eIF2α phosphorylation, ATP secretion, calreticulin surface exposure, and HMGB1 release, leading to DC maturation and cytotoxic T cell, culminating in tumor growth inhibition. B In T-DM1 resistant tumors, overexpression of TACC3 prevents activation of SAC, mitotic cell death and ICD, thus promoting cell survival. C Inhibition of TACC3 in combination with T-DM1 in the resistant tumors restores SAC activation and mitotic arrest, leading to apoptosis and ICD induction, thereby increasing the infiltration of DCs and T cells, thus restoring T-DM1 sensitivity. This figure was drawn using Biorender.com.

References

    1. Galluzzi L., Buque A., Kepp O., Zitvogel L.,Kroemer G. Immunogenic cell death in cancer and infectious disease. Nat Rev Immunol 2017;17:97–111. - PubMed
    1. Kroemer G., Galassi C., Zitvogel L.,Galluzzi L. Immunogenic cell stress and death. Nat Immunol 2022;23:487–500. - PubMed
    1. Galluzzi L., Humeau J., Buque A., Zitvogel L.,Kroemer G. Immunostimulation with chemotherapy in the era of immune checkpoint inhibitors. Nat Rev Clin Oncol 2020;17:725–741. - PubMed
    1. Pol J., Vacchelli E., Aranda F., Castoldi F., Eggermont A., Cremer I., et al. Trial Watch: Immunogenic cell death inducers for anticancer chemotherapy. Oncoimmunology 2015;4:e1008866. - PMC - PubMed
    1. Liu P., Zhao L., Pol J., Levesque S., Petrazzuolo A., Pfirschke C., et al. Crizotinib-induced immunogenic cell death in non-small cell lung cancer. Nat Commun 2019;10:1486. - PMC - PubMed

Publication types