[Preprint]. 2023 Nov 10:2023.09.13.557622.
doi: 10.1101/2023.09.13.557622.

Proximal immune-epithelial progenitor interactions drive chronic tissue sequelae post COVID-19

Affiliations

Proximal immune-epithelial progenitor interactions drive chronic tissue sequelae post COVID-19

Harish Narasimhan et al. bioRxiv. .

Abstract

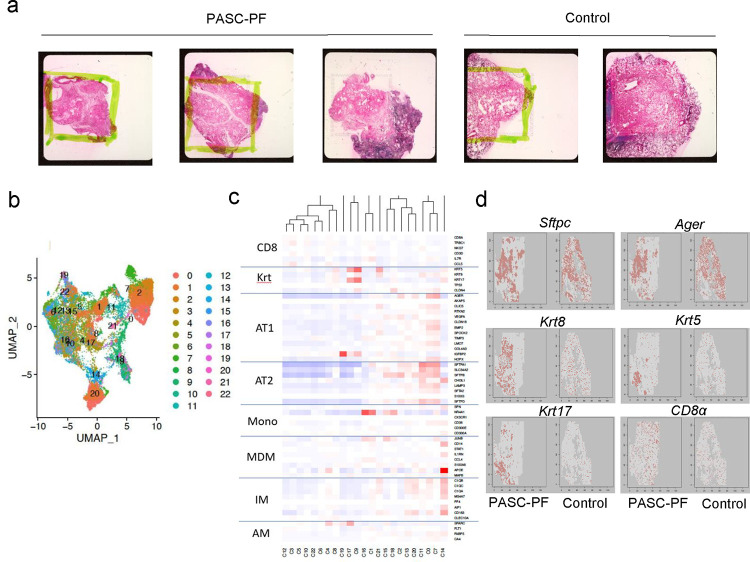
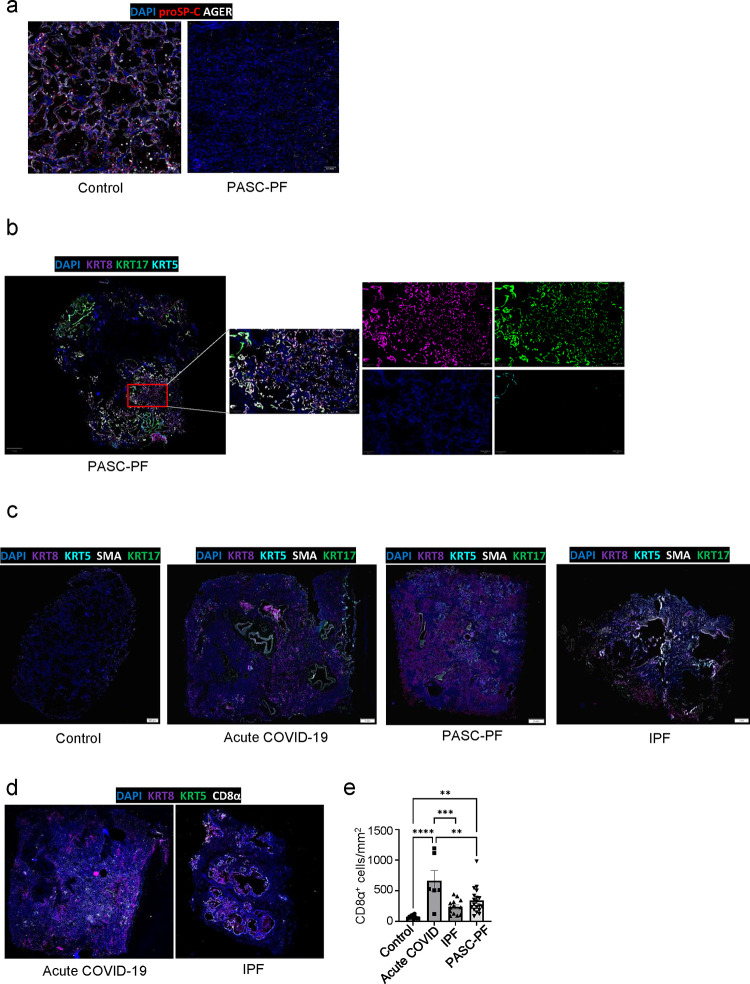
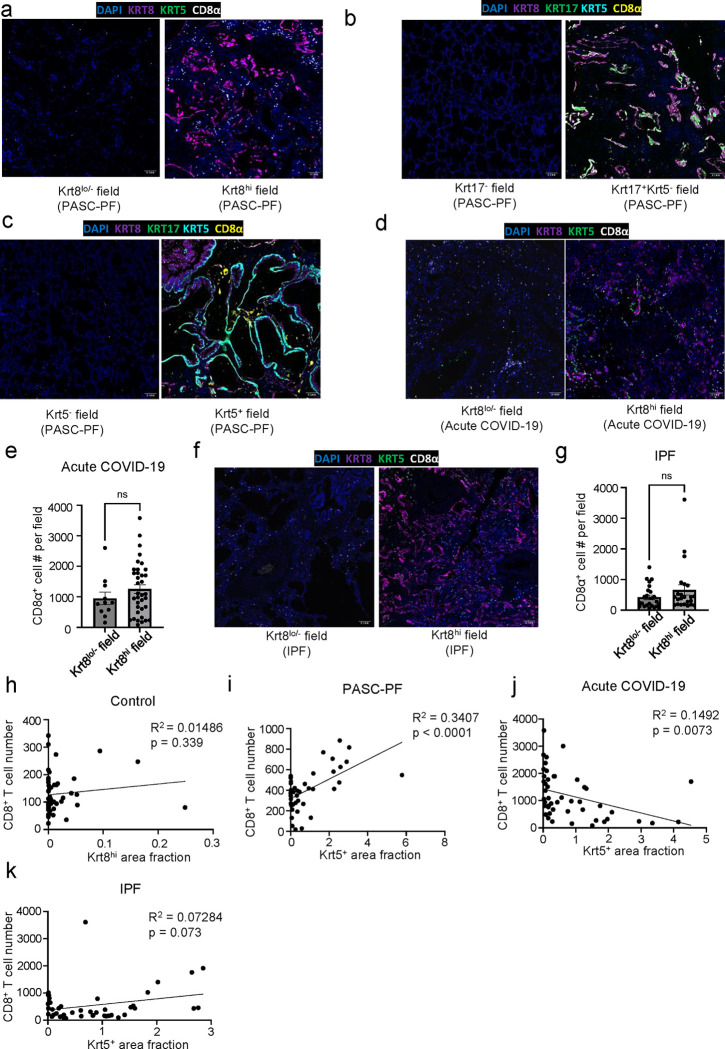
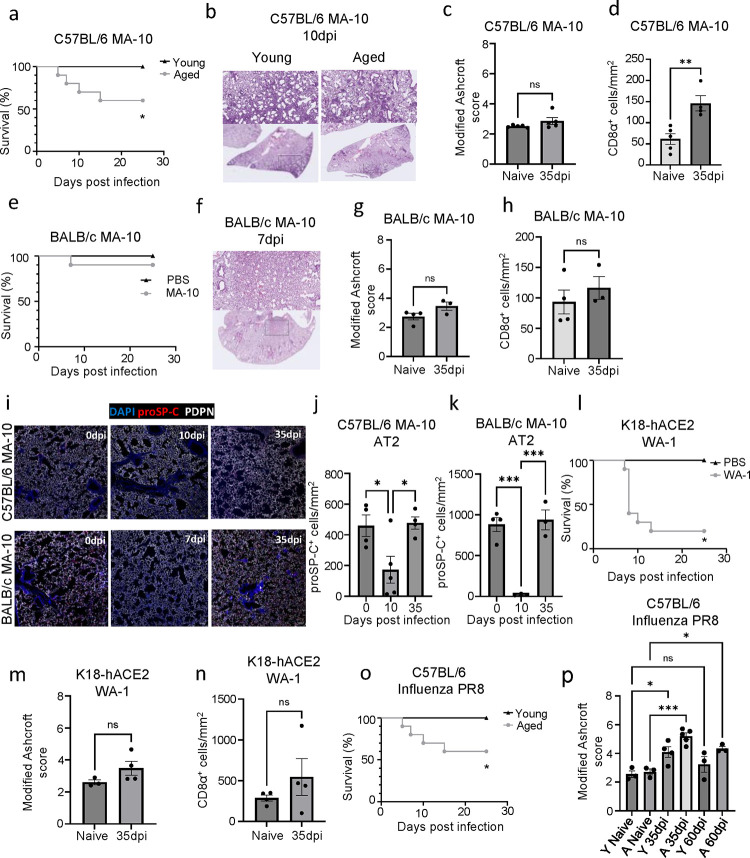
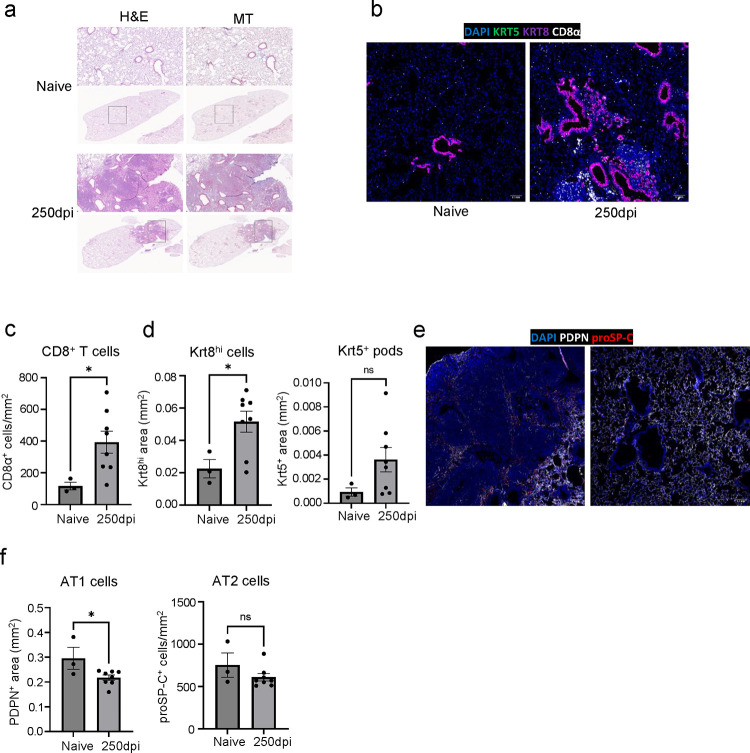
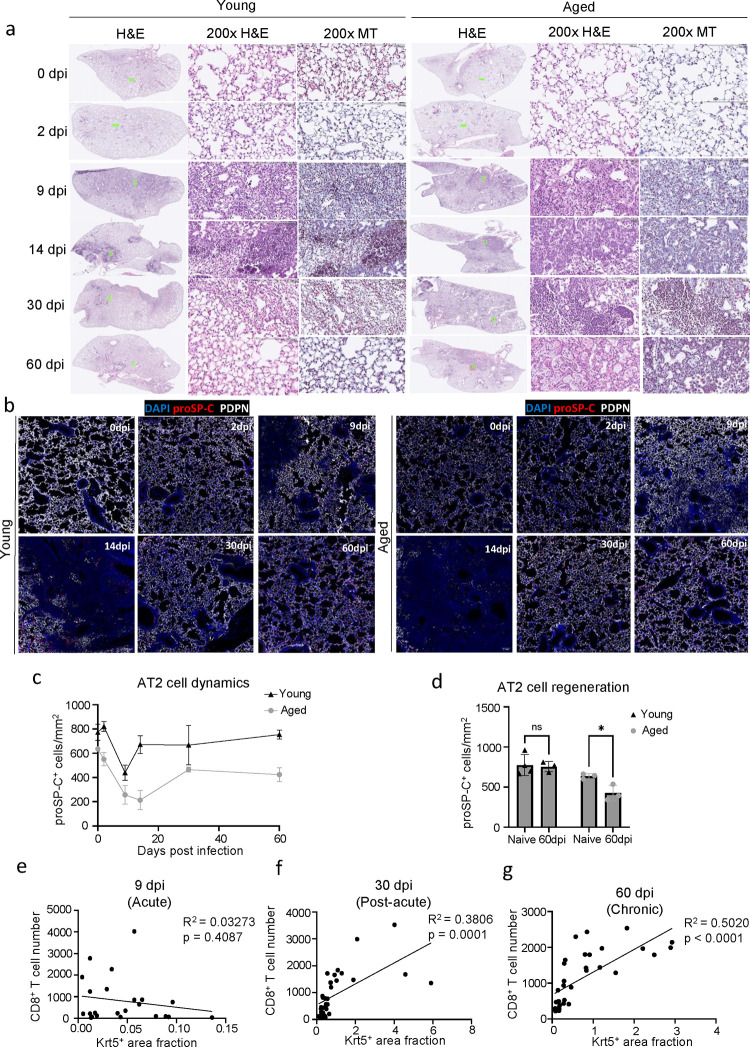
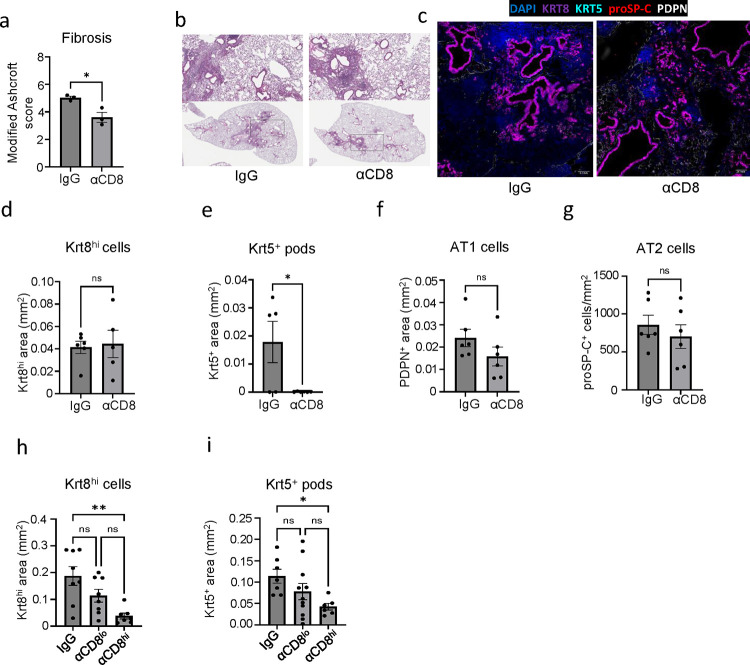
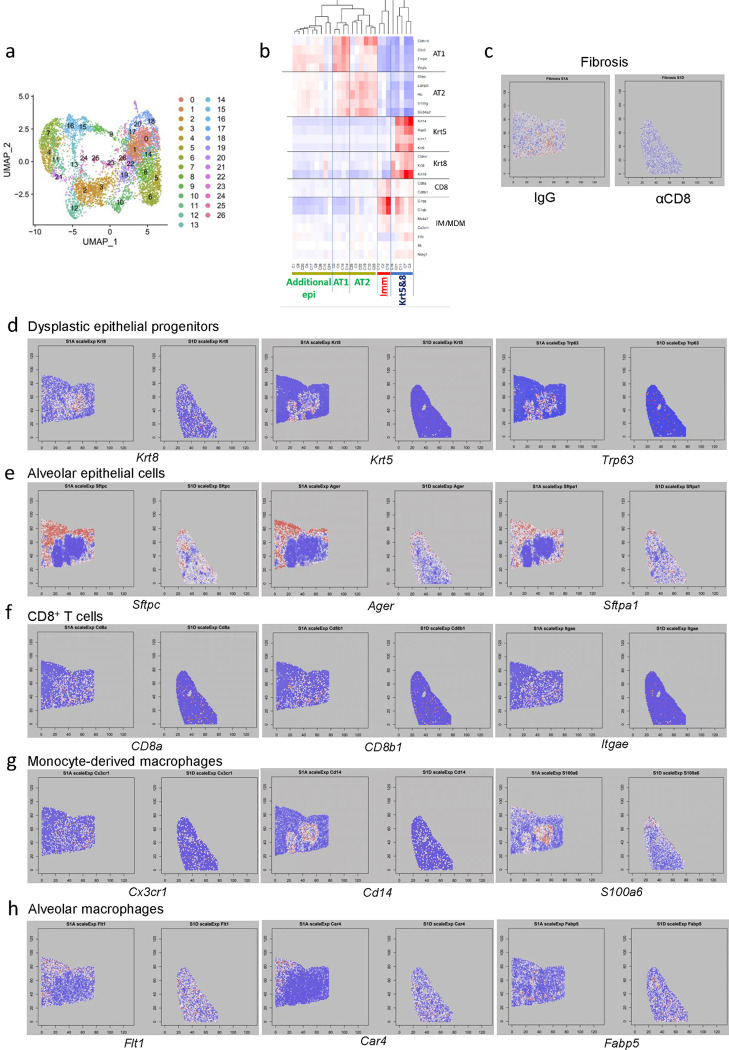
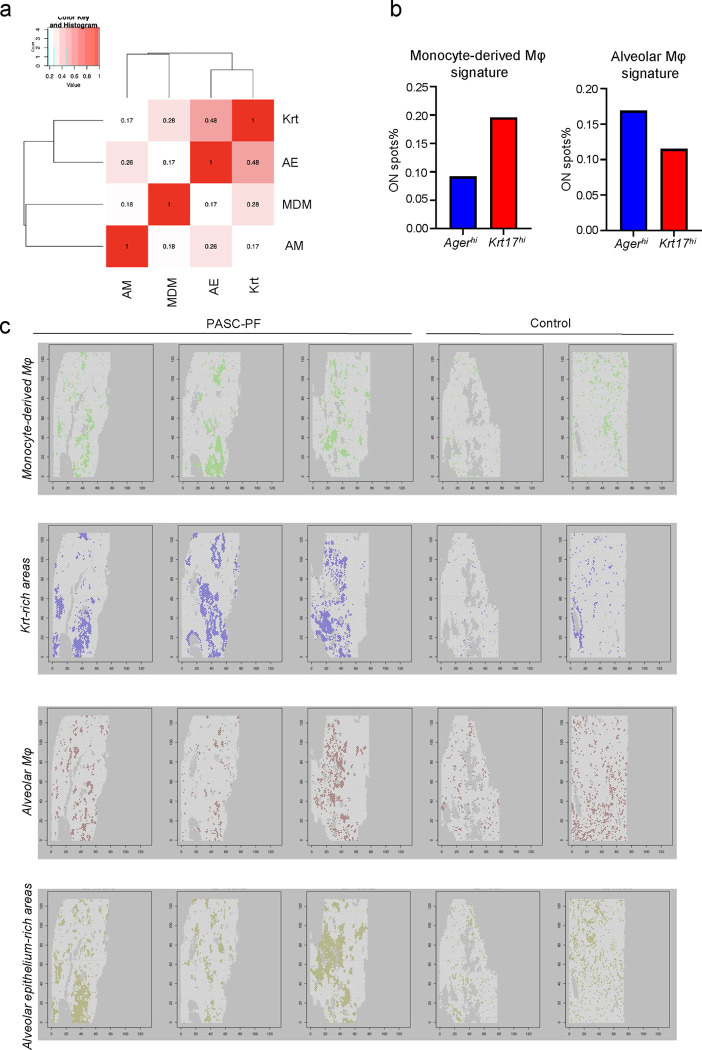
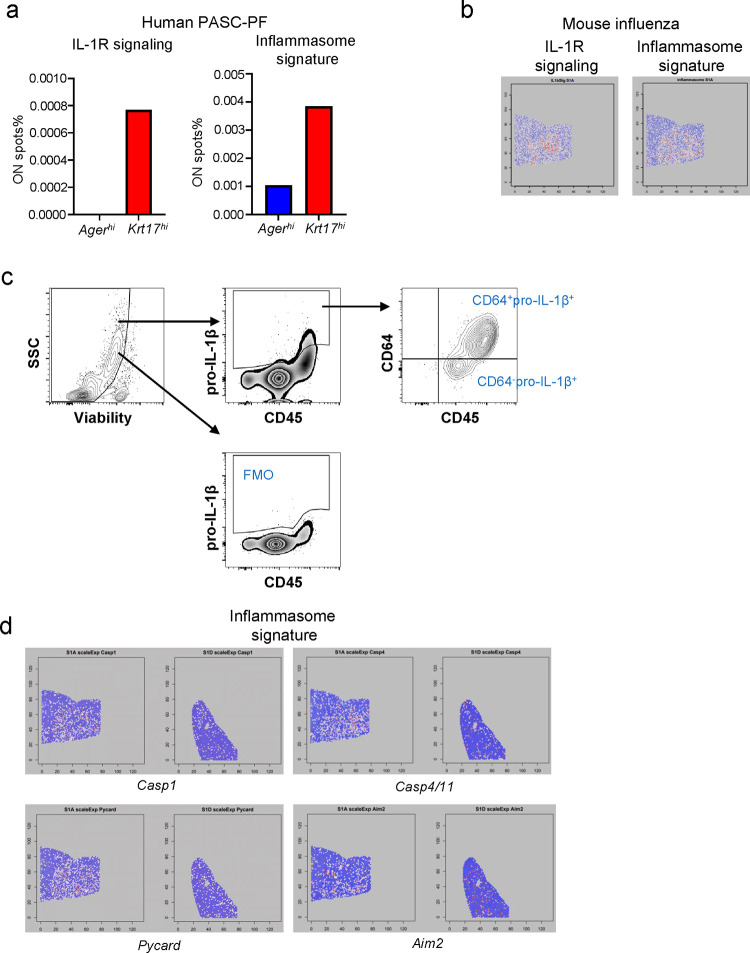
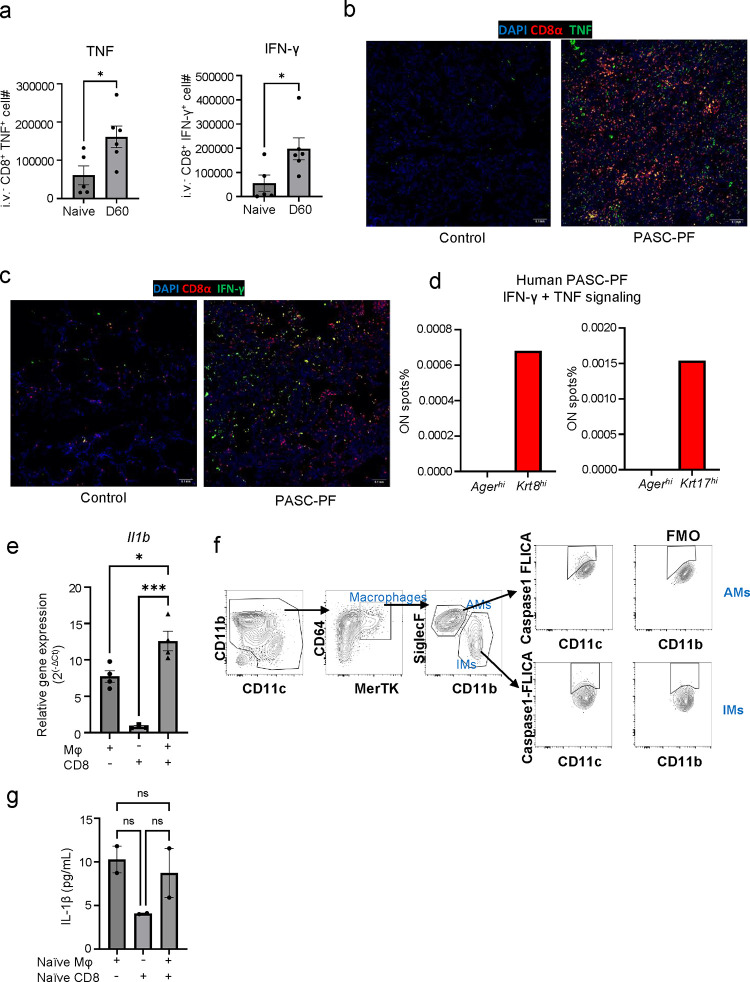
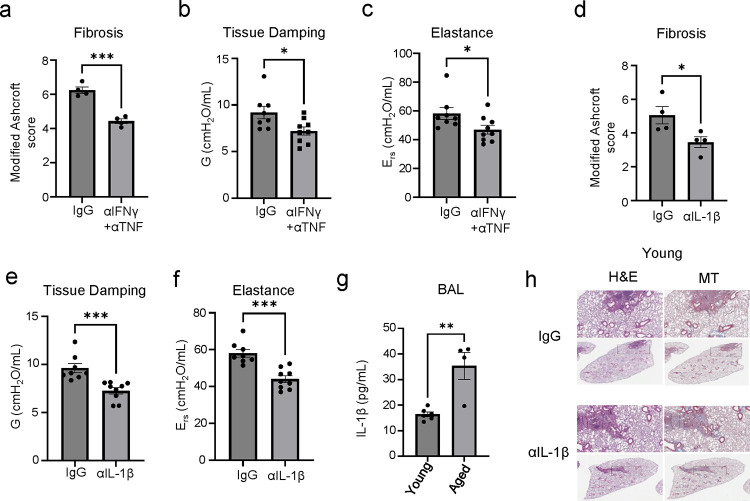
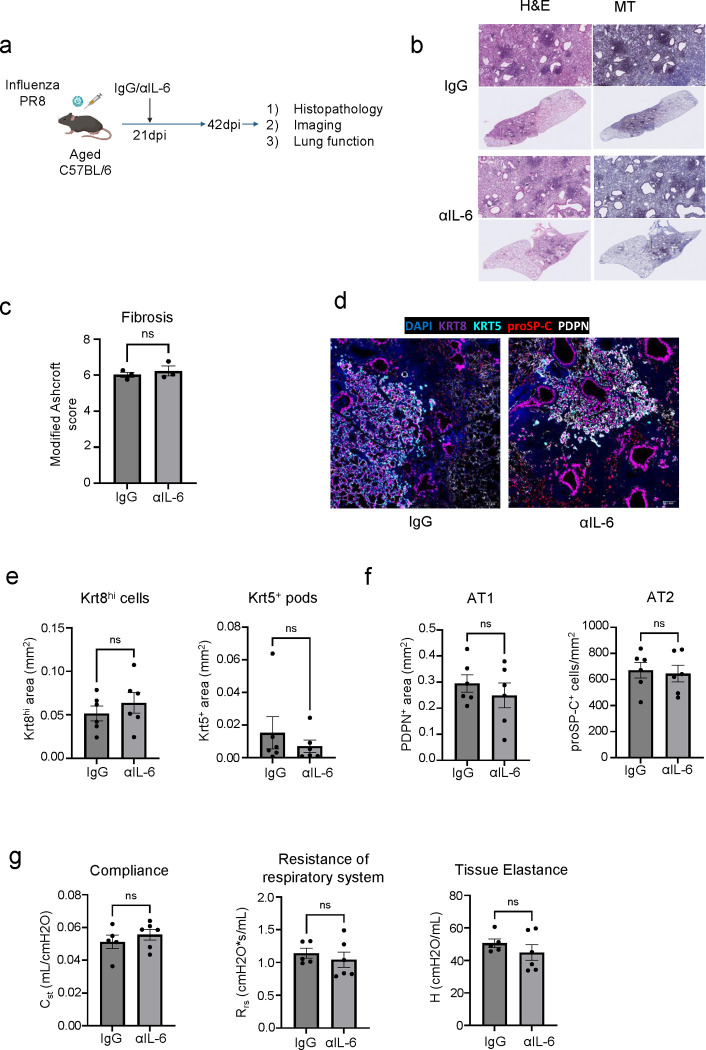
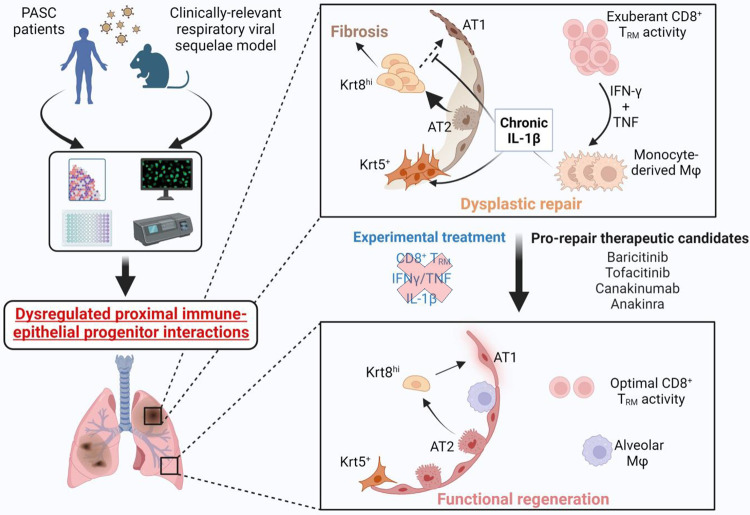
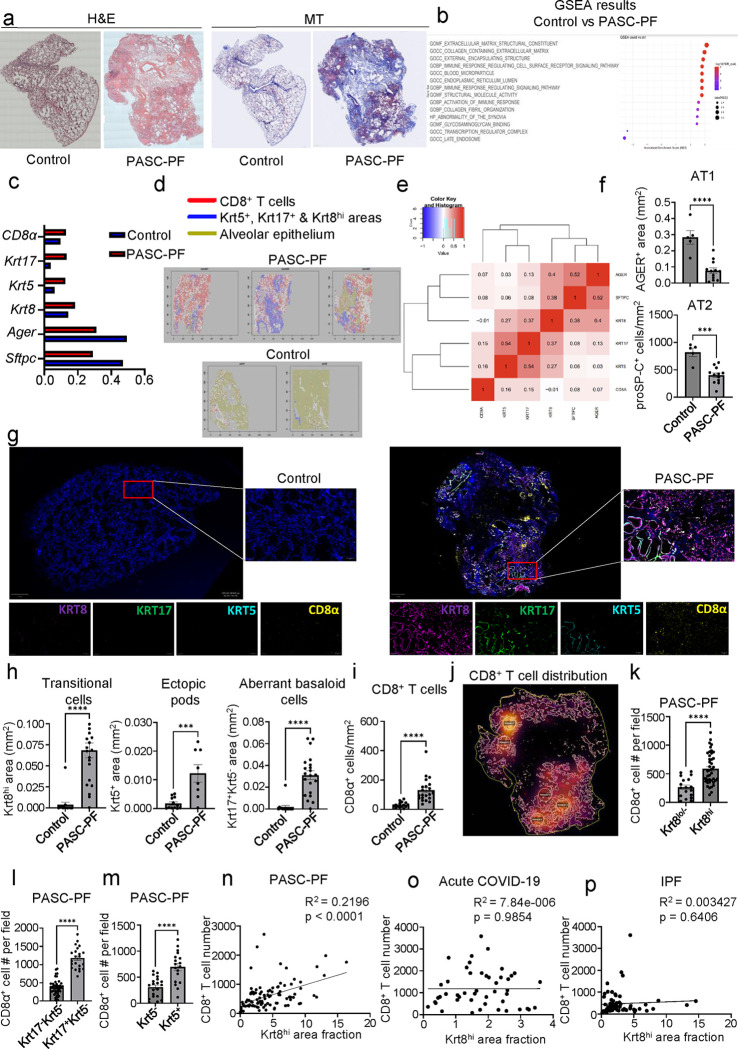
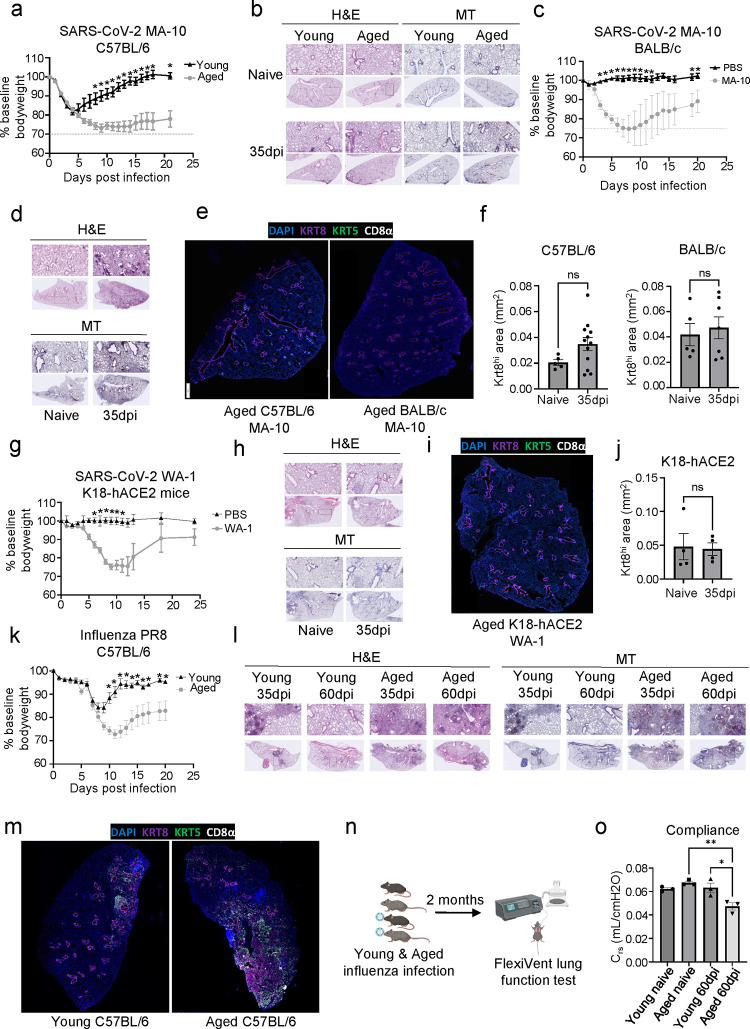
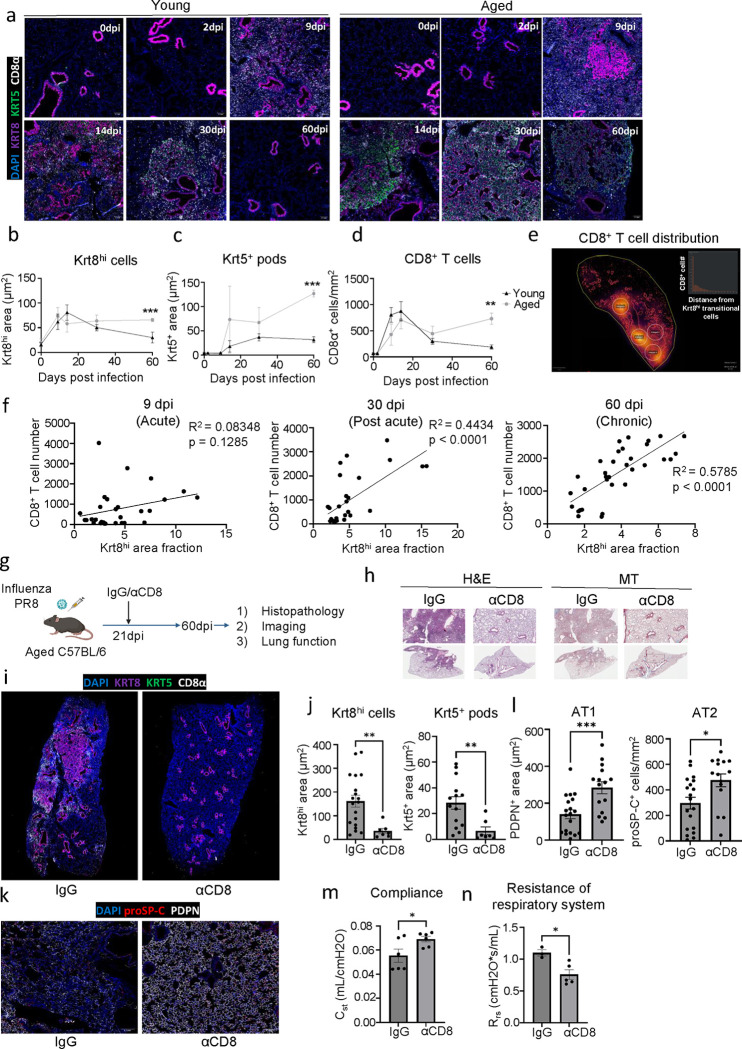
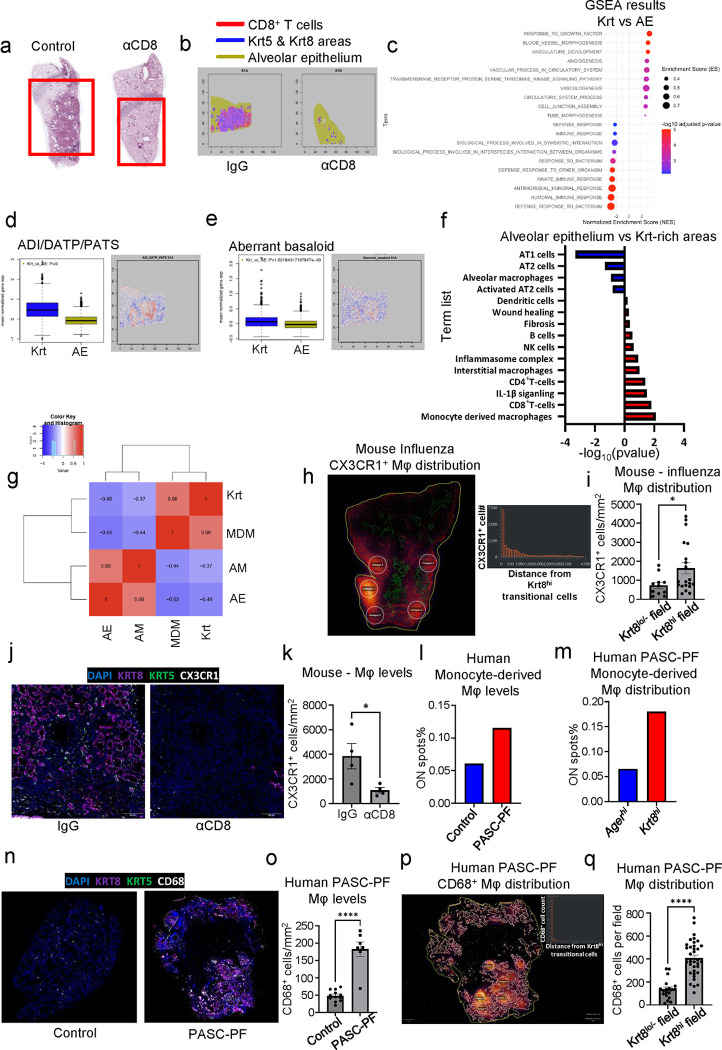
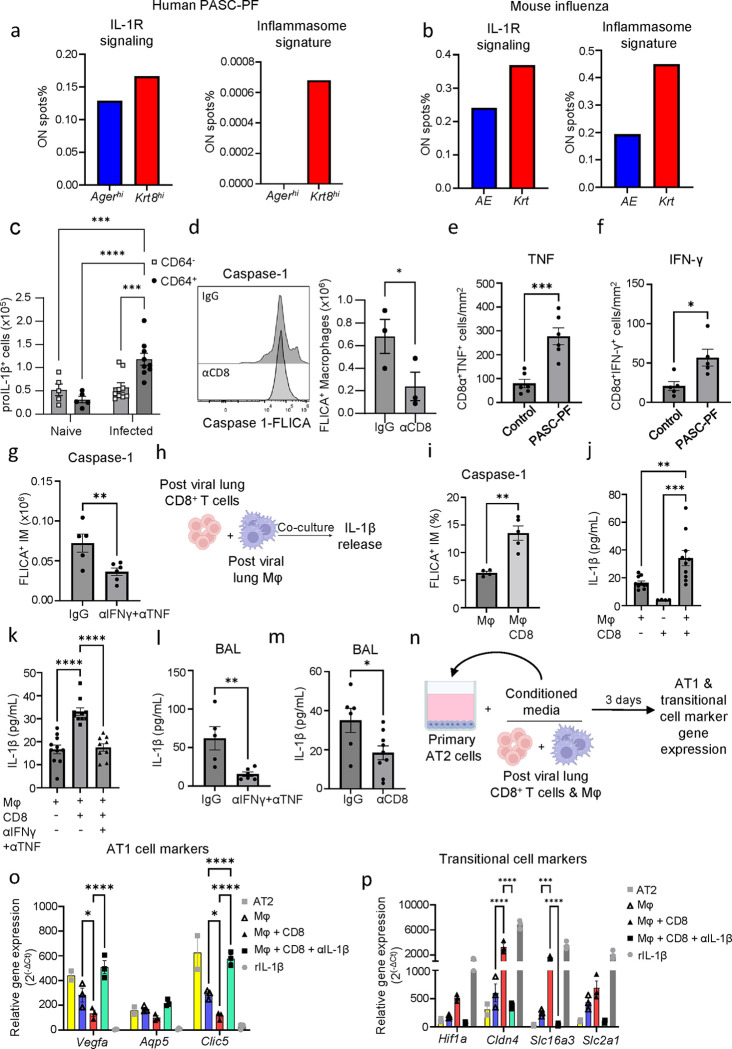
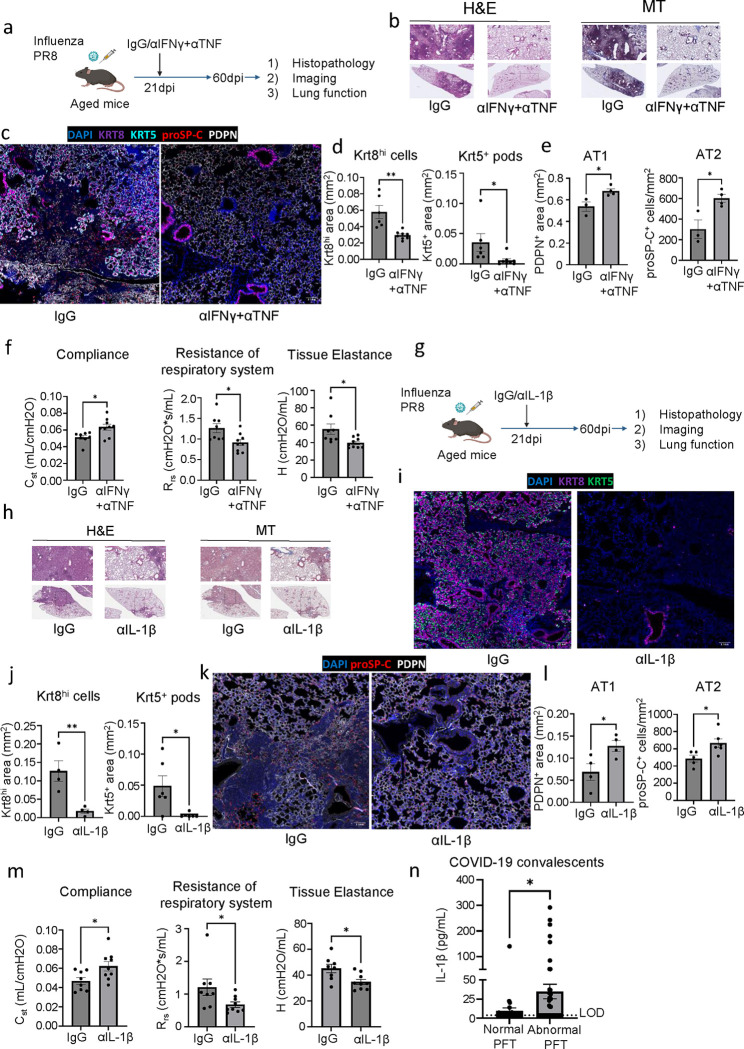
The long-term physiological consequences of SARS-CoV-2, termed Post-Acute Sequelae of COVID-19 (PASC), are rapidly evolving into a major public health concern. The underlying cellular and molecular etiology remain poorly defined but growing evidence links PASC to abnormal immune responses and/or poor organ recovery post-infection. Yet, the precise mechanisms driving non-resolving inflammation and impaired tissue repair in the context of PASC remain unclear. With insights from three independent clinical cohorts of PASC patients with abnormal lung function and/or viral infection-mediated pulmonary fibrosis, we established a clinically relevant mouse model of post-viral lung sequelae to investigate the pathophysiology of respiratory PASC. By employing a combination of spatial transcriptomics and imaging, we identified dysregulated proximal interactions between immune cells and epithelial progenitors unique to the fibroproliferation in respiratory PASC but not acute COVID-19 or idiopathic pulmonary fibrosis (IPF). Specifically, we found a central role for lung-resident CD8+ T cell-macrophage interactions in maintaining Krt8hi transitional and ectopic Krt5+ basal cell progenitors, thus impairing alveolar regeneration and driving fibrotic sequelae after acute viral pneumonia. Mechanistically, CD8+ T cell derived IFN-γ and TNF stimulated lung macrophages to chronically release IL-1β, resulting in the abnormal accumulation of dysplastic epithelial progenitors and fibrosis. Notably, therapeutic neutralization of IFN-γ and TNF, or IL-1β after the resolution of acute infection resulted in markedly improved alveolar regeneration and restoration of pulmonary function. Together, our findings implicate a dysregulated immune-epithelial progenitor niche in driving respiratory PASC. Moreover, in contrast to other approaches requiring early intervention, we highlight therapeutic strategies to rescue fibrotic disease in the aftermath of respiratory viral infections, addressing the current unmet need in the clinical management of PASC and post-viral disease.


Figures

Extended data Fig.1
Extended data Fig.1. Spatial transcriptomics of human PASC-PF lungs reveal persistent defects in alveolar regeneration and chronic inflammation.
(a) Representative H&E images of human control (n=2) and PASC-PF (n=3) lungs sections that were mounted onto the 10X Visium slide. (b) UMAP visualization of spatial transcriptomics data from human control and PASC-PF lungs. (c) Heatmap of key marker gene expression across all identified clusters of spots. (d) Spatial gene expression maps of epithelial and immune cell markers in control and PASC-PF lungs.
Extended data Fig.2
Extended data Fig.2. PASC-PF lungs exhibit hallmarks of persistent dysplastic repair and inflammation
(a) Representative immunofluorescence images staining alveolar epithelial cell markers (AT1 – AGER; AT2 – proSP-C) in control and PASC-PF lung sections. (b) Representative immunofluorescence image of PASC-PF lungs staining for dysplastic epithelial progenitors (Krt5, Krt8, Krt17), with higher magnification inset showing independent channels. (c) Representative immunofluorescence images staining for myofibroblasts (αSMA) and aberrant epithelial progenitors (Krt5, Krt17, Krt8) in human control, acute COVID-19, PASC-PF and IPF lung sections. (d) Representative immunofluorescence images staining CD8+ T cells and epithelial progenitors in acute COVID-19 and idiopathic pulmonary fibrosis (IPF) lung sections. (e) Quantification of CD8+ T cell number in control, acute COVID-19, PASC-PF, and IPF lung sections (n = 11 control, 6 Acute COVID-19, 19 PASC-PF, 13 IPF). Data are expressed as mean ± SEM. Statistical analyses were conducted using an ordinary one-way ANOVA (o). *p < 0.05; **p < 0.01; ***p < 0.001; ****p < 0.0001.
Extended data Fig.3
Extended data Fig.3. Characterization of immune-epithelial progenitor interactions in human PASC-PF, acute COVID-19 and IPF lungs.
(a) Representative immunofluorescence images staining CD8+ T cells in Krt8−/lo and Krt8hi areas within PASC-PF lungs. (b) Representative immunofluorescence images staining CD8+ T cells in Krt17 and Krt17+Krt5 areas within PASC-PF lungs. (c) Representative immunofluorescence images staining CD8+ T cells in Krt5 and Krt5+ areas within PASC-PF lungs. (d) Representative immunofluorescence images staining CD8+ T cells in Krt8−/lo and Krt8hi areas within acute COVID-19 lungs. (e) Quantification of CD8+ T cells in Krt8−/lo and Krt8hi areas within acute COVID-19 lungs. (n=8) (f) Representative immunofluorescence images staining CD8+ T cells in Krt8−/lo and Krt8hi areas within IPF lungs. (g) Quantification of CD8+ T cells in Krt8−/lo and Krt8hi areas within IPF lungs. (n=8) (h) Simple linear regression of CD8+ T cell number and Krt5+ area fraction in control lungs. (i) Simple linear regression of CD8+ T cell number and Krt5+ area fraction in PASC-PF, (j) acute COVID-19, and (k) IPF lung sections. Data are expressed as mean ± SEM. Statistical analyses were conducted using a two-tailed unpaired t-test. ****p<0.0001.
Extended data Fig.4
Extended data Fig.4. Aged mice exhibit increased severity during acute SARS-CoV-2 and influenza virus infection.
(a) Survival data of young and aged C57BL/6 following SARS-CoV-2 MA-10 infection. (b) Representative H&E images of young and aged C57BL/6 mice from the acute (10dpi) phase of SARS-CoV-2 MA-10 infection. (c) Evaluation of fibrotic disease in naïve and SARS-CoV-2 MA-10 infected (35dpi) lungs of aged C57BL/6 mice by modified Ashcroft score. (n = 5 naïve, 5 MA-10) (d) Quantification of CD8+ T cell number from immunofluorescence images in naïve and SARS-CoV-2 MA-10 infected (35dpi) aged C57BL/6 mice. (n = 5 naïve, 4 MA-10) (e) Survival data of aged BALB/c following SARS-CoV-2 MA-10 infection. (f) Representative H&E images of aged BALB/c mice from the acute (7dpi) phase of SARS-CoV-2 MA-10 infection. (g) Evaluation of fibrotic disease in naïve and SARS-CoV-2 MA-10 infected (35dpi) lungs of aged BALB/c mice by modified Ashcroft score. (n = 4 naïve, 3 MA-10) (h) Quantification of CD8+ T cell number from immunofluorescence images in naïve and SARS-CoV-2 MA-10 infected (35dpi) aged BALB/c mice. (n = 4 naïve, 3 MA-10) (i) Representative immunofluorescence images of aged C57BL/6 and BALB/c mouse lungs infected with SARS-CoV-2 MA-10, staining alveolar epithelial cell markers (AT1- PDPN; AT2 – proSP-C). (j) Quantification of proSP-C+ AT2 cells in aged C57BL/6 and (k) BALB/c mouse lungs post SARS-CoV-2 MA-10 infection. (n= 3–5 per time point) (l) Survival data of aged K18-hACE2 mice following SARS-CoV-2 WA-1 virus infection. (m) Evaluation of fibrotic disease in naïve and SARS-CoV-2 WA-1 infected (35dpi) lungs of aged K18-hACE2 mice by modified Ashcroft score. (n = 3 naïve, 4 WA-1) (n) Quantification of CD8+ T cell number from immunofluorescence images in naïve and SARS-CoV-2 WA-1 infected (35dpi) aged K18-hACE2 mice. (n = 4 naïve, 4 WA-1) (o) Survival data of young and aged C57BL/6 following PR8 influenza virus infection. (p) Evaluation of fibrotic disease in naïve and PR8 influenza-infected (35dpi & 60dpi) lungs of young and aged C57BL/6 mice by modified Ashcroft score (n=3 per timepoint). Data are expressed as mean ± SEM. Statistical analyses were conducted using a two-tailed unpaired t-test (c,d,g,h,m,n), log-rank test (a,e,l,o), and an ordinary one-way ANOVA (j,k,p). *p < 0.05; **p < 0.01; ***p < 0.001.
Extended data Fig.5
Extended data Fig.5. Aged influenza-infected mice exhibit chronic pulmonary pathology up to 8 months post infection.
(a) Representative H&E and MT images of naive and influenza-infected (250dpi) lungs of aged C57BL/6 mouse lungs. (b) Representative immunofluorescence images of naive and influenza-infected (250dpi) aged C57BL/6 mouse lungs staining for dysplastic epithelial progenitors (Krt5 & Krt8) and CD8 T cells (CD8α). (c) Quantification of CD8+ T cells, (d) Krt8hi and Krt5+ areas in naïve influenza-infected (250dpi) aged C57BL/6 mouse lungs. (n = 3 naïve, 8 infected) (e) Representative immunofluorescence images of naive and influenza-infected (250dpi) aged C57BL/6 mouse lungs staining for alveolar epithelial cell (AT1- PDPN; AT2 – proSP-C) markers. (f) Quantification of PDPN+ AT1 cells and proSP-C+ AT2 cells in naïve influenza-infected (250dpi) aged C57BL/6 mouse lungs (n = 3 naïve, 8 infected). Data are expressed as mean ± SEM. Statistical analyses were conducted using a two-tailed unpaired t-test. *p < 0.05.
Extended data Fig.6
Extended data Fig.6. Chronic pathology and tissue sequelae after influenza infection mimics features of human PASC-PF.
(a) Representative H&E and MT images of young and aged C57BL/6 influenza-infected mouse lungs over the course of infection. (b) Representative immunofluorescence images of young and aged C57BL/6 influenza-infected mouse lungs, staining alveolar epithelial cell markers (AT1- PDPN; AT2 – proSP-C) over the course of influenza infection. (c) Quantification of AT2 (proSP-C+) cell numbers in young and aged mice over the course of influenza infection (n= 3–4 per timepoint). (d) Quantification of AT2 (proSP-C+) cells in naïve and influenza-infected (60dpi) young and aged mouse lungs (n= 3–4 per timepoint). (e) Simple linear regression of CD8+ T cell number and Krt5+ area fraction in aged influenza-infected mouse lungs at 9 dpi, (f) 30dpi and (g) 60dpi. Data are expressed as mean ± SEM. Statistical analyses were conducted using a two-way ANOVA. *p < 0.05.
Extended data Fig.7
Extended data Fig.7. Depletion of lung-resident CD8+ T cells improves fibrotic disease in aged but not young mice.
(a) Evaluation of fibrotic disease in aged influenza-infected C57BL/6 mice (60dpi) following treatment with αCD8 or control IgG Ab. (n = 3 control IgG, 3 αCD8) (b) Representative H&E images of young C57BL/6 lungs post influenza infection (60dpi) treated with αCD8 or control IgG Ab. (c) Representative immunofluorescence images of young C57BL/6 lungs post influenza infection (60dpi) treated with αCD8 or control IgG Ab. (d) Quantification of Krt8hi, (e) Krt5+, (f) AT1, and (g) AT2 cells in young influenza-infected mouse lungs, treated with αCD8 Ab or control IgG Ab. (n = 5 IgG, 5 αCD8) (h) Quantification of Krt8hi and (k) Krt5+ area in aged influenza-infected mouse lungs (60dpi), treated with control IgG Ab, low dose αCD8 or high dose αCD8 (n = 6–8 per condition). Data are expressed as mean ± SEM. Statistical analyses were conducted using a two-tailed unpaired t-test (a,d-g), and an ordinary one-way ANOVA (h,i). *p < 0.05; **p < 0.01.
Extended data Fig.8
Extended data Fig.8. CD8+ T cell depletion induces widespread changes in immune and epithelial cells gene expression when evaluated by spatial transcriptomics.
(a) UMAP visualization of spatial transcriptomics data from aged influenza-infected mice (60dpi), treated with control IgG Ab (N=2) or αCD8 (N=2). (b) Heatmap of gene expression across all identified clusters of spots. (c) Spatial map of the expression of genes associated with lung fibrosis in aged influenza-infected mice (60dpi), treated with control IgG Ab (S1A) or αCD8 (S1D). (d) Spatial map of the expression of dysplastic epithelial progenitors (Krt8, Krt5, Trp63), (e) alveolar epithelial (Sftpc1, Ager, Sftpa1), (f) CD8+ T cell (CD8a, CD8b1, Itgae), (g) monocyte-derived macrophages (Cx3cr1, Cd14, S100a6), and (h) alveolar macrophage (Flt1, Car4, Fabp5) marker genes in aged influenza-infected mice (60dpi), treated with control IgG Ab (S1A) or αCD8 (S1D).
Extended data Fig.9
Extended data Fig.9. Monocyte-derived macrophages but not alveolar macrophages are enriched in areas of dysplastic repair.
(a) Heatmap of the physical distribution of monocyte-derived macrophages (MDM), alveolar macrophages (AM), healthy alveolar epithelium (AE), and dysplastic areas (Krt) within human PASC-PF lungs. (b) Quantification of the proportion of spots expressing gene signatures characterizing monocyte-derived macrophages and alveolar macrophages in Agerhi and Krt17hi areas of human PASC-PF lungs. (c) Spatial gene expression maps of monocyte-derived macrophages, Krt-rich dysplastic areas, alveolar macrophages and healthy alveolar epithelium in human control and PASC-PF lungs.
Extended data Fig.10
Extended data Fig.10. Areas of dysplastic repair are enriched with IL-1R signaling and inflammasome signatures in human PASC-PF and aged influenza-infected mouse lungs.
(a) Quantification of the proportion of spots expressing gene signatures of IL-1R signaling and inflammasome activity in Agerhi and Krt17hi areas of human PASC-PF lungs. (b) Spatial gene expression maps of IL-1R signaling and inflammasome activity in aged influenza-infected mouse lungs (60dpi). (c) Gating strategy to identify proIL-1β+ cells in the lungs of influenza-infected mice by flow cytometry. (d) Spatial gene expression maps of inflammasome components in aged influenza-infected mice (60dpi) treated with control IgG Ab (S1A) or αCD8 (S1D).
Extended data Fig.11
Extended data Fig.11. CD8+ T cell derived IFN-γ and TNF promotes IL-1β release.
(a) Quantification of TNF+ and IFN-γ+ lung-resident CD8+ T cells in naïve and influenza-infected (60dpi) aged mouse lungs. (b) Representative immunofluorescence images staining for CD8+ T cells (CD8α) and TNF in human control and PASC-PF lungs. (c) Representative immunofluorescence images staining for CD8 T cells (CD8α) and IFN-γ in human control and PASC-PF lungs. (d) Quantification of the proportion of spots expressing gene signatures of IFN-γ + TNF signaling in healthy (Agerhi) and dysplastic areas (Krt8hi or Krt17+) within human PASC-PF lungs. (e) Quantification of IL-1β gene expression in following macrophage and CD8+ T cell coculture. (f) Gating strategy to identify FLICA+ cells following infection of aged C57BL/6 mice. (g) Evaluation of IL-1β release into the supernatant following isolation and coculture of macrophages and CD8+ T cells from naïve aged C57BL/6 mice. Data are expressed as mean ± SEM. Statistical analyses were conducted using a two-tailed unpaired t-test (a), and an ordinary one-way ANOVA (e,g). *p < 0.05; *** p <0.001.
Extended data Fig.12
Extended data Fig.12. Neutralization of IFN-γ and TNF or IL-1β activity in the post-acute phase of infection improves outcomes in aged influenza-infected mice.
(a) Evaluation of fibrotic disease in aged influenza infected C57BL/6 mice (42dpi) treated with control IgG Ab or αIFN-γ + αTNF neutralizing Ab. (b) Quantification of tissue damping (G) and (c) elastance of the respiratory system (Ers) in aged influenza infected C57BL/6 mice (42dpi) treated with control IgG Ab or αIFN-γ + αTNF neutralizing Ab. (d) Evaluation of fibrotic disease in aged influenza infected C57BL/6 mice (42dpi) treated with control IgG Ab or αIL-1β neutralizing Ab. (e) Quantification of tissue damping (G) and (f) elastance of the respiratory system (Ers) in aged influenza infected C57BL/6 mice (42dpi) treated with control IgG Ab or αIL-1β neutralizing Ab. (g) Evaluation of IL-1β levels in the BAL fluid of young and aged influenza-infected mice (42dpi). (h) Representative H&E and MT images of young C57BL/6 lungs post influenza infection (42pi) treated with αIL-1β neutralizing Ab or control IgG Ab. Data are expressed as mean ± SEM. Statistical analyses were conducted using a two-tailed unpaired t-test. *p < 0.05; **p < 0.01; ***p < 0.001.
Extended data Fig.13
Extended data Fig.13. Neutralization of IL-6 activity in the post-acute phase of influenza infection does not improve long-term outcomes.
(a) Experimental design for in vivo IL-6 neutralization post PR8 influenza infection. (b) Representative H&E and MT images of aged C57BL/6 lungs post PR8 influenza infection (42dpi) treated with αIL-6 neutralizing Ab or control IgG Ab. (c). Evaluation of fibrotic disease in aged influenza-infected (42dpi) mice treated with αIL-6 neutralizing Ab or control IgG Ab. (d) Representative immunofluorescence images staining AT1 (PDPN+), AT2 (proSP-C+) and epithelial progenitors (Krt5+ and Krt8hi) in aged influenza-infected mice (42dpi) treated with αIL-6 neutralizing Ab or control IgG Ab. (e) Quantification of Krt8hi and Krt5+ area and (f) AT1 (PDPN+) and AT2 (proSP-C+) cells in aged influenza-infected mice treated with αIL-6 neutralizing Ab or control IgG Ab (n= 6 control IgG, 6 αIL-6). (g) Evaluation of static compliance (Cst), resistance of the respiratory system (Rrs), and tissue elastance (H) in aged influenza-infected mice (42dpi) treated with αIL-6 neutralizing Ab or control IgG Ab (n= 5 control IgG, 6 αIL-6). Data are expressed as mean ± SEM. Statistical analyses were conducted using a two-tailed unpaired t-test. *p < 0.05.
Extended data Fig.14
Dysregulated immune-epithelial progenitor interactions drive post-viral sequelae in PASC.
Fig.1
Fig.1. Spatial transcriptomics and imaging reveals chronic persistence and association between CD8+ T cells and epithelial progenitors in human PASC-PF.
a. Representative hematoxylin & eosin (H&E) and Masson’s Trichrome (MT) images of control and PASC-PF lung sections. b. Unbiased GSEA analysis of signaling pathways differentially regulated between control and PASC-PF lungs. c. Quantification of the proportion of spots expressing genes characterizing various immune and epithelial populations in control and PASC-PF lungs. d. Visualization of CD8+ T cells, Krt5+, Krt8hi and Krt17+-rich areas, and healthy alveolar epithelium based on gene expression signatures in human control and PASC-PF lungs. e. Heatmap of physical distribution of alveolar epithelium, dysplastic progenitors and CD8+ T cells. f. Quantification of AT1 (AGER+) and AT2 (proSP-C+) cells in control and PASC-PF lung sections (n = 5 control, 12 PASC-PF). g. Representative immunofluorescence images staining CD8+ T cells (CD8α+) and epithelial progenitors (Krt5+, Krt17+, and Krt8hi) in control and PASC-PF lung sections. h. Quantification of Krt8hi, Krt5+, Krt17+Krt5 and i. CD8+ T cells in control and PASC-PF lung sections (n = 15 control, 21 PASC-PF). j. Unbiased analysis of CD8+ T cell distribution in a PASC-PF lung section using QuPath. k. Quantification of the distribution of CD8+ T cells between fields with or without Krt8hi, l. Krt5Krt17+, and m. Krt5+ areas in human PASC-PF lungs. n. Simple linear regression of CD8+ T cell number and Krt8hi area fraction in human PASC-PF, o. acute COVID-19, and p. IPF lung sections. Data are expressed as mean ± SEM. Statistical analyses were conducted using a two-tailed unpaired t-test (e,g,h,j-m). *p < 0.05; **p < 0.01; ***p < 0.001; ****p < 0.0001.
Fig.2
Fig.2. Development of a mouse model of post-viral fibrosis recapitulating features of human PASC-PF.
a. Percent change in bodyweight of young (8–10 weeks) and aged (20–22 months) C57BL/6 mice post infection with SARS-CoV-2 MA-10 virus. b. Representative H&E and MT images of young and aged C57BL/6 lungs post SARS-CoV-2 infection (35dpi) or PBS administration. c. Percent change in bodyweight of aged (12–14 months) BALB/c mice post infection with SARS-CoV-2 MA-10 virus or PBS administration. d. Representative H&E and MT images of aged BALB/c lungs post SARS-CoV-2 infection (35dpi) or PBS administration. e. Representative immunofluorescence images staining CD8+ T cells (CD8α) and epithelial progenitors (Krt5+ and Krt8hi) in aged C57BL/6 and BALB/c mouse lungs post SARS-CoV-2 infection (35dpi). f. Quantification of Krt8hi area in aged C57BL/6 and BALB/c mice post SARS-CoV-2 infection (35dpi). g. Percent change in bodyweight of aged (12–14 months) K18-hACE2 mice post infection with SARS-CoV-2 WA-1 virus or PBS administration. h. Representative H&E and MT images of aged K18-hACE2 lungs post SARS-CoV-2 infection (35dpi) or PBS administration. i. Representative immunofluorescence image staining CD8+ T cells (CD8α) and epithelial progenitors (Krt5+ and Krt8hi) in aged K18-hACE2 mouse lungs post SARS-CoV-2 infection (35dpi). j. Quantification of Krt8hi area in aged K18-hACE2 mice post SARS-CoV-2 infection (35dpi). k. Percent change in bodyweight of young (8–10 weeks) and aged (20–22 months) C57BL/6 mice post infection with 75PFU of PR8 influenza virus. l. Representative H&E and MT images of young and aged C57BL/6 lungs post PR8 influenza virus infection (35dpi and 60dpi). m. Representative immunofluorescence images staining CD8+ T cells (CD8α) and epithelial progenitors (Krt5+ and Krt8hi) in young and aged C57BL/6 mouse lungs post H1N1 influenza A/PR8/34 virus infection (35dpi). n. Schematic of the FlexiVent system to evaluate pulmonary function in mice. o. Evaluation of compliance of the respiratory system in young and aged mice post PBS administration or influenza infection (60dpi). Data are expressed as mean ± SEM. Statistical analyses were conducted using a two-tailed unpaired t-test (f,j), multiple t tests (a,c,g,k), and an ordinary one-way ANOVA (o). *p < 0.05; **p < 0.01.
Fig.3
Fig.3. Persistent CD8+ T cell activity impairs functional alveolar regeneration and promote dysplastic lung repair.
a. Representative immunofluorescence images staining CD8+ T cells (CD8α+) and epithelial progenitors (Krt5+ and Krt8hi) in young and aged C57BL/6 mouse lungs over the course of influenza infection. b. Quantification of Krt8hi, c. Krt5+, and d. CD8+ T cells in young and aged lungs post influenza infection (n = 4 per time point). e. Unbiased analysis of CD8+ T cell distribution in an aged mouse lung section post influenza infection (60dpi). f. Simple linear regression of CD8+ T cell number and Krt8hi area fraction in influenza-infected mice at 9, 30, and 60dpi. g. Experimental design for CD8+ T cell depletion post influenza infection. h. Representative H&E and MT images of aged C57BL/6 lungs post influenza infection (60dpi) treated with αCD8 or control IgG antibody (Ab). i. Representative immunofluorescence images staining CD8+ T cells (CD8α+) and epithelial progenitors (Krt5+ and Krt8hi) in aged C57BL/6 mouse lungs post influenza infection (60dpi) treated with αCD8 or control IgG Ab. j. Quantification of Krt8hi and Krt5+ area in aged influenza-infected lung sections treated with αCD8 or control IgG Ab. (n = 19 control IgG, 7 αCD8). k. Representative immunofluorescence images staining AT1 (PDPN+) and AT2 (proSP-C+) in aged C57BL/6 mouse lungs post influenza infection (60dpi), treated with αCD8 or control IgG Ab. l. Quantification of AT1 (PDPN+) and AT2 (proSP-C+) cells in aged influenza-infected lung sections treated with αCD8 or control IgG Ab. (n = 19 control IgG, 15 αCD8). m. Evaluation of static compliance (Cst) and n. resistance of the respiratory system (Rrs) in aged C57BL/6 mouse lungs post influenza infection (60dpi), treated with αCD8 or control IgG Ab. Data are expressed as mean ± SEM. Statistical analyses were conducted using a two-tailed unpaired t-test (j,l,m,n) and multiple t tests (b-d). *p < 0.05; **p < 0.01; ***p < 0.001.
Fig.4
Fig.4. Spatial transcriptomics reveal a CD8+ T cell-macrophage-epithelial progenitor niche that drives dysplastic lung repair.
a. Representative H&E images of aged influenza-infected mice (60dpi) treated with control IgG Ab or αCD8 that were mounted on the 10X Visium slide. b. Visualization of CD8+ T cells, Krt5+ and Krt8hi transitional cells, and alveolar epithelial cells based on gene signatures. c. Unbiased GSEA analysis of signaling pathways enriched in Krt5+ and Krt8hi-rich areas compared to healthy alveolar epithelium. d. Boxplots comparing gene expression signature of ADI/DATP/PATS and e. aberrant basaloid cells in Krt5+ and Krt8hi-rich areas and healthy alveolar epithelium. f. Gene expression signatures of various immune and epithelial cell types as well as signaling pathways in Krt5+ and Krt8hi-rich areas and healthy alveolar epithelium. g. Heatmap of the physical distribution of monocyte-derived macrophages (MDM), alveolar macrophages (AM), Krt5+ and Krt8hi areas (Krt), and healthy alveolar epithelium (AE) in aged influenza-infected (60dpi) mouse lungs. h. Unbiased analysis of the distribution of CX3CR1+ macrophages in an aged influenza-infected (60dpi) mouse lung section. i. Quantification of CX3CR1+ cells within Krt8−/lo and Krt8hi fields in aged influenza-infected (60dpi) lungs (n=5). j. Representative immunofluorescence images of aged influenza-infected (60dpi) lungs treated with control IgG Ab or αCD8, staining monocyte-derived macrophages (CX3CR1) and epithelial progenitors (Krt5 and Krt8). k. Quantification of CX3CR1+ macrophages in aged influenza-infected (60dpi) lungs treated with control IgG Ab or αCD8 (n=4). l. Quantification of the proportion of spots expressing the gene signature of monocyte-derived macrophages in human control and PASC-PF lungs. m. Quantification of the proportion of spots expressing the gene signature of monocyte-derived macrophages in Agerhi and Krt8hi areas within human PASC-PF lungs. n. Representative immunofluorescence images of human PASC-PF lungs staining macrophages (CD68) and epithelial progenitors (Krt5 and Krt8). o. Quantification of CD68+ macrophages in human control and PASC-PF lungs (n=11 control; 7 PASC-PF). p. Unbiased analysis of the distribution of CD68+ macrophages in a human PASC-PF lung using QuPath. q. Quantification of CD68+ macrophages within Krt8−/lo and Krt8hi fields in human PASC-PF lungs (n=6). Data are expressed as mean ± SEM. Statistical analyses were conducted using a two-tailed unpaired t-test (k,o,q). *p < 0.05; **p < 0.01.
Fig.5
Fig.5. CD8+ T cells promote macrophage-mediated IL-1β release via IFN-γ and TNF.
a. Quantification of the proportion of spots expressing the gene signature characterizing IL-1R signaling and inflammasome activity in Agerhi and Krt8hi areas within human PASC-PF lungs. b. Quantification of the proportion of spots expressing the gene signature characterizing IL-1R signaling and inflammasome activity within healthy (AE) and dysplastic (Krt) areas of aged influenza-infected (60dpi) mouse lungs. c. Quantification of proIL-1β+ cells in aged influenza-infected mice (42dpi) via flow cytometry. d. Assessment of caspase-1 activity in the lungs of aged influenza-infected mice (42dpi) after treatment with control IgG Ab or αCD8 by FLICA. e. Quantification of TNF+ and f. IFN-γ+ CD8+ T cells in human control and PASC-PF lungs. g. Assessment of caspase-1 activity in the lungs of aged influenza-infected mice (42dpi) after treatment with control IgG Ab or αIFN-γ+αTNF by FLICA. h. Schematic of the ex vivo macrophage and CD8+ T cell coculture system. i. Assessment of caspase-1 activity following coculture by FLICA. j. Evaluation of IL-1β release into supernatant following coculture by ELISA. k. Evaluation of IL-1β release into supernatant following in vitro IFN-γ and TNF blockade in the coculture system. l. Evaluation of IL-1β levels in BAL fluid of aged influenza-infected mice (42dpi) after treatment with control IgG Ab or neutralizing αIFN-γ+αTNF. m. Evaluation of IL-1β levels in BAL fluid of aged influenza-infected mice (42dpi) after treatment with control IgG Ab or αCD8. n. Experimental design for 2D culture of primary murine AT2 cells for 3 days without/with conditioned media from macrophages, macrophages + CD8+ T cells, macrophages + CD8+ T cells + αIL-1β, and rIL-1β (positive control). o. Gene expression of AT1 cell markers 3 days post AT2 cell culture following exposure to conditioned media. p. Gene expression of transitional cell markers 3 days post AT2 cell culture following exposure to conditioned media. Data are expressed as mean ± SEM. Statistical analyses were conducted using a two-tailed unpaired t-test (d-g, i-m), a two-way ANOVA (c), and a one-way ANOVA (o,p). *p < 0.05; **p < 0.01; *** p < 0.001; ****p < 0.0001.
Fig.6
Fig.6. Therapeutic neutralization of IFN-γ and TNF, or IL-1β activity promotes alveolar regeneration and restores lung function.
a. Experimental design for in vivo IFN-γ + TNF neutralization post influenza infection. b. Representative H&E and MT images of aged C57BL/6 lungs post influenza infection (42pi) treated with αIFN-γ + αTNF neutralizing Ab or control IgG Ab. c. Representative immunofluorescence images staining AT1 (PDPN+), AT2 (proSP-C+) and epithelial progenitors (Krt5+ and Krt8hi) in aged influenza-infected mice (42dpi) treated with αIFN-γ + αTNF neutralizing Ab or control IgG Ab. d. Quantification of Krt8hi and Krt5+ area and e. AT1 (PDPN+) and AT2 (proSP-C+) cells in aged influenza-infected mice treated with αIFN-γ + αTNF neutralizing Ab or control IgG Ab (n= 3–6 IgG, 4–8 αIFN-γ + αTNF). f. Evaluation of static compliance (Cst), resistance of the respiratory system (Rrs), and tissue elastance (H) in aged influenza-infected mice treated with αIFN-γ + αTNF neutralizing Ab or control IgG Ab (n= 8 IgG, 10 αIFN-γ + αTNF). g. Experimental design for in vivo IL-1β blockade post influenza infection. h. Representative H&E and MT images of aged C57BL/6 lungs post influenza infection (42pi) treated with αIL-1β or control IgG Ab. i. Representative immunofluorescence images staining epithelial progenitors (Krt5+ and Krt8hi) and k. AT1 (PDPN+), AT2 (proSP-C+) in aged C57BL/6 mouse lungs post influenza infection (42dpi) treated with αIL-1β or control IgG Ab. j. Quantification of Krt8hi and Krt5+ areas, and l. AT1 (PDPN+) and AT2 (proSP-C+) cells in aged influenza-infected lung sections treated with αIL-1β or control IgG Ab (n= 9 IgG, 10 αIL-1β). m. Evaluation of static compliance (Cst), resistance of the respiratory system (Rrs), and tissue elastance (H) in aged influenza-infected lung sections treated with αIL-1β neutralizing antibody or control IgG antibody (n= 9 IgG, 10 αIL-1β). n. Evaluation of IL-1β levels in plasma of COVID-19 convalescents with or without abnormal lung function. Data are expressed as mean ± SEM. Statistical analyses were conducted using a two-tailed unpaired t-test (d-f, j, l-n). *p < 0.05; **p < 0.01.

Similar articles

Cited by

References

    1. Nalbandian A, Sehgal K, Gupta A, Madhavan MV, McGroder C, Stevens JS, et al. Post-acute COVID-19 syndrome. Nature Medicine. 2021;27(4):601–15. - PMC - PubMed
    1. Al-Aly Z, Xie Y, Bowe B. High-dimensional characterization of post-acute sequelae of COVID-19. Nature. 2021;594(7862):259–64. - PubMed
    1. Littlefield KM, Watson RO, Schneider JM, Neff CP, Yamada E, Zhang M, et al. SARS-CoV-2-specific T cells associate with inflammation and reduced lung function in pulmonary post-acute sequalae of SARS-CoV-2. PLOS Pathogens. 2022;18(5):e1010359. - PMC - PubMed
    1. Bowe B, Xie Y, Al-Aly Z. Postacute sequelae of COVID-19 at 2 years. Nature Medicine. 2023. - PMC - PubMed
    1. Jyothula SSK, Peters A, Liang Y, Bi W, Shivshankar P, Yau S, et al. Fulminant lung fibrosis in non-resolvable COVID-19 requiring transplantation. eBioMedicine. 2022;86. - PMC - PubMed

Publication types