[Preprint]. 2024 Jun 10:2023.09.12.557193.
doi: 10.1101/2023.09.12.557193.

Functional connectome through the human life span

Lianglong Sun  1   2   3 Tengda Zhao  1   2   3 Xinyuan Liang  1   2   3 Mingrui Xia  1   2   3 Qiongling Li  1   2   3 Xuhong Liao  4 Gaolang Gong  1   2   3   5 Qian Wang  1   2   3 Chenxuan Pang  1   2   3 Qian Yu  1   2   3 Yanchao Bi  1   2   3   5 Pindong Chen  6 Rui Chen  1 Yuan Chen  7 Taolin Chen  8 Jingliang Cheng  7 Yuqi Cheng  9 Zaixu Cui  5 Zhengjia Dai  1   2   3 Yao Deng  1 Yuyin Ding  1 Qi Dong  1 Dingna Duan  1   2   3 Jia-Hong Gao  10   11   12 Qiyong Gong  8   13 Ying Han  14 Zaizhu Han  1   3 Chu-Chung Huang  15 Ruiwang Huang  1   3 Ran Huo  16 Lingjiang Li  17   18 Ching-Po Lin  19   20   21 Qixiang Lin  1   2   3 Bangshan Liu  17   18 Chao Liu  1   3 Ningyu Liu  1 Ying Liu  16 Yong Liu  22 Jing Lu  1 Leilei Ma  1 Weiwei Men  10   11 Shaozheng Qin  1   2   3   5 Jiang Qiu  23   24 Shijun Qiu  25 Tianmei Si  26 Shuping Tan  27 Yanqing Tang  28 Sha Tao  1 Dawei Wang  29 Fei Wang  28 Jiali Wang  1 Pan Wang  30 Xiaoqin Wang  23   24 Yanpei Wang  1 Dongtao Wei  23   24 Yankun Wu  26 Peng Xie  31   32 Xiufeng Xu  9 Yuehua Xu  1   2   3 Zhilei Xu  1   2   3 Liyuan Yang  1   2   3 Huishu Yuan  16 Zilong Zeng  1   2   3 Haibo Zhang  1 Xi Zhang  33 Gai Zhao  1 Yanting Zheng  25 Suyu Zhong  22 Alzheimer’s Disease Neuroimaging InitiativeCam-CANDeveloping Human Connectome ProjectDIDA-MDD Working GroupMCADINSPNYong He  1   2   3   5
Affiliations

Functional connectome through the human life span

Lianglong Sun et al. bioRxiv. .

Abstract

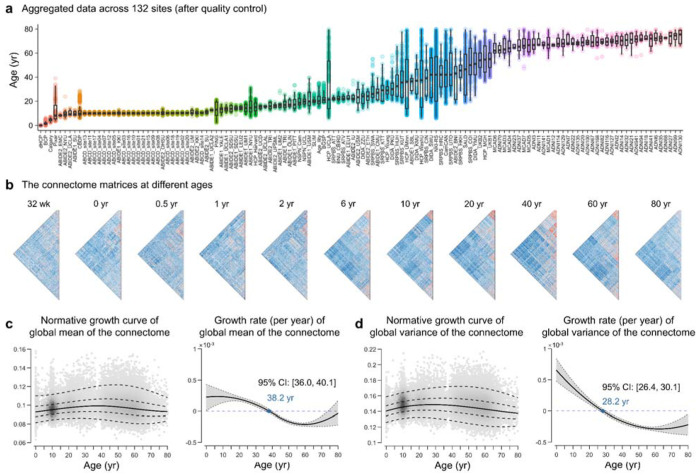
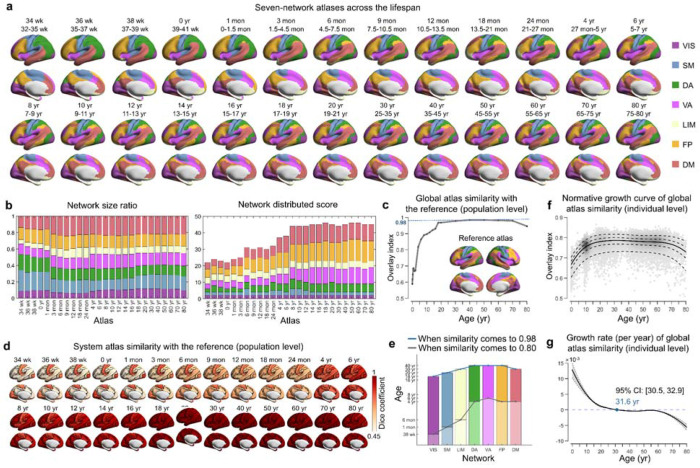
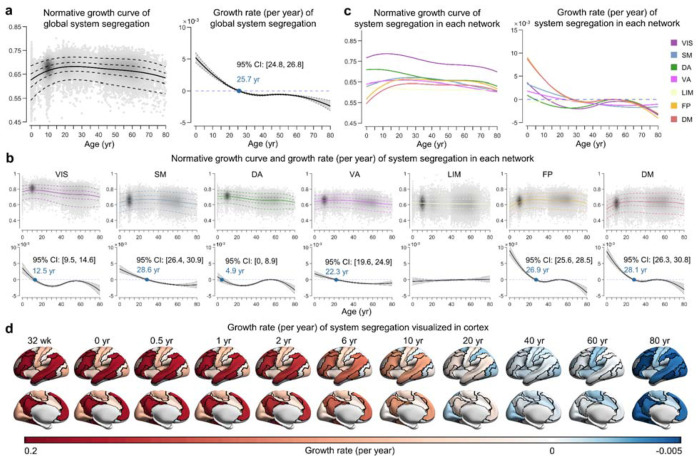
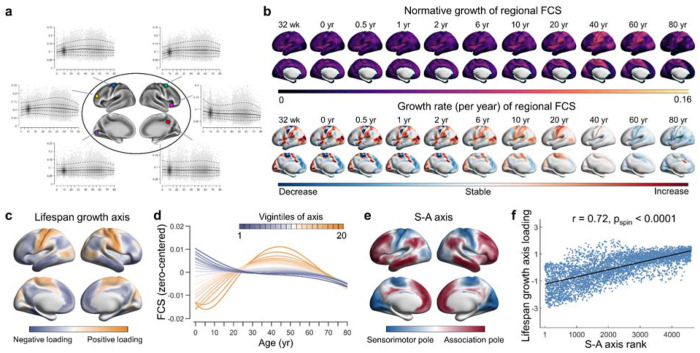
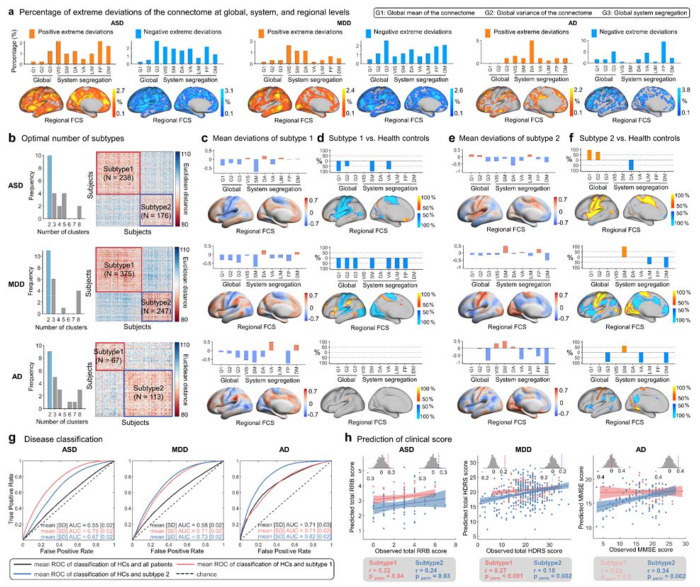
The lifespan growth of the functional connectome remains unknown. Here, we assemble task-free functional and structural magnetic resonance imaging data from 33,250 individuals aged 32 postmenstrual weeks to 80 years from 132 global sites. We report critical inflection points in the nonlinear growth curves of the global mean and variance of the connectome, peaking in the late fourth and late third decades of life, respectively. After constructing a fine-grained, lifespan-wide suite of system-level brain atlases, we show distinct maturation timelines for functional segregation within different systems. Lifespan growth of regional connectivity is organized along a primary-to-association cortical axis. These connectome-based normative models reveal substantial individual heterogeneities in functional brain networks in patients with autism spectrum disorder, major depressive disorder, and Alzheimer's disease. These findings elucidate the lifespan evolution of the functional connectome and can serve as a normative reference for quantifying individual variation in development, aging, and neuropsychiatric disorders.

Keywords: brain atlas; brain chart; connectomics; fMRI.


Conflict of interest statement

Competing interests The authors declare that they have no competing interests.

Figures

Fig. 1 |
Fig. 1 |. Normative growth patterns of the functional connectome at a global level over the lifespan.
a, Quality-controlled MRI data from 132 scanning sites comprising 33,250 healthy participants who collectively spanned the age range from 32 postmenstrual weeks to 80 years. Box plots show the age distribution of participants at each site of data acquisition. The detailed participant demographics and acquisition parameters of each site are provided in Supplementary Tables 1 and 2, respectively. b, The functional connectome matrices of representative participants at different ages. c, Normative growth curve (left panel) and growth rate (right panel) of the global mean of the connectome as estimated by GAMLSS. The median (50th) centile is represented by a solid line, while the 5th, 25th, 75th, and 95th centiles are indicated by dotted lines. The growth rate is characterized by the first derivative of the median centile line. The gray shaded areas represent the 95% confidence interval, which was estimated by bootstrapping 1,000 times (see Methods for details). d, Normative growth curve (left panel) and growth rate (right panel) of global variance of the connectome. wk, week; yr, year.
Fig. 2 |
Fig. 2 |. Population-level and individual-level functional atlases throughout the lifespan.
a, Employing the Gaussian-weighted iterative group atlas generation approach (for details, see Methods and Supplementary Fig. 6a), the lifespan set of seven-network functional atlases from 32 postmenstrual weeks to 80 years was established (26 atlases in total). Only the left hemisphere is displayed here; for the whole-cortical atlases, refer to Supplementary Figs 7 and 8. Labels of each system were mapped onto the HCP fs_LR_32k surface and visualized using BrainNet Viewer . b, Network size ratio and network distribution score of each system in all age-specific group atlases. The network size ratio was calculated as the vertex number of the system divided by the total cortical vertex number. The network distribution score was measured by the number of spatially discontinuous subregions (≥ 5 vertices) in the system. c, Global similarity of each age-specific group atlas with the reference atlas across the lifespan. The degree of global similarity was defined as the number of vertices with the same label in the two atlases divided by the total number of vertices in both atlases. d, System similarity of each age-specific group atlas with the corresponding system in the reference atlas across the lifespan. System similarity was quantified using the Dice coefficient. e, The ages at which the system similarity of each age-specific group atlas reached 0.8 and 0.98. f-g, Normative growth curve and growth rate of global atlas similarity with the reference atlas when using personalized functional atlas for each participant. The gray shaded areas represent the 95% confidence interval, which was estimated by bootstrapping 1,000 times. VIS, visual; SM, somatomotor; DA, dorsal attention; VA, ventral attention; LIM, limbic; FP, frontoparietal; DM, default mode. wk, week; mon, month; yr, year.
Fig. 3 |
Fig. 3 |. Lifespan normative growth patterns of brain system segregation.
a, Normative growth curve and growth rate of global system segregation. The peak occurred in the third decade of life (25.7 years, 95% bootstrap confidence interval 24.8-26.8). The gray shaded areas represent the 95% confidence interval, which was estimated by bootstrapping 1,000 times. b-c, Normative growth curves and growth rate of system segregation for each network. The median (50th) centile is represented by a solid line, while the 5th, 25th, 75th, and 95th centiles are indicated by dotted lines. The key inflection points are marked in blue font. d, Growth rate of system-specific segregation visualized in the cortex, with black lines depicting system boundaries. The values of each system are mapped and visualized on the HCP fs_LR_32k surface. VIS, visual; SM, somatomotor; DA, dorsal attention; VA, ventral attention; LIM, limbic; FP, frontoparietal; DM, default mode. wk, week; yr, year.
Fig. 4 |
Fig. 4 |. Lifespan normative growth patterns of regional functional connectivity strength.
a, Normative growth curves of example vertices from different regions. b, The fitted 50th centiles (top panel) and their growth rates (bottom panel) for all vertices at representative ages. c, The lifespan growth axis of brain functional connectivity, represented by the first principal component from a PCA on regional level FCS curves. d, Based on the lifespan principal axis, all vertices across the brain were equally divided into 20 bins. The zero-centered curves of all vertices within each bin were averaged. The first vigintile (depicted in darkest yellow) represents one pole of the axis, while the twentieth vigintile represents the opposite pole (depicted in darkest blue). The patterns of growth curves vary continuously along the axis, with the greatest differences observed between the two poles. e, The sensorimotor-association (S-A) axis, as formulated by Sydnor et al. , represents a cortical continuum that transitions from primary regions to transmodal areas. f, A strong correlation was observed between the lifespan principal growth axis and the S-A axis (r = 0.72, pspin < 0.0001) (linear association shown with 95% confidence interval). All brain maps were mapped to the HCP fs_LR_32k surface for visualization. FCS, functional connectivity strength; wk, week; yr, year.
Fig. 5 |
Fig. 5 |. Clinical relevance of connectome-based deviation patterns in three brain disorders.
a, Percentage of patients with extreme deviations. Subplots from left to right display the percentage of patients with extreme positive and negative deviations in ASD, MDD, and AD. The bar plot shows the percentage in global mean of the connectome (G1), global variance of the connectome (G2), global system segregation (G3), and system-specific segregation. The brain map shows the percentage of regional-level FCS. Orange-yellow represents extreme positive deviations, while blue represents extreme negative deviations. b, The optimal number of subtypes (left panel) and the similarity matrix of deviation patterns across patients (right panel) for each disorder. c, Mean deviation patterns in patients in subtype 1 of each disorder. d, Individual deviation scores of patients in subtype 1 were compared to the median of healthy controls (HCs). For each metric, the significance of the median differences between the case group and HCs was assessed using the Mann-Whitney U test. P-values were adjusted for multiple comparisons using FDR correction across all possible pairwise tests (p < 0.05). The color bar represents the proportion of tests that passed the significance threshold in 100 comparisons. e, Mean deviations pattern in patients in subtype 2 of each disorder. f, Individual deviation scores of patients in subtype 2 were compared to the median of HCs. g, Disease classification performance based on individual deviation patterns using support vector machine analysis. h, Prediction accuracy of clinical scores based on individual deviation patterns using support vector regression analysis. All brain maps were mapped to the HCP fs_LR_32k surface and are shown in the left hemisphere. For whole-cortex visualizations, refer to Supplementary Figs 16-18. VIS, visual; SM, somatomotor; DA, dorsal attention; VA, ventral attention; LIM, limbic; FP, frontoparietal; DM, default mode. ROC, receiver operating characteristic; AUC, area under the curve; RRB, Repetitive Restrictive Behavior; HDRS, Hamilton Depression Rating Scale; MMSE, Mini-Mental State Examination.

Similar articles

References

    1. Sporns O., Tononi G. & Kotter R. The human connectome: A structural description of the human brain. PLoS Comput Biol 1, e42 (2005). - PMC - PubMed
    1. Smith S.M., et al. Functional connectomics from resting-state fMRI. Trends Cogn Sci 17, 666–682 (2013). - PMC - PubMed
    1. Park H.J. & Friston K. Structural and functional brain networks: from connections to cognition. Science 342, 1238411 (2013). - PubMed
    1. Bassett D.S. & Sporns O. Network neuroscience. Nat Neurosci 20, 353–364 (2017). - PMC - PubMed
    1. Biswal B., Yetkin F.Z., Haughton V.M. & Hyde J.S. Functional connectivity in the motor cortex of resting human brain using echo-planar MRI. Magn Reson Med 34, 537–541 (1995). - PubMed

Publication types