[Preprint]. 2023 Sep 14:2023.09.13.555156.
doi: 10.1101/2023.09.13.555156.

Mapping the Single-cell Differentiation Landscape of Osteosarcoma

Affiliations

Mapping the Single-cell Differentiation Landscape of Osteosarcoma

Danh D Truong et al. bioRxiv. .

Update in

  • Mapping the Single-Cell Differentiation Landscape of Osteosarcoma.
    Truong DD, Weistuch C, Murgas KA, Admane P, King BL, Chauviere Lee J, Lamhamedi-Cherradi SE, Swaminathan J, Daw NC, Gordon N, Gopalakrishnan V, Gorlick RG, Somaiah N, Deasy JO, Mikos AG, Tannenbaum A, Ludwig J. Truong DD, et al. Clin Cancer Res. 2024 Aug 1;30(15):3259-3272. doi: 10.1158/1078-0432.CCR-24-0563. Clin Cancer Res. 2024. PMID: 38775859 Free PMC article.

Abstract

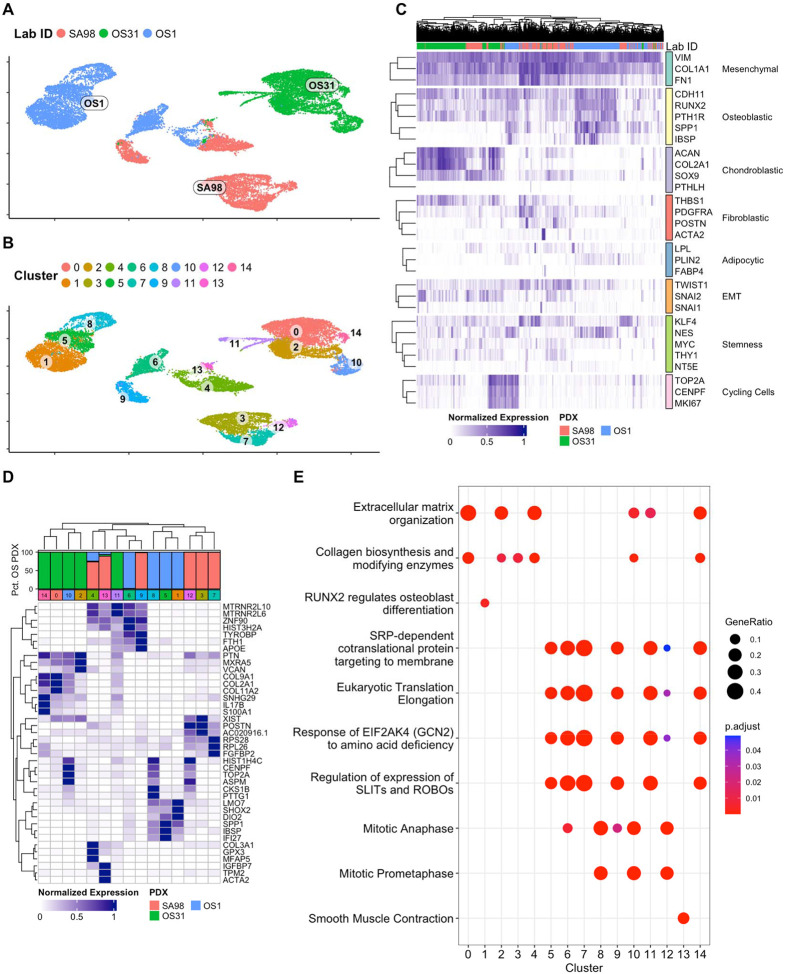
The genetic and intratumoral heterogeneity observed in human osteosarcomas (OS) poses challenges for drug development and the study of cell fate, plasticity, and differentiation, processes linked to tumor grade, cell metastasis, and survival. To pinpoint errors in OS differentiation, we transcriptionally profiled 31,527 cells from a tissue-engineered model that directs MSCs toward adipogenic and osteoblastic fates. Incorporating pre-existing chondrocyte data, we applied trajectory analysis and non-negative matrix factorization (NMF) to generate the first human mesenchymal differentiation atlas. This 'roadmap' served as a reference to delineate the cellular composition of morphologically complex OS tumors and quantify each cell's lineage commitment. Projecting these signatures onto a bulk RNA-seq OS dataset unveiled a correlation between a stem-like transcriptomic phenotype and poorer survival outcomes. Our study takes the critical first step in accurately quantifying OS differentiation and lineage, a prerequisite to better understanding global differentiation bottlenecks that might someday be targeted therapeutically.


Conflict of interest statement

The authors declare no conflicts of interest.

Figures

Figure 1:
Figure 1:. Single-Cell Sequencing Reveals Intratumor Heterogeneity in Patient-Derived Xenograft Models of Osteosarcoma.
A: Single-cell gene expression UMAP of three OS PDX samples. B: Louvain clustering identified 15 clusters of cells in the three PDXs. C: Heatmap of gene expression markers (normalized by maximum across all cells) of all individual cells. Genes were grouped according to specific lineage markers or biological processes. D: Average cluster gene expression (normalized by maximum across all clusters) of the set of top 5 differentially expressed genes in each cluster. E: Dot plot of pathway analysis scores for each cluster.
Figure 2:
Figure 2:. Mesenchymal Differentiation Landscape.
A: Schematic of datasets utilized to construct the Mesenchymal Differentiation Landscape. Osteogenic and adipogenic lineages were experimentally generated over a time course culturing on hydrogels of varying stiffness to influence differentiation trajectory. The chondrogenic lineage was sourced from a publicly available dataset (GSE160625) which measured a time course of chondrogenesis in cultured chondroprogenitor cells treated with a combination of TGF-β3 and C59. These two datasets were integrated to construct a mesenchymal differentiation map containing three lineages. B: UMAP of integrated differentiation landscape with designated clusters along three distinct lineages. Clusters were manually annotated as undifferentiated/dividing (UD), chondroprogenitor (CP), mesenchymal stem cell (MSC), osteogenic (O1-O2), adipogenic (A1-A4), chondrogenic (C1-C3). C: UMAP colored by lineage. D: UMAP colored by experimental time, scaled to the endpoint of each experiment (d21 for osteo, d14 for adipo, d42 for chondro). E: Violin plots of marker genes for early and late stages of each lineage showing distinct temporal patterns.
Figure 3:
Figure 3:. MTL archetypes.
A: Average archetype time courses stratified by cell lineage. Archetypes scores for each cell were computed using normalized nonnegative matrix factorization. B: Table summarizing the dominant lineage and peak time represented by each archetype. C: Heatmap of representative gene-archetype correlations. Four representative genes were selected among the top Pearson correlates of each archetype based on their known biological relevance. The full list of correlates is provided in SI Table 1.
Figure 4:
Figure 4:. Archetype composition of osteosarcoma tumor samples and PDX models.
A: Single-cell archetype score heatmap of 3 PDX models of osteosarcoma, with hierarchical clustering to accentuate cell groups (dendrogram not shown). Row annotation on left indicates lineage of each archetype (same as Fig. 3B). Column annotation indicates pathologist label based on predominant cell type. B: Single-cell archetype score heatmap of 11 human osteosarcoma tumor samples. Similar annotation as panel A. C: Compositions of each PDX based on the maximum archetype score of each cell. D: Compositions of each OS tumor.
Figure 5:
Figure 5:. Stemness is associated with poor survival in osteosarcoma.
A: Bulk archetype heatmap of TARGET-OS. B: Forest plot of the associated Cox regression model with reported hazard ratio (HR) and confidence interval (CI) using the expressed MTL archetypes as regressors. Significance was determined by a multivariable Cox PH test. C: Kaplan-Meier plot stratified by the sample-specific Archetype 3 (differentiation) scores grouped as higher or lower than the median. Significance was determined by a univariable Cox PH test.

References

    1. Jo VY, Doyle LA. Refinements in Sarcoma Classification in the Current 2013 World Health Organization Classification of Tumours of Soft Tissue and Bone. Surg Oncol Clin N Am 2016;25:621–43. - PubMed
    1. Thway K. Pathology of soft tissue sarcomas. Clin Oncol (R Coll Radiol) 2009;21:695–705. - PubMed
    1. Kansara M, Teng MW, Smyth MJ, Thomas DM. Translational biology of osteosarcoma. Nat Rev Cancer 2014;14:722–35. - PubMed
    1. Evola FR, Costarella L, Pavone V, et al. Biomarkers of Osteosarcoma, Chondrosarcoma, and Ewing Sarcoma. Front Pharmacol 2017;8:150. - PMC - PubMed
    1. Cortes-Ciriano I, Lee JJ, Xi R, et al. Comprehensive analysis of chromothripsis in 2,658 human cancers using whole-genome sequencing. Nat Genet 2020;52:331–41. - PMC - PubMed

Publication types