[Preprint]. 2023 Sep 17:2023.09.14.557797.
doi: 10.1101/2023.09.14.557797.

Integration of Patient-Derived Organoids and Organ-on-Chip Systems: Investigating Colorectal Cancer Invasion within the Mechanical and GABAergic Tumor Microenvironment

Affiliations

Integration of Patient-Derived Organoids and Organ-on-Chip Systems: Investigating Colorectal Cancer Invasion within the Mechanical and GABAergic Tumor Microenvironment

Carly Strelez et al. bioRxiv. .

Abstract

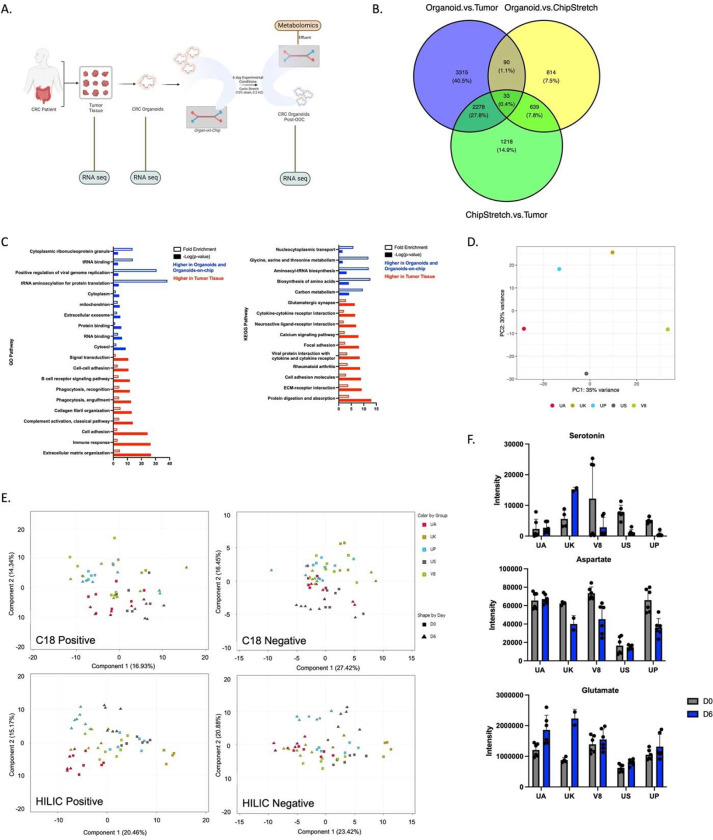
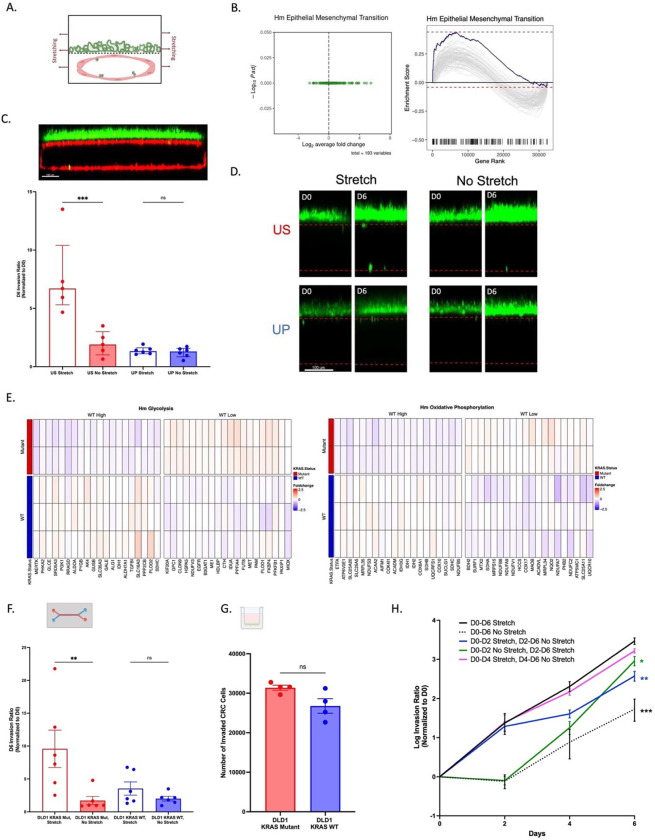
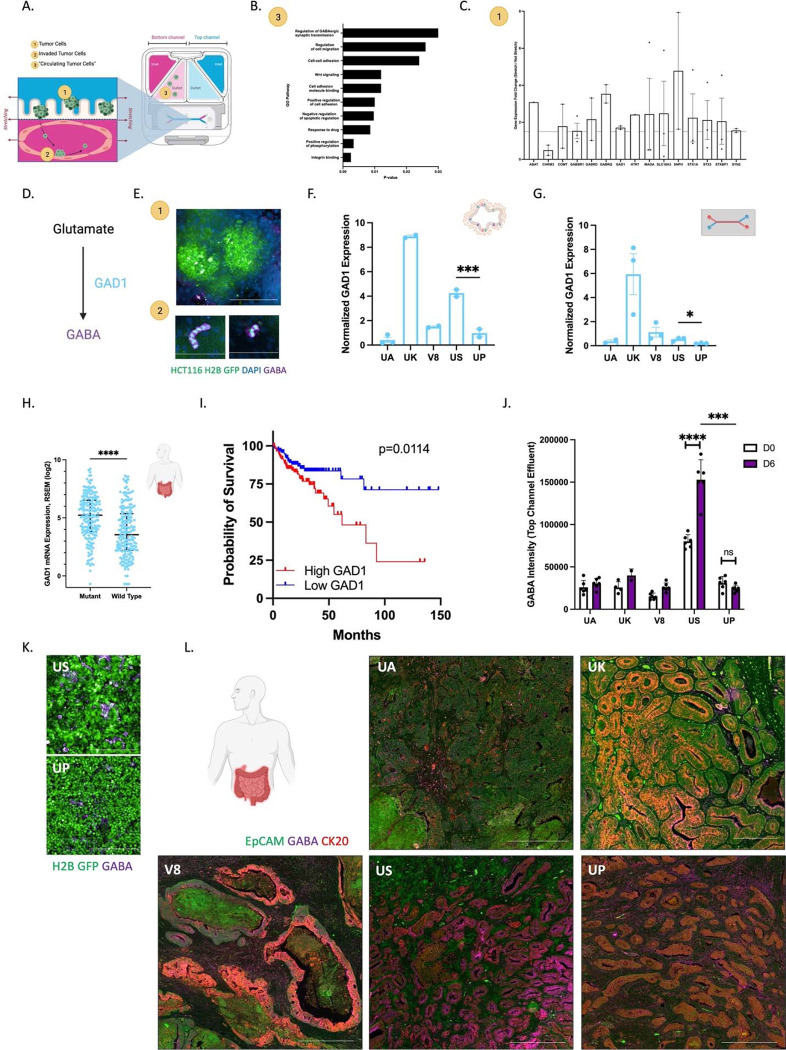
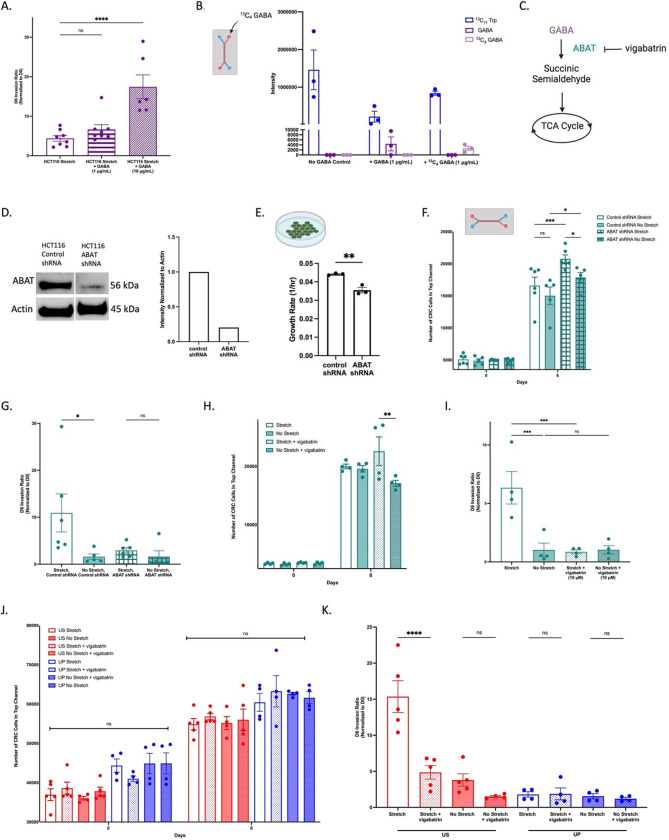
Three-dimensional (3D) in vitro models are essential in cancer research, but they often neglect physical forces. In our study, we combined patient-derived tumor organoids with a microfluidic organ-on-chip system to investigate colorectal cancer (CRC) invasion in the tumor microenvironment (TME). This allowed us to create patient-specific tumor models and assess the impact of physical forces on cancer biology. Our findings showed that the organoid-on-chip models more closely resembled patient tumors at the transcriptional level, surpassing organoids alone. Using 'omics' methods and live-cell imaging, we observed heightened responsiveness of KRAS mutant tumors to TME mechanical forces. These tumors also utilized the γ-aminobutyric acid (GABA) neurotransmitter as an energy source, increasing their invasiveness. This bioengineered model holds promise for advancing our understanding of cancer progression and improving CRC treatments.

Keywords: invasion; neurotransmitters; organoids; organs-on-chips; peristalsis.


Conflict of interest statement

DECLARATION OF INTEREST The authors declare no competing interest.

Figures

Figure 1.
Figure 1.. Patient-derived organoid-on-chip to model colorectal cancer.
(A.) Schematic of organoid-on-chip development. Colorectal cancer (CRC) organoids were derived from patient tumor tissues. Organoids were then seeded into the top channel of the OOC and cultured with fluid flow and rhythmic mechanical strain to mimic peristalsis for 6 days. Schematic was made using BioRender. (B.) Summary of clinical details for each de-identified patient sample, including gender and ethnicity, tumor staging, location, and mutational status. (C.) Representative brightfield images of patient-derived CRC organoids in culture prior to digestion (top panel) and after 6 days on-chip (bottom panel) showing the morphology differences between patients. Scale bars for the pre-digested organoids represent 500 μm and scale bars for the organoids on-chip represent 210 μm. (D.) Representative confocal images of organoid-only cultures (top panel), epithelial top channel (middle panel), and endothelial bottom channel (bottom panel) of organoids-on-chips immunostained for ZO-1 (gold) and VE-Cadherin (red) on day 6. DAPI (blue) labels the cell nuclei. Scale bars in the organoid and organoid-on-chip images represent 50 and 100 μm, respectively. (E.) The apparent permeability (Papp) of the CRC organoid-on-chips cultured in the presence of flow (30 μL/hr) and stretch (10% strain, 0.2 Hz) over the course of the experiment. Papp values were calculated from the concentration of 3kDa Dextran that diffused from the epithelial channel to the endothelial channel. N=6–7 chips per patient. Data are represented as mean ± SEM.
Figure 2.
Figure 2.. OOC reproduces patient heterogeneity and the neurotransmitter influenced TME.
(A.) To characterize the OOC model system, effluent was collected at various time points during the on-chip experiment and mass spectrometry-based metabolomics was performed. In addition, RNA-seq analysis was performed on the tumor tissue, organoids prior to OOC seeding, and at the end of the on-chip experiment to compare across the model systems. Schematic was made using BioRender. (B.) Differential gene expression analysis was carried out to identify genes that are up or down-regulated (p<0.05) in the CRC organoid-on-chip compared to the organoids alone (yellow), CRC organoid-on-chip with fluid flow and rhythmic stretching compared to tumor (green), or the organoid compared to the tumor (blue). The numbers of unique and overlapping genes were identified and represented in a Venn Diagram. N = 5 independent donors and organoid, organoid-on-chip, and tumor tissue were patient-matched. (C.) Genes that were upregulated in organoids and organoid-on-chips as compared to the tumor tissue (blue) and genes that were upregulated in the tumor tissue as compared to organoids and organoid-on-chips (red) were subjected to over-enrichment analysis using DAVID software. (D.) Principal component analysis (PCA) of the RNA-seq of the CRC organoid-on-chips demonstrates the patient heterogeneity represented in the genes. Each dot represents one replicate of stretched, CRC organoid-on-chips and each dot is colored by donor. (E.) Epithelial effluent was collected from the stretched, CRC organoid-on-chips on days 0 and 6 of the experiment and mass spectrometry-based metabolomics was performed. The PCA on the differential metabolites demonstrates the clustering of samples corresponding to the different patients and the different time points. Results are reported for the mode chromatography/ionization mode that was found to be the most robust for the reported analyte. N=6 chips per timepoint per patient; N=4 on D0 and 2 on D6 for UK. (F.) To investigate the role of neurotransmitters in CRC, epithelial effluent was analyzed using a neurotransmitter-specific library. The intensities of several neurotransmitters are shown over time for each patient. N=6 chips per timepoint per patient; n=4 on D0 and 2 on D6 for UK. Individual data points are shown and mean ± SEM are represented.
Figure 3.
Figure 3.. Peristalsis-like physical forces drive invasive capabilities in KRAS mutant tumor cells.
(A.) Schematic showing the investigation of peristalsis-like mechanical forces on tumor cell behavior. Schematic was made using BioRender. (B.) Volcano plot (left) and ridgeplot (right) showing GSEA results of the Epithelial Mesenchymal Transition Hallmark gene set based on differential gene expression analysis of stretched vs not stretched conditions in the KRAS mutant setting. N=2 independent donors. (C.) Regions of the chips were imaged via confocal microscopy and a 3-D reconstruction was produced for quantifying the number of GFP+ tumor cells in the top channel and the number of GFP+ tumor cells that had invaded into the bottom, endothelial compartment, demarcated by RFP HIMEC cells (top image; scale bar represents 100 μm). Invasion of US and UP in stretched and not stretched conditions was measured on day 0 and day 6 of the experiment. An invasion ratio was calculated based on the number of GFP+ cells in the bottom channel compared to the top channel and normalized by the day 0 counts. N=5–6 chips. Individual data are shown, with mean ± SEM represented and analyzed using a one-way ANOVA; ***p<0.001. (D.) Representative images show different invasion behavior for US and UP organoids, as quantified in C. (E.) Glycolysis and oxidative phosphorylation Hallmark gene sets were visualized using fold changes in patients with samples from stretched and not stretched conditions. N=5 independent doners; 2 KRAS mutant, 3 KRAS wildtype. After calculating foldchanges by patient, genes were ranked by p-value derived from a t-test between patients from different mutational status. For a given gene set, the 30 most significant genes from the gene set were selected for inclusion in the heatmap. Patients were ordered first by group and subsequently by average foldchange of the top 30 genes within each group. Foldchanges are thresholded to +/− 2.5 for visualization. (F.) Invasion of DLD1 KRAS Mutant and Wildtype tumor cells in stretched and not stretched on-chip conditions was measured on day 6 of the experiment. An invasion ratio was calculated based on the number of GFP+ cells in the bottom channel compared to the top channel and normalized by the day 0 counts. N=6 chips. Individual data are shown, with mean ± SEM represented and analyzed using a one-way ANOVA; **p<0.01. Schematic from BioRender. (G.) Invasive behavior of DLD1 KRAS Mutant and Wildtype tumor cells was measured 48 hr after cell seeding using traditional transwell invasion assays. N=4. Individual data are shown, with mean ± SEM represented and analyzed using a t-test. Schematic from BioRender. (H.) Stretching was introduced or removed from chips at various timepoints throughout the experiment. Invasion via fluorescence microscopy was measured every 2 days throughout the experiment and the number of GFP+ tumor cells was invaded and normalized by day 0 counts. Data is shown as mean ± SEM. N=4 chips. Invasion data on day 6 was compared between groups via one-way ANOVA; *p<0.05, **p<0.01, ***p<0.001.
Figure 4.
Figure 4.. CRC-Chip with physiological forces produces a GABAergic TME.
(A.) Schematic representing the initial events of the metastatic cascade that can be measured using the CRC-OOC. Tumor cells in the top channel (1) can be visualized and analyzed separately from tumor cells that have invaded and adhered in the endothelial compartment (2). Additionally, tumor cells that are found in the endothelial effluent (3; circulating tumor cells (“CTC-like” cells)) can also be collected and analyzed. (B.) Circulating tumor cells were collected from the endothelial effluent of stretched and not stretched HCT116 CRC-Chips and RNAseq was performed. GO Pathway analysis was performed on a subset of genes with either a 2-fold difference between stretched and not stretched CTCs or an FDR-adjusted p-value <0.1. N=2 biological replicates with 3 pooled chips in each replicate. (C.) Gene expression of neurotransmitter-related genes were measured by a neurotransmitter-specific PCR array. HCT116 tumor cells of stretched and not stretched chips were harvested on day 6 from the top epithelial channel and isolated via FACs. Data is displayed as the gene expression fold change of stretch versus not stretch conditions Expression was normalized to the average of 5 housekeeping genes. Genes that had a 1.5-fold increase or decrease in the stretched condition are displayed. N=3 biological replicates with 3 chips pooled per biological replicate. (D.) Schematic of the production of GABA from glutamate by the enzyme GAD1. In this figure, experiments related to GABA are indicated in purple and experiments related to GAD1 are indicated in light blue. (E.) Representative confocal immunofluorescent images of the epithelial (top; 1) or endothelial (bottom; 2) channel of the CRC-Chips stained for GABA (purple) on day 6. Invaded HCT116 H2B-GFP stain positive for GABA, while HCT116 H2B-GFP tumor cells that are in the top channel stain weakly for GABA. DAPI stains the nuclei of Caco2 C2BBe1 cells in the top channel and endothelial cells in the bottom channel. Scale bars represent 200 μm in the top channel image and 100 μm in the bottom channel images. Top channel images are maximum projections that span a 35 μm Z-height with a 5 μm step size. Bottom channel images are maximum projections that span a 10 μm Z-height with a 5 μm step size. (F.) RNAseq analysis was performed on CRC organoids and normalized GAD1 expression is shown. N=5 independent donors with 2–3 replicates each. Individual data points are shown and mean ± SEM is displayed. Analysis between US and UP data was performed using an unpaired t-test; ***p<0.001 (G.) CRC organoids were isolated from stretched chips and qPCR analysis of GAD1 gene expression was performed. N=5 independent doners with 3 replicates each. Individual data points are shown and mean ± SEM is displayed. Analysis between US and UP data was performed using an unpaired t-test p<0.05. (H.) GAD1 mRNA expression from TCGA in KRAS, NRAS, or BRAF mutant primary colon cancer tumors. N=196 patients with KRAS, NRAS, or BRAF mutant tumors; N=201 patients with KRAS, NRAS, or BRAF wildtype tumors. Individual data points are shown and median with interquartile range is represented. Data was analyzed with an unpaired t-test; ****p<0.0001. (I.) Kaplan-Meier curve with univariate analysis of the survival of patients with KRAS, NRAS, or BRAF mutated CRC tumors based on high versus low expression of GAD1 (defined as above or below the median GAD1 mRNA expression z-score of 0.3). Data was extracted from the TCGA. N=254 patients. Data was analyzed using a log-rank (Mantel-Cox test). (J.) Effluent from the epithelial channel of the patient-derived organoids was collected on day 0 (D0) and day 6 (D6). GABA intensity was analyzed from extracted metabolites N=6 chips per timepoint per patient; n=4 on D0 and 2 on D6 for UK. Data was analyzed using a two-way ANOVA; ***p<0.001; ****p<0.0001. (K.) US-H2B-GFP (top) and UP-H2B-GFP (bottom) stretched tumor-chips were stained for GABA (purple). Scale bars represent 200 μm. L. Representative 10x immunofluorescence images of the 5 tumors stained for EpCAM (green), CK20 (red), and GABA (purple). Scale bars represent 500 μm and 200 μm for UK. All schematics were made in or are from BioRender.
Figure 5.
Figure 5.. Inhibiting GABA catabolism reduces peristalsis-mediated invasion.
(A.) Invasion of HCT116 tumor-chips in the presence or absence of exogenous GABA (flowed through the epithelial channel) was measured on day 6 (D6) of the experiment and normalized to day 0 (D0) invasion. N=6 chips. Individual data are shown, with mean ± SEM represented and analyzed using a one-way ANOVA; ****p<0.0001. (B.) Intracellular [13C4]GABA or unlabeled GABA was measured via mass spectrometry-based metabolomics in the HCT116 tumor-chips after the addition of exogenous GABA for six days. N=3 chips. (C.) Schematic of GABA catabolism by ABAT, subsequent entry into the TCA cycle, and inhibition of ABAT activity by vigabatrin. In this figure, experiments related to GABA are indicated as purple, and experiments related to ABAT are indicated as teal. (D.) Western blot analysis of ABAT in shRNA control or ABAT shRNA HCT116 tumor cells. Cropped western blot (left) and quantification (right) confirm knockdown of ABAT. (E.) Growth rate of ABAT-knockdown or control HCT116 tumor cells when grown in traditional cell culture methods. N=3. Individual data are shown and mean ± SEM are represented. Data was analyzed using a t-test; **p<0.01. (F.) Numbers of ABAT-knockdown or control HCT116 tumor cells in the top channel on-chip as measured via fluorescence microscopy and quantified on day 0 (D0) and day 6 (D6). N=5–6 chips. Individual data are shown and mean ± SEM are represented. Data was analyzed using a two-way ANOVA; *p<0.05;***p<0.001. (G.) Invasion of ABAT knockdown (KD) or control shRNA HCT116 tumor-chips in the presence or absence of stretching was measured on day 6 (D6) of the experiment and normalized to day 0 (D0) invasion. N=5–6 chips. Individual data points are shown and mean ± SEM are represented. Data was analyzed using a one-way ANOVA; *p<0.05. (H.) Numbers of HCT116 tumor cells in the top channel on-chip in the presence or absence of stretching, with or without vigabatrin was measured via fluorescence microscopy and quantified on day 0 (D0) and day 6 (Day 6). Individual data are shown and mean ± SEM are represented. N=4 chips. Data was analyzed using a two-way ANOVA; **p<0.01. (I.) Invasion of HCT116 tumor-chips in the presence or absence of stretching, with or without vigabatrin was measured on day 6 (D6) of the experiment and normalized to day 0 (D0) invasion. N=4 chips. Individual data points are shown and mean ± SEM are represented. Data was analyzed using a one-way ANOVA; ***p<0.001. (J.) Numbers of US-H2B-GFP (red) or UP-H2B-GFP (blue) tumor cells in the top channel on-chip in the presence or absence of stretching, with or without vigabatrin was measured via fluorescence microscopy and quantified on day 0 (D0) and day 6 (Day 6). N=4–5 chips. Individual data are shown and mean ± SEM are represented. Data was analyzed using a two-way ANOVA; ns=p>0.05. (K.) Invasion of US-H2B-GFP or UP-H2B-GFP organoid-tumor chips in the presence or absence of stretching, with or without vigabatrin was measured on day 6 (D6) of the experiment and normalized to day 0 (D0) invasion. N=4–5 chips. Individual data are shown and mean ± SEM are represented. Data was analyzed using a one-way ANOVA; **p<0.01. All schematics were made in or are from BioRender.

Similar articles

References

    1. Berger M.F. & Mardis E.R. The emerging clinical relevance of genomics in cancer medicine. Nat Rev Clin Oncol 15, 353–365 (2018). - PMC - PubMed
    1. Stratton M.R., Campbell P.J. & Futreal P.A. The cancer genome. Nature 458, 719–724 (2009). - PMC - PubMed
    1. Park S.E., Georgescu A. & Huh D. Organoids-on-a-chip. Science 364, 960–965 (2019). - PMC - PubMed
    1. Wakefield L., Agarwal S. & Tanner K. Preclinical models for drug discovery for metastatic disease. Cell 186, 1792–1813 (2023). - PubMed
    1. Wang H. et al. 3D cell culture models: Drug pharmacokinetics, safety assessment, and regulatory consideration. Clin Transl Sci 14, 1659–1680 (2021). - PMC - PubMed

Publication types