[Preprint]. 2023 Sep 16:2023.09.16.558044.
doi: 10.1101/2023.09.16.558044.

U6 snRNA m6A modification is required for accurate and efficient cis- and trans-splicing of C. elegans mRNAs

Affiliations

U6 snRNA m6A modification is required for accurate and efficient cis- and trans-splicing of C. elegans mRNAs

Aykut Shen et al. bioRxiv. .

Update in

Abstract

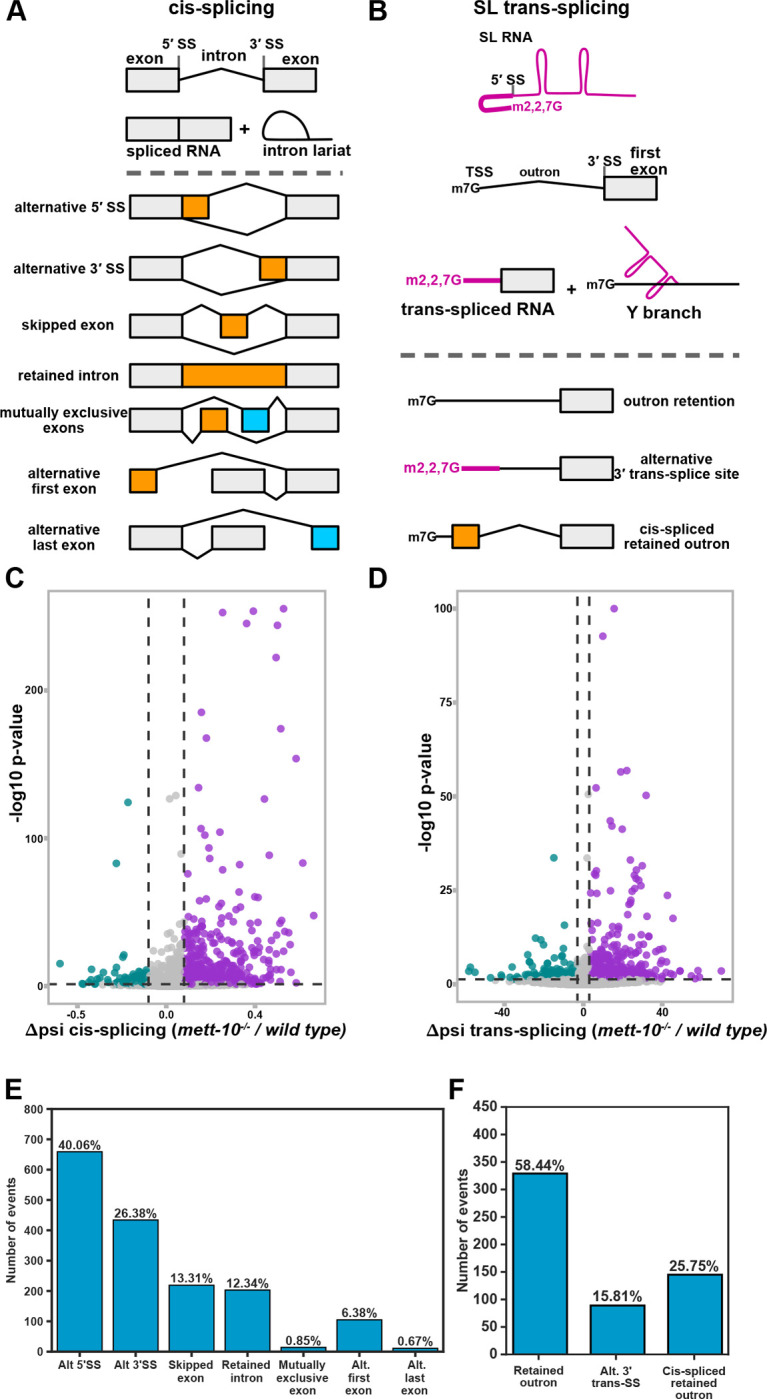
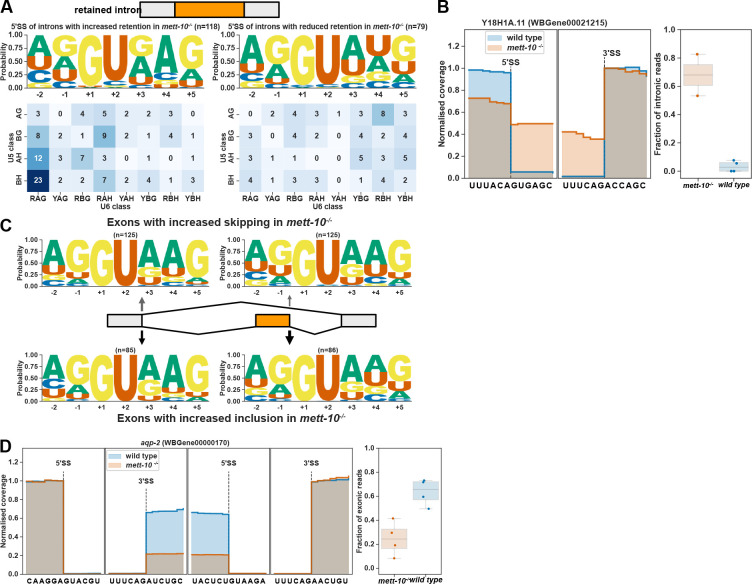
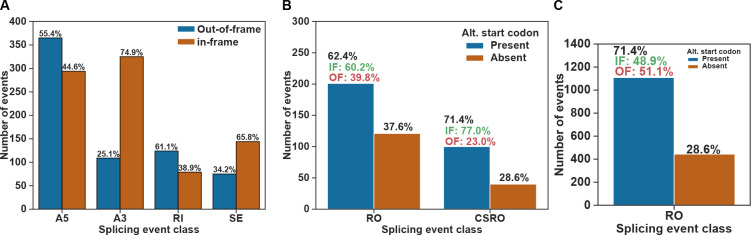
pre-mRNA splicing is a critical feature of eukaryotic gene expression. Many eukaryotes use cis-splicing to remove intronic sequences from pre-mRNAs. In addition to cis-splicing, many organisms use trans-splicing to replace the 5' ends of mRNAs with a non-coding spliced-leader RNA. Both cis- and trans-splicing rely on accurately recognising splice site sequences by spliceosomal U snRNAs and associated proteins. Spliceosomal snRNAs carry multiple RNA modifications with the potential to affect different stages of pre-mRNA splicing. Here, we show that m6A modification of U6 snRNA A43 by the RNA methyltransferase METT-10 is required for accurate and efficient cis- and trans-splicing of C. elegans pre-mRNAs. The absence of U6 snRNA m6A modification primarily leads to alternative splicing at 5' splice sites. Furthermore, weaker 5' splice site recognition by the unmodified U6 snRNA A43 affects splicing at 3' splice sites. U6 snRNA m6A43 and the splicing factor SNRNP27K function to recognise an overlapping set of 5' splice sites with an adenosine at +4 position. Finally, we show that U6 snRNA m6A43 is required for efficient SL trans-splicing at weak 3' trans-splice sites. We conclude that the U6 snRNA m6A modification is important for accurate and efficient cis- and trans-splicing in C. elegans.

Keywords: C. elegans; METT-10; RNA splicing; SL trans-splicing; SNRNP27K; SNRP-27; U6 snRNA; m6A modification.


Figures

Figure 1.
Figure 1.
The absence of mett-10 causes cis- and trans-splicing defects. (A) Overview of pre-mRNA cis-splicing and cis-splicing defects detectable by RNA sequencing. (B) Overview of pre-mRNA trans-splicing and trans-splicing defects detectable by RNA sequencing. (C) Volcano plot of all transcripts tested for cis-splicing changes between mett-10−/− and wild-type animals. Transcripts that show increased splicing in mett-10−/− (p ≤ 0.05 and ΔPSI ≤ −0.1) at a given splice site are coloured green, and transcripts that show reduced splicing in mett-10−/− (p ≤ 0.05 and ΔPSI ≥ 0.1) at a given splice site are coloured purple. (D) Volcano plot of all transcripts tested for trans-splicing changes between mett-10−/− and wild-type animals. Transcripts that show increased splicing in mett-10−/− (p ≤ 0.05 and ΔPSI ≤ −3) at a given splice site are coloured green, and transcripts that show reduced splicing in mett-10−/− (p ≤ 0.05 and ΔPSI ≥ 3) at a given splice site are coloured purple. −log10 p-value of 1 gene has been lowered to fit into the graph. (E) Classification of all significant (FDR < 0.05) cis-splicing defects in mett-10−/− animals. (F) Classification of all significant (p-value < 0.05) trans-splicing defects in mett-10−/− animals.
Figure 2.
Figure 2.
mett-10 sensitive 5′ cis-splice sites have +4A. (A) The sequence motif and frequency analysis of mett-10 sensitive 5′SSs (−2 to +5) and the alternative 5′SSs are used more often in mett-10−/−. The sequence motif shows the probability of bases at each position around the 5′SS. U5 and U6 snRNA binding sequences are shown under the sequence motif logo. The frequency table is coloured based on the U5 snRNA interacting sequence frequency on the y-axis (−2 and −1) and U6 snRNA interacting sequence frequency on the x-axis (+3,+4 and +5). (B) Normalised coverage of RNA-Seq reads for the pch-2 intron 1 boundary. Alt. 5′SS 1 is used more often in wild-type animals and alt. 5′SS 2 is used more often in mett-10−/−. Barplot shows the fraction of reads supporting splicing at the Alt. 5′SS 2 over total reads in mett-10−/− and wild-type animals. (C) Heatmap showing the correlation between splice site usage in mett-10−/− (y-axis) and the specific base at position +4 of the 5′SS. (D) Effect size plot for the 5′SS positions −2 to +5. Negative values indicate bases at the specific position are associated with significantly more alternative splicing and positive values indicate bases at the specific position are associated with significantly less alternative splicing events. The size of the circles correspond to the frequency of the base at a given position across all 5′SSs in the genome. (E) Histogram for the distance between alternative splice site pairs. The Y-axis shows the number of alternative splice site pairs, and the x-axis shows the distance between the pairs, with negative values indicating the alternative splice site moves upstream and positive values indicating the alternative splice site moves downstream of the original splice site.
Figure 3.
Figure 3.
mett-10−/− animals have increased intron retention and exon-skipping. (A) 5′SS motif analysis of introns with increased (left) and decreased (right) retention in mett-10−/−. The frequency of sequences corresponding to U5 and U6 binding are shown in the heatmap. (B) Normalised RNA-Seq coverage of Y18H1A.11 intron 3 in mett-10−/− and wild-type animals. The bar plot shows the fraction of intronic reads over the retained intron. (C) 5′SS motif analysis of exons with increased skipping (upper panel) and increased retention (bottom panel) in mett-10−/− animals. Sequence motifs are shown for the upstream exon 5′SSs (grey) and the retained/skipped exon (orange). (D) Normalised RNA-Seq coverage of aqp-2 exon 5 in mett-10−/− and wild-type animals. Bar plots show the fraction of exonic reads over the skipped exon.
Figure 4.
Figure 4.
The absence of mett-10 affects 3′SS usage. (A) 5′ and 3′SS motif analysis of transcripts that are mett-10 sensitive (upper panel) and the corresponding alternative 3′SSs whose usage increases in mett-10−/− (bottom panel). (B) Histogram for the distance between alternative splice site pairs. The Y-axis shows the number of alternative splice site pairs, and the X-axis shows the distance between the pairs, with negative values indicating the alternative splice site moves upstream and positive values indicating the alternative splice site moves downstream of the original splice site. (C) Normalised RNA-Seq coverage of B0001.7 intron 6. The canonical splice position is Alt. 3′SS 1. In wild-type animals, weak upstream splice site Alt. 3′SS 2 is also utilised. The bar plot shows the fraction of reads covering the exon sequence to the right of the canonical splice site. (D) Heat map (left) and bar plots (right) showing the frequency of 5′SS usage at specific splice sites in wild-type and mett-10−/− animals. (E) Heat map (left) and bar plots (right) showing the frequency of 3′SS usage at specific splice sites in wild-type and mett-10−/− animals.
Figure 5.
Figure 5.
mett-10 is required for efficient trans-splicing. (A) The trans-splicing defects rescued by the germline expression of mett-10 are shown in orange over the total SL trans-splicing defects observed in mett-10−/− animals as in Figure 1F (blue). (B - D) Examples for the outron retention (B), alternative 3′ trans-splice site usage (C) and cis-spliced outron retention (D) events showing the normalised RNA-Seq read coverage (left) and fraction of reads covering the outron sequence (right) in mett-10−/− and wild-type animals. Due to the sequence similarity between the SL1 RNA and the 3′ trans-splice sites, RNA-Seq read coverage drop does not always align with the actual splice site.
Figure 6.
Figure 6.
mett-10 sensitive 3′ trans-splice sites have weak U2AF binding motifs. (A) 3′ trans-splice site motif of background transcripts that do not show the trans-splicing defect (top panel), transcripts that show the weak trans-splicing defect (middle panel) and transcripts that show the strong trans-splicing defect (bottom panel). (B) Frequency of sequences corresponding to U2AF65 binding (y-axis) and U2AF35 binding (x-axis) alongside the sequence logo of transcripts that do not show trans-splicing defect (left panel) and transcripts that show significant trans-splicing defect (right panel).
Figure 7.
Figure 7.
snrp-27 is required for the recognition of 5′SSs with +4A. (A) Classification of all significant (FDR < 0.05) cis-splicing defects in snrp-27(az26) M141T animals compared to wild-type. (B) Sequence motif (upper panels) and the frequency of U5 and U6 interacting sequences (bottom panels) of the 5′SSs that are either sensitive to snrp-27(az26) (left panels) or used more often in snrp-27(az26) (right panels). (C) Effect size plot for the 5′SS positions −2 to +5. Negative values indicate bases at the specific position are associated with significantly more alternative splicing and positive values indicate bases at the specific position are associated with significantly less alternative splicing events. The size of the circles correspond to the frequency of the base at a given position across all 5′SSs in the genome. (D) Heat map showing the overlap of mett-10 and snrp-27 sensitive 5′SSs. (E) Sequence motif analysis of 3′SSs that are either sensitive to snrp-27(az26) (upper panel) or used more often in snrp-27(az26) (bottom panel). 5′SS motif of sensitive 3′SSs are shown on the left. (F) Histogram showing the distance between alternative 3′SS pairs (x-axis) and the number of 3′SS events (y-axis) (G) Heat-map showing the overlap of mett-10 and snrp-27 sensitive 3′SSs.
Figure 8.
Figure 8.
Alternative splicing events alter the protein coding potential of transcripts. (A) Bar plot showing the percentage of out-of-frame and in-frame changes by each class of cis-splicing events observed in mett-10 mutant animals. (B) Bar plot showing the presence or absence of alternative start codon within the outron retained regions observed in mett-10 mutant animals. The percentage of in-frame and out-of-frame start codons are shown above the blue bars. (C) Presence or absence of alternative start codons within a 120nt window upstream of annotated canonical start codons across C. elegans genes. The percentage of in-frame and out-of-frame start codons is shown above the blue bar.
Figure 9.
Figure 9.
Model for splice site regulation by U6 snRNA m6A43, SNRP-27 and the splice site sequences. (A) U6 snRNA m6A43 and SNRP-27 function together to effectively and accurately recognise 5′SSs with a +4A and +3 position shows specific preference for the presence and absence of U6 snRNA m6A43, SNRP-27 or both. (B) Strong 5′SS interactions at //GURAG sites maintained by U6 snRNA m6A43 or strong U5 interactions can support the usage of weak upstream 3′SSs (upper panel). When 5′SS interactions weaken, only strong 3′SS are used (bottom panel). (C) When U6 snRNA is m6A methylated, strong recognition of the 5′SS on the SL RNA can support the usage of weak 3′ trans-splice sites (upper panel). When U6 snRNA - 5′ trans-splice site interactions weaken, trans-splicing at weak 3′ trans-splice sites fail (bottom panel).

Similar articles

References

    1. Zhuang Y. and Weiner A.M. (1986) A compensatory base change in U1 snRNA suppresses a 5’ splice site mutation. Cell, 46, 827–835. - PubMed
    1. Plaschka C., Lin P.-C., Charenton C. and Nagai K. (2018) Prespliceosome structure provides insights into spliceosome assembly and regulation. Nature, 559, 419–422. - PMC - PubMed
    1. Newman A.J. and Norman C. (1992) U5 snRNA interacts with exon sequences at 5’ and 3’ splice sites. Cell, 68, 743–754. - PubMed
    1. Sontheimer E.J. and Steitz J.A. (1993) The U5 and U6 small nuclear RNAs as active site components of the spliceosome. Science, 262, 1989–1996. - PubMed
    1. Charenton C., Wilkinson M.E. and Nagai K. (2019) Mechanism of 5’ splice site transfer for human spliceosome activation. Science, 364, 362–367. - PMC - PubMed

Publication types