[Preprint]. 2023 Sep 12:2023.09.12.23295440.
doi: 10.1101/2023.09.12.23295440.

Transcriptional Signatures of Hippocampal Tau Pathology in Primary Age-Related Tauopathy and Alzheimer's Disease

Affiliations

Transcriptional Signatures of Hippocampal Tau Pathology in Primary Age-Related Tauopathy and Alzheimer's Disease

Genevieve L Stein-O'Brien et al. medRxiv. .

Update in

Abstract

Background: Tau pathology is common in age-related neurodegenerative diseases. Tau pathology in primary age-related tauopathy (PART) and in Alzheimer's disease (AD) has a similar biochemical structure and anatomic distribution, which is distinct from tau pathology in other diseases. However, the molecular changes associated with intraneuronal tau pathology in PART and AD, and whether these changes are similar in the two diseases, is largely unexplored.

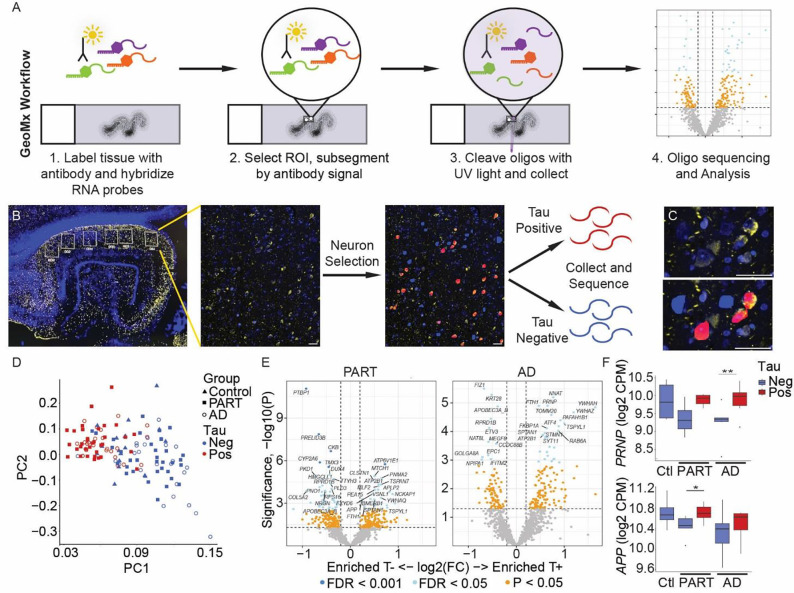
Methods: Using GeoMx spatial transcriptomics, mRNA was quantified in CA1 pyramidal neurons with tau pathology and adjacent neurons without tau pathology in 6 cases of PART and 6 cases of AD, and compared to 4 control cases without pathology. Transcriptional changes were analyzed for differential gene expression and for coordinated patterns of gene expression associated with both disease state and intraneuronal tau pathology.

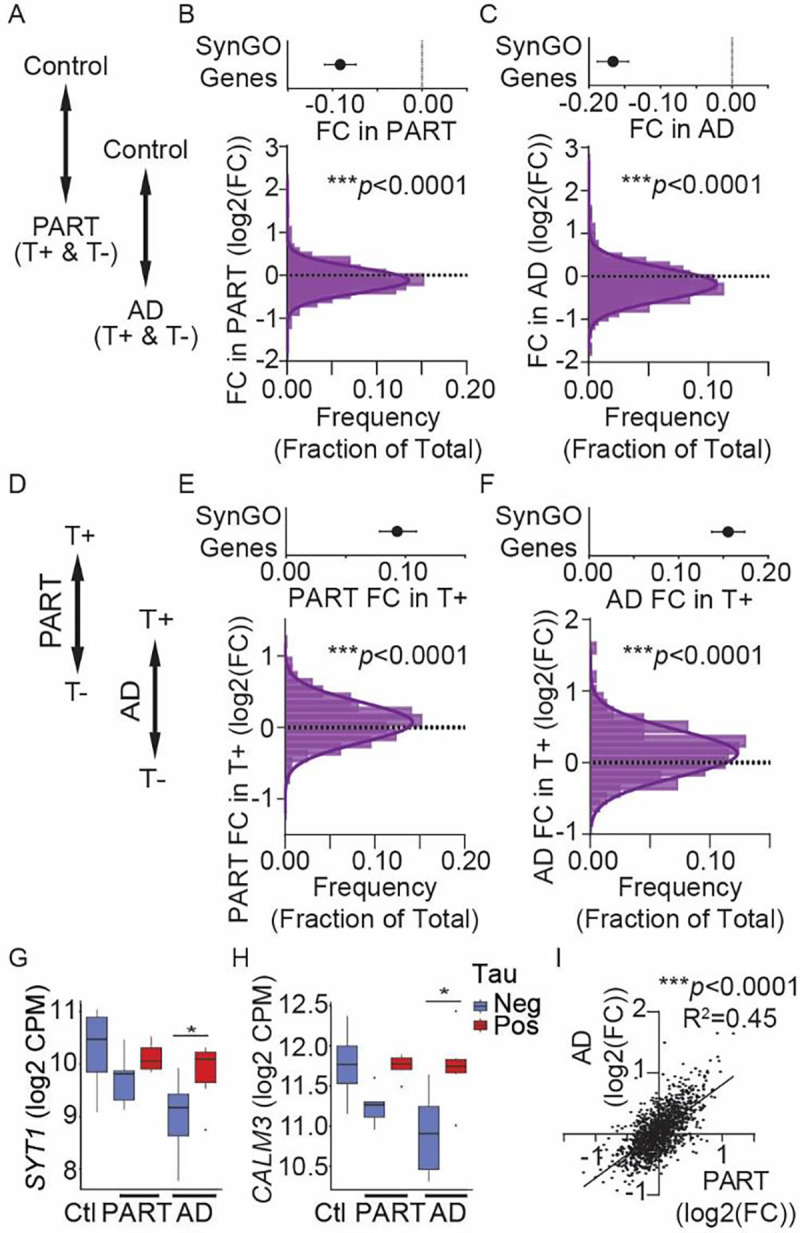
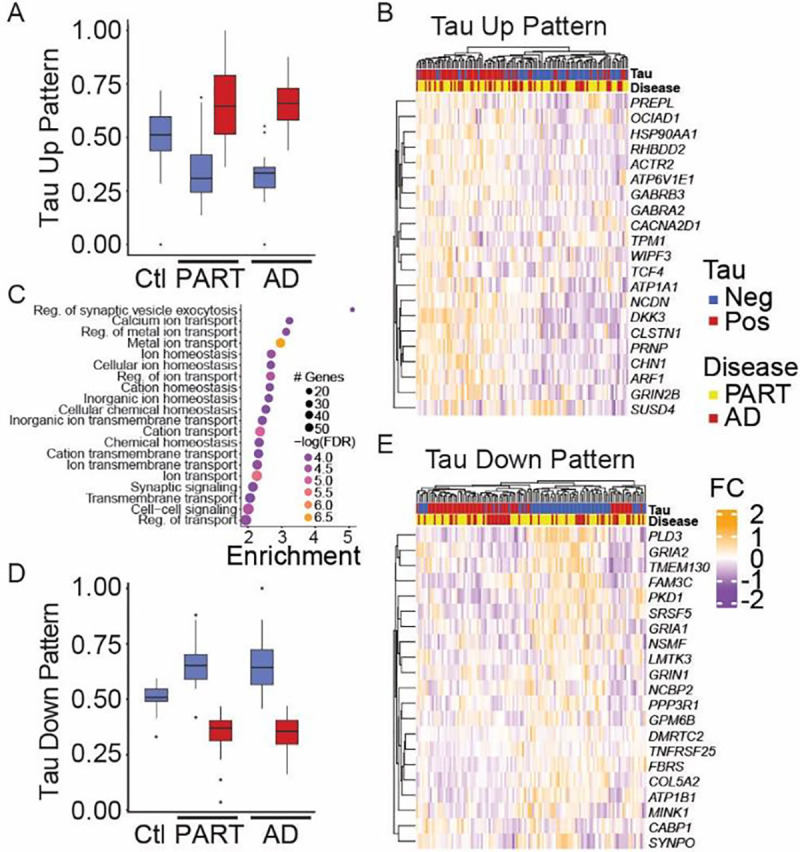
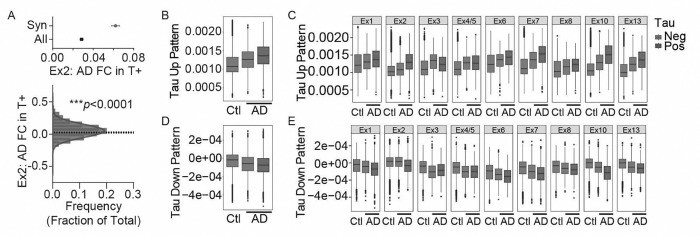
Results: Synaptic gene changes and two novel gene expression signatures associated with intraneuronal tau were identified in PART and AD. Overall, gene expression changes associated with intraneuronal tau pathology were similar in PART and AD. Synaptic gene expression was decreased overall in neurons in AD and PART compared to control cases. However, this decrease was largely driven by neurons lacking tau pathology. Synaptic gene expression was increased in tau-positive neurons compared to tau-negative neurons in disease. Two novel gene expression signatures associated with intraneuronal tau were identified by examining coordinated patterns of gene expression. Genes in the up-regulated expression pattern were enriched in calcium regulation and synaptic function pathways, specifically in synaptic exocytosis. These synaptic gene changes and intraneuronal tau expression signatures were confirmed in a published transcriptional dataset of cortical neurons with tau pathology in AD.

Conclusions: PART and AD show similar transcriptional changes associated with intraneuronal tau pathology in CA1 pyramidal neurons, raising the possibility of a mechanistic relationship between the tau pathology in the two diseases. Intraneuronal tau pathology was also associated with increased expression of genes associated with synaptic function and calcium regulation compared to tau-negative disease neurons. The findings highlight the power of molecular analysis stratified by pathology in neurodegenerative disease and provide novel insight into common molecular pathways associated with intraneuronal tau in PART and AD.


Conflict of interest statement

Competing Interests: The authors have no competing interests to declare.

Figures

Figure 1.
Figure 1.. Transcriptional Changes Associated with Intraneuronal Tau Pathology in PART and AD.
(A) GeoMxWorkflow. First, tissue sections are labeled with antibodies and hybridized with GeoMx mRNA probes. These probes are linked with a unique oligonucleotide barcode via a chemical linker which can be cleaved using ultraviolet light. A region of interest (ROI) is selected on the tissue, then segments are selected within the region of interest by antibody labeling. A 10μm ultraviolet light is used to cleave the barcodes within each selected segment, which are then collected, sequenced, and analyzed. Barcode collection can be done iteratively within an ROI, so multiple segments with differential antibody labeling can be collected from a single ROI. (B) In this study, hippocampal sections were stained for phosphorylated tau to mark tau pathology (yellow, AT8) and counterstained with a marker for nucleic acid (blue, SYTO13). Regions of interest were selected within the CA1 region on the Nanostring GeoMx, then regions were segmented and masked based on neurons with tau pathology (red, tau-positive) or without (blue, tau-negative). Transcript-specific oligonucleotide barcodes were then collected and sequenced from each selected segment. (C) High power view of neurons selected as positive (red) and negative (blue) for tau pathology. (D) Principal component analysis of each segment by disease group and tau status. (E) Differentially expressed genes in tau-positive versus tau-negative neurons in PART and AD. (F) Expression of representative genes previously reported as altered in tau-positive neurons. Significance based on mixed effects linear modeling of differentially expressed genes after false discovery rate correction. AD, Alzheimer’s disease; Ctl, control; CPM, counts per million; FC, fold change; FDR, false discovery rate; Neg, tau pathology negative; Oligo, oligonucleotide; PART, primary age-related tauopathy; PC, principal component; Pos, tau pathology positive; T−, tau pathology negative; T+, tau pathology positive. Scale bars are 50 μm. *FDR<0.05, **FDR<0.01.
Figure 2.
Figure 2.. Synaptic Gene Changes Associated with Intraneuronal Tau Pathology in PART and AD.
All quantified genes were processed in SynGO to identify genes with synaptic annotations. (A) Schematic of group comparison of synaptic gene expression changes in B and C; the control group was compared either to all neurons in PART or to all neurons in AD to mimic effects seen in traditional bulk analysis. (B) Decreased synaptic gene expression in PART versus control shown by mean fold change of SynGO genes (top) with histogram (below). (C) Decreased synaptic gene expression in AD versus control shown by mean fold change of SynGO genes (top) with histogram (below). (below). (D) Schematic of comparison of synaptic gene expression changes in E and F. Tau-positive neurons were compared to tau-negative neurons in PART or AD. (E) Increased synaptic gene expression in tau-positive neurons in PART (E) and AD (F) shown by mean fold change of SynGO genes (top) with histogram (below). (G,H) Representative gene expression changes by disease group and tau status. Significance by mixed effects linear model of differential gene expression after false discovery rate (FDR) correction. *FDR<0.05. (I) Log2 of the fold change in tau positive versus negative for each quantified gene in PART (x-axis) and AD (y-axis) showing a significant correlation (simple linear regression, p<0.0001, R2=0.45). AD, Alzheimer’s disease; Ctl, control; CPM, counts per million; FC, fold change; Neg, tau pathology negative; PART, primary age-related tauopathy; Pos, tau pathology positive; T−, tau pathology negative; T+, tau pathology positive. B,C,E,F – curve generated by Gaussian least squares fit and significance is mean significantly difference from 0 by extra sum of squares F test; dotted line at 0. Error bars are SEM. G,H – Error bars are 95% CI.
Figure 3.
Figure 3.. Coordinated Gene Association in Pattern Set (CoGAPs) Analysis by Intraneuronal Tau Pathology.
CoGAPS analysis was performed on the quantified genes with 2 patterns showing variation by intraneuronal tau pathology. (A) Coordinated gene expression score for Tau Up pattern by disease group and tau pathology and (B) expression heatmap of the top 20 genes in this pattern by tau and disease group selected by score after PatternMarkers analysis. (C) The genes significantly associated with the Tau Up pattern after PatternMarkers analysis were analyzed for enriched GO Biological Processes using ShinyGO [42] and the results are displayed as a dot plot. The size of each dot reflects the number of pattern genes in the process, while the color reflects the p value after false discovery rate correction. (D) Coordinated gene expression score for Tau Down pattern by disease group and tau pathology, and (E) expression heatmap of the top 20 genes in this pattern by tau and disease group selected by score after PatternMarkers analysis. AD, Alzheimer’s disease; Ctl, control; FC, log2 fold change; FDR, false discovery rate corrected p value; Neg, tau pathology negative; PART, primary age-related tauopathy; Pos, tau pathology positive; Reg., regulation. B,D - Error bars are 95% CI.
Figure 4.
Figure 4.. Synaptic and Gene Expression Patterns Associated with Cortical Intraneuronal Tau in Single Cell Dataset.
Publicly available single soma RNA-seq data from cortical neurons in AD [23] was analyzed for synaptic gene expression changes and expression of the Tau Up and Tau Down patterns. Excitatory neuronal grouping was performed as in the published analysis for tau positive and negative neurons. (A) Representative plots of increased synaptic gene expression (SynGO annotated) compared to expression of all quantified genes in excitatory neuron group 2 (Ex2: CUX2-COL5A2) shown by mean fold change of genes with SynGO annotations (top) with associated histogram (below). Curve generated by Gaussian least squares fit and significance is means of synaptic genes and all measured genes are different by extra sum of squares F test; dotted line at mean of all measured genes in Ex2. (B) Increased expression of Tau Up pattern in overall tau-positive excitatory cortical neurons and (C) by excitatory neuronal group. (D) Decreased expression of Tau Down pattern in overall tau-positive excitatory cortical neurons and (E) by excitatory neuronal group. AD, Alzheimer’s disease; All, all quantified genes; Ctl, control; FC, log2 fold change; Neg, tau pathology negative; Pos, tau pathology positive; Syn, synaptic genes; T+, tau-positive. A – Error bars are SEM. B-E - Error bars are 95% CI.

Similar articles

References

    1. Pletnikova O, Kageyama Y, Rudow G, LaClair KD, Albert M, Crain BJ, Tian J, Fowler D, Troncoso JC: The spectrum of preclinical Alzheimer’s disease pathology and its modulation by ApoE genotype. Neurobiol Aging 2018, 71:72–80. - PubMed
    1. Braak H, Thal DR, Ghebremedhin E, Del Tredici K: Stages of the pathologic process in Alzheimer disease: age categories from 1 to 100 years. J Neuropathol Exp Neurol 2011, 70:960–969. - PubMed
    1. Kim D, Kim HS, Choi SM, Kim BC, Lee MC, Lee KH, Lee JH: Primary Age-Related Tauopathy: An Elderly Brain Pathology Frequently Encountered during Autopsy. J Pathol Transl Med 2019, 53:159–163. - PMC - PubMed
    1. Crary JF, Trojanowski JQ, Schneider JA, Abisambra JF, Abner EL, Alafuzoff I, Arnold SE, Attems J, Beach TG, Bigio EH, et al.: Primary age-related tauopathy (PART): a common pathology associated with human aging. Acta Neuropathol 2014, 128:755–766. - PMC - PubMed
    1. Shi Y, Zhang W, Yang Y, Murzin AG, Falcon B, Kotecha A, van Beers M, Tarutani A, Kametani F, Garringer HJ, et al.: Structure-based classification of tauopathies. Nature 2021, 598:359–363. - PMC - PubMed

Publication types