[Preprint]. 2023 Sep 15:2023.06.21.545778.
doi: 10.1101/2023.06.21.545778.

The neural basis of resting-state fMRI functional connectivity in fronto-limbic circuits revealed by chemogenetic manipulation

Affiliations

The neural basis of resting-state fMRI functional connectivity in fronto-limbic circuits revealed by chemogenetic manipulation

Catherine Elorette et al. bioRxiv. .

Update in

Abstract

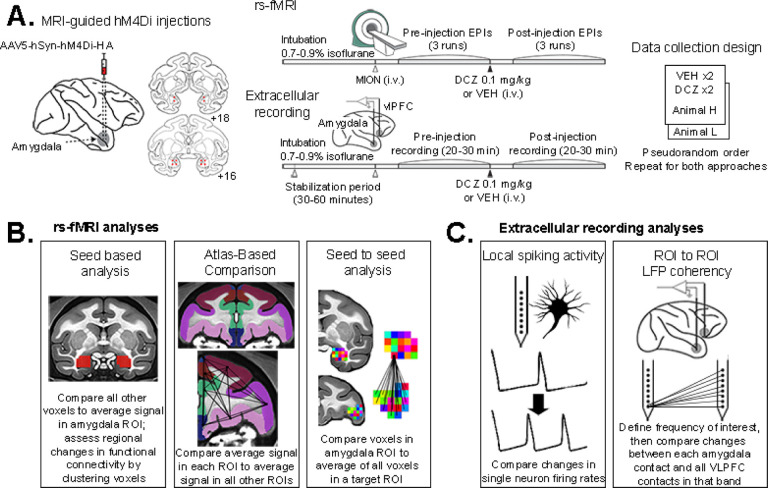
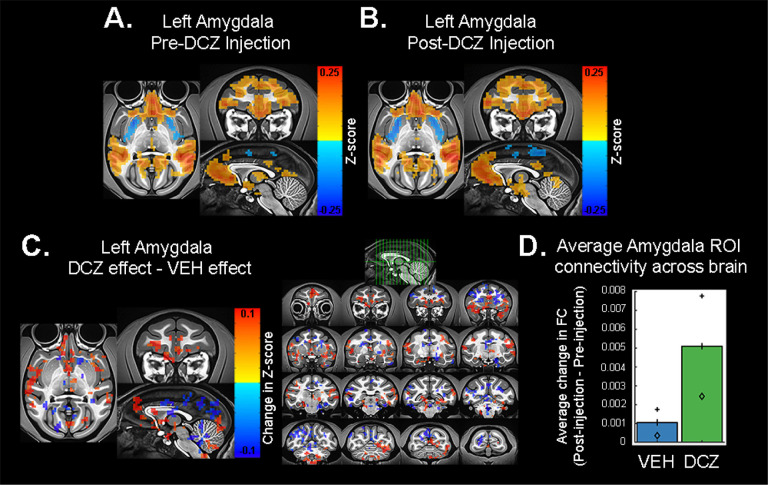
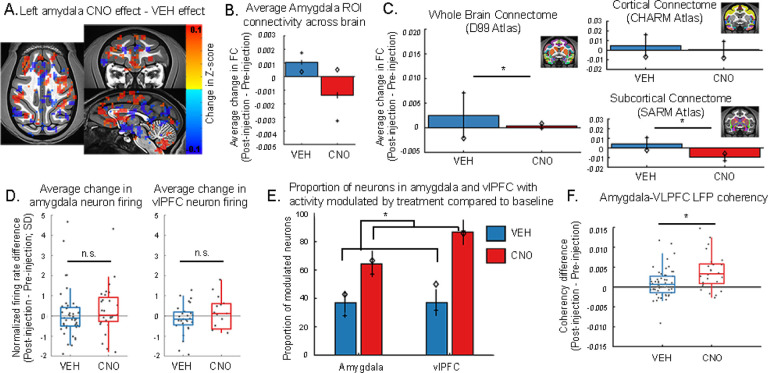
Measures of fMRI resting-state functional connectivity (rs-FC) are an essential tool for basic and clinical investigations of fronto-limbic circuits. Understanding the relationship between rs-FC and neural activity in these circuits is therefore vital. Here we introduced inhibitory designer receptors exclusively activated by designer drugs (DREADDs) into the macaque amygdala and activated them with a highly selective and potent DREADD agonist, deschloroclozapine. We evaluated the causal effect of activating the DREADD receptors on rs-FC and neural activity within circuits connecting amygdala and frontal cortex. Interestingly, activating the inhibitory DREADD increased rs-FC between amygdala and ventrolateral prefrontal cortex. Neurophysiological recordings revealed that the DREADD-induced increase in fMRI rs-FC was associated with increased local field potential coherency in the alpha band (6.5-14.5Hz) between amygdala and ventrolateral prefrontal cortex. Thus, our multi-disciplinary approach reveals the specific signature of neuronal activity that underlies rs-FC in fronto-limbic circuits.


Conflict of interest statement

Conflict of interest The authors declare no competing interests.

Figures

Figure 1.
Figure 1.. Schematic of experimental design and analysis approach.
A) Experimental timeline from injection of DREADDs into amygdala, through data collection of fMRI and extracellular recordings. Types of B) fMRI or C) neural activity analyses performed.
Figure 2.
Figure 2.. DREADD transfection confirmed by histological processing.
A) Brain sections processed for HA tag showing representative images shown of whole amygdala (tiled images, top and middle) as well as DREADD transfected amygdala neurons (bottom). B) Schematic of DREADD injection site in amygdala and labeling of axonal projections in vlPFC. C) Brain sections processed for HA tag, showing labeling of axon terminals in vlPFC (see inset). Representative images are shown for each animal of the hemisphere in which extracellular recording of vlPFC occurred. Red arrows indicate electrode tracks.
Figure 3.
Figure 3.. Representative changes in functional connectivity between amygdala and frontal cortex.
Changes in FC with a left amygdala seed region in animal L, averaged across two sessions of DCZ testing. Pre-DCZ injection period (A) and post-injection period (B). Scale bar indicates z-score of rs-FC. Threshold p=0.0028, cluster size ≥30 voxels, voxel faces touching. C) Difference in FC produced by DREADD inhibition [(DCZ post-injection – pre-injection) – (VEH post-injection – pre-injection)], calculated from averaged DCZ post-injection – pre-injection data and averaged VEH post-injection – pre-injection data. Scale bar indicates difference in z-score of rs-FC. Threshold p=0.0485, cluster size ≥30 voxels, voxel faces touching. D) Average change in rs-FC between amygdala (bilateral ROI) and all other voxels in the brain after treatment with vehicle or DREADD activation via DCZ. Symbols indicate values for each animal, averaged across sessions. Animal H, diamond; animal L, plus sign. Multiway ANOVA, main effect of drug F[1, 226780] = 272.20, p<0.0001, main effect of animal F[1, 226780] = 186.82, p<0.0001, interaction of drug and animal F[1, 226780] = 64.26, p<0.0001.
Figure 4.
Figure 4.. Whole brain fMRI functional connectome altered by chemogenetic inhibition of amygdala.
Average FC across all ROIs calculated across a standard whole brain atlas (A), a cortical atlas (B) and a subcortical (C) atlas. Activation of DREADDs via DCZ increased global rs-FC across all three networks. Symbols denote average difference in rs-FC for each animal, averaged across sessions. Animal H, diamond; animal L, plus sign. Error bars represent SEM. Atlas image insets shown on NMT v2 (Seidlitz et al. 2018, Hartig et al. 2021, Jung et al. 2021, Saleem et al. 2021). Multi-way ANOVA analyses: Whole brain, main effect of drug F[1, 146884] = 728.35, p<0.0001 and subject F[1, 146884] = 498.91, p<0.0001, interaction between subject and drug F[1, 146884] = 12.54, p=0.0004. Cortical atlas, main effect of drug F[1, 5036] = 34.71, p<0.0001 and subject F[1, 5036] = 115.59, p<0.0001. Subcortical atlas, main effect of drug F[1, 4484] = 44.61, p<0.0001 and subject F[1, 4484] = 56.76, p<0.0001, interaction between subject and drug F[1, 4484] = 206.47, p<0.0001.
Figure 5.
Figure 5.. Inhibition of amygdala produces increased functional connectivity as measured by LFP coherency and rs-fMRI, as well as increased neural spiking.
A) Recording sites in vlPFC and amygdala, validated by histology. B-C) Average (±SEM) time course (left) and summary data (right) of neural spiking activity in the amygdala (B) or vlPFC (C) after treatment with DREADD actuator DCZ or control. For visualization purpose, the average normalized firing rate change over time was smoothed using a moving average window of 2sec (4 bins). Only amygdala neurons show an increase in average firing rate after chemogenetic inhibition of amygdala via DCZ (Wilcoxon signed-rank test; p=0.002. Amygdala VEH p=0.46; vlFPC DCZ p=0.68, vlPFC VEH p=0.29). There was a significant difference between amygdala neuron firing rate after treatment with DCZ as compared to VEH (Kruskall-Wallis; Χ2 [1,97, N = 99] = 7.3, p = 0.0069), but no difference due to treatment in the vlPFC (Χ2 [1,43, N = 45] = 0.48, p = 0.49). Single neurons denoted by dots. D) Average (±SEM) change in LFP coherency at each amygdala electrode site pair with all vlPFC electrode sites. Dots indicate amygdala contact pairs. Multiway ANOVA, main effect of drug F[1, 102] = 5.64, p=0.02 E) Average change in FC between each amygdala ROI voxel with all vlPFC (area 12o/l) voxels, shown separately for each animal. Right and left rs-FC maps were calculated separately.
Figure 6.
Figure 6.. Activation of inhibitory DREADDs by less specific actuator CNO compared to DCZ produces similar changes in frontal-limbic functional connectivity but differently affects large scale connectomes.
A) Difference in FC with left amygdala seed region in animal L produced by DREADD inhibition with CNO (as in Figure 3C). Scale bar indicates difference in z-score. Threshold p=0.0485, cluster size ≥30 voxels, voxel faces touching. B) Average change in rs-FC between amygdala (bilateral ROI) and all other voxels in the brain after treatment with vehicle or DREADD activation via CNO. Symbols indicate values for each animal (averaged across VEH sessions). Animal H, diamond; animal L, plus sign. Multiway ANOVA, main effect of drug F[1, 170084] = 67.70, p<0.0001, main effect of animal F[1, 170084] = 16.23, p<0.0001, interaction of drug and animal F[1, 170084] = 76.22, p<0.0001. C) Average (±SEM) rs-FC across all ROIs calculated using a standard whole brain atlas, as well as specifically within cortical and subcortical regions. Compared to vehicle, CNO decreased global rs-FC across the whole brain, and specifically across subcortical regions. Whole brain multiway ANOVA, main effect of drug (F[1, 110012] = 24.49, p<0.0001), subject F[1, 110012] = 90.89, p<0.0001, interaction between subject and drug F[1, 110012] = 140.66, p<0.0001. Cortical atlas multiway ANOVA, main effect of subject F[1, 3776] = 51.04, p<0.0001, no main effect of drug F[1, 3776] = 2.17, p=0.14, no interaction F[1, 3776] = 1.05, p=0.31. Subcortical atlas, main effect of drug (F[1, 3362] = 42.99, p<0.0001), interaction between subject and drug F[1, 3362] = 23.28, p<0.0001, no main effect of subject F[1, 3362] = 1.77, p=0.18. D) Amygdala DREADD inhibition via CNO did not alter neural spiking activity in the amygdala (left; Kruskall-Wallis; Χ2 [1,72, N = 74] = 2.0, p = 0.16) or vlPFC (right; Kruskall-Wallis; Χ2 [1,40, N = 42] = 0.52, p = 0.47) as compared to vehicle. In no condition was the firing rate significantly altered compared to pre-injection (Wilcoxon signed-rank test; Amygdala CNO p=0.33; amygdala VEH p=0.46; vlFPC CNO p=0.85, vlPFC VEH p=0.29). However, CNO treatment did E) significantly increase the proportion of modulated neurons across the amygdala and vlPFC. Dots indicate single neurons. Error bars indicate SEM. Linear mixed-effects model (T[1,112] = 2.25, p=0.03). F) DREADD activation with CNO significantly increased LFP coherence between amygdala and vlPFC. Average (±SEM) change in LFP coherency at each amygdala electrode site pair with all vlPFC electrode sites. Dots indicate amygdala contact pairs. Multiway ANOVA, main effect of treatment (F[1, 78] = 10.73, p=0.002).

References

    1. Adam R, Johnston K, Menon RS, Everling S (2020) Functional reorganization during the recovery of contralesional target selection deficits after prefrontal cortex lesions in macaque monkeys. Neuroimage 207:116339 Available at: 10.1016/j.neuroimage.2019.116339. - DOI - PubMed
    1. Aggleton JP, Mishkin M (1984) Projections of the amygdala to the thalamus in the cynomolgus monkey. J Comp Neurol 222:56–68. - PubMed
    1. Amaral D, Price J, Pitkanen A, Carmichael T (1992) Anatomical organization of the primate amygdaloid complex. In: The amygdala: Neurobiological aspects of emotion, memory, and mental dysfunction. (Aggleton J, ed), pp 1–66. New York, NY, US, NY, US: Wiley-Liss.
    1. Areshenkoff CN, Nashed JY, Hutchison RM, Hutchison M, Levy R, Cook DJ, Menon RS, Everling S, Gallivan JP (2021) Muting, not fragmentation, of functional brain networks under general anesthesia. Neuroimage 231:117830 Available at: 10.1016/j.neuroimage.2021.117830. - DOI - PubMed
    1. Armbruster BN, Li X, Pausch MH, Herlitze S, Roth BL (2007) Evolving the lock to fit the key to create a family of G protein-coupled receptors potently activated by an inert ligand. Proc Natl Acad Sci U S A 104:5163–5168 Available at: http://www.ncbi.nlm.nih.gov/pubmed/17360345 [Accessed April 9, 2018]. - PMC - PubMed

Publication types