[Preprint]. 2023 Sep 14:2023.09.12.23295384.
doi: 10.1101/2023.09.12.23295384.

Determinants of de novo B cell responses to drifted epitopes in post-vaccination SARS-CoV-2 infections

Affiliations

Determinants of de novo B cell responses to drifted epitopes in post-vaccination SARS-CoV-2 infections

Grace E Quirk et al. medRxiv. .

Update in

  • Intrinsic immunogenicity is a major determinant of type-specific responses in SARS-CoV-2 infections.
    Quirk GE, Schoenle MV, Peyton KL, Uhrlaub JL, Lau B, Liang CY, Burgess JL, Ellingson K, Beitel S, Romine J, Lutrick K, Fowlkes A, Britton A, Tyner HL, Caban-Martinez AJ, Naleway A, Gaglani M, Yoon S, Edwards LJ, Olsho L, Dake M, Valdez R, Gordon A, Diamond MS, LaFleur BJ, Nikolich JŽ, Sprissler R, Worobey M, Bhattacharya D. Quirk GE, et al. Nat Immunol. 2025 Jun;26(6):829-836. doi: 10.1038/s41590-025-02162-2. Epub 2025 May 27. Nat Immunol. 2025. PMID: 40425779 Free PMC article.

Abstract

Vaccine-induced immunity may impact subsequent de novo responses to drifted epitopes in SARS-CoV-2 variants, but this has been difficult to quantify due to the challenges in recruiting unvaccinated control groups whose first exposure to SARS-CoV-2 is a primary infection. Through local, statewide, and national SARS-CoV-2 testing programs, we were able to recruit cohorts of individuals who had recovered from either primary or post-vaccination infections by either the Delta or Omicron BA.1 variants. Regardless of variant, we observed greater Spike-specific and neutralizing antibody responses in post-vaccination infections than in those who were infected without prior vaccination. Through analysis of variant-specific memory B cells as markers of de novo responses, we observed that Delta and Omicron BA.1 infections led to a marked shift in immunodominance in which some drifted epitopes elicited minimal responses, even in primary infections. Prior immunity through vaccination had a small negative impact on these de novo responses, but this did not correlate with cross-reactive memory B cells, arguing against competitive inhibition of naïve B cells. We conclude that dampened de novo B cell responses against drifted epitopes are mostly a function of altered immunodominance hierarchies that are apparent even in primary infections, with a more modest contribution from pre-existing immunity, perhaps due to accelerated antigen clearance.


Figures

Figure 1.
Figure 1.. Primary and recall antibody responses to Wuhan and Delta strains of SARS-COV-2.
(A) Virus neutralization assays were performed using the WA-1 and Delta isolates of SARS-CoV-2. Serial 1:3 dilutions of serums were performed and tested for the ability to prevent plaque formation on Vero cells. The lowest concentration capable of preventing more than 90% of plaques was considered to be the PRNT90 value. Each symbol represents an individual. Two-sided P values from t-test statistics were calculated for pairwise differences using two-way ANOVA. Post hoc testing for multiple comparisons between draws was performed using Tukey’s multiple comparisons test. P values greater than 0.05 are not depicted. (B) Quantitative titers of WuHu1- and Delta RBD-specific antibodies. Serum was initially diluted 1:60, serially diluted 1:3, assessed by ELISA for binding to the listed antigens, and area under the curve (AUC) values were calculated. Each symbol represents an individual. WuHu1 AUC values were divided by their Delta AUC titer in the same individual to calculate a WuHu1:Delta RBD ratio in the rightmost panel. Two-sided P values from t-test statistics were calculated for pairwise differences using one-way ANOVA. Post hoc testing for multiple comparisons between draws was performed using Tukey’s multiple comparisons test. P values greater than 0.05 are not depicted.
Figure 2.
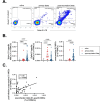
Figure 2.. WuHu1 and Delta Memory B cell flow cytometric analysis and quantification.
(A) Representative flow cytometric plots of Wuhu1 and Delta S1-specific memory B cells (full gating strategy shown in Figure S2) in naïve, primary Delta infection, and post-vaccination Delta infection cohorts. Cells that bind both WuHu1 S1 and Delta S1 are annotated as cross-reactive S1+, whereas cells that bind only WuHu1 S1 or Delta S1 are annotated as WuHu1 S1+ or Delta S1+, respectively. (B) Quantification of isotype-switched memory B cells as a percentage of total PBMCs for Wuhu1 S1+, Delta S1+ and cross-reactive S1+ specificities for each cohort of SARS-CoV-2 immune histories. Each symbol represents an individual. Two-sided P values from t-test statistics were calculated for pairwise differences using one-way ANOVA. Post hoc testing for multiple comparisons between draws was performed using Tukey’s multiple comparisons test. P values greater than 0.05 are not depicted. (C) Correlation of post-infection cross-reactive S1 MBCs (calculated as in Figure 2B) plotted against the frequency of post-infection Delta S1-specific MBCs (calculated as in Figure 2B) in individuals that experienced a post-vaccination Delta infection. Pearson correlation analysis was performed.
Figure 3.
Figure 3.. Epitope-specific quantification of Delta RBD- and Delta NTD-specific antibodies and memory B cells.
(A) A chimeric protein (Delta RBD-L452) was generated in which R452 was reverted to the ancestral L452. ELISAs were used to quantify serum antibodies that bound to Delta RBD-L452 in each cohort. Delta RBD-L452 AUC titers were divided by Delta RBD titers (Figure 1B) in the same individuals to calculate a L452:R452 titer ratio. Each symbol represents an individual. Two-sided P values from t-test statistics were calculated for pairwise differences using one-way ANOVA. Post hoc testing for multiple comparisons between draws was performed using Tukey’s multiple comparisons test. P values greater than 0.05 are not depicted. (B) A chimeric protein (Delta NTD-WuHu1 S1) was generated in which Delta NTD mutated epitopes (T19R, G142D, E156-, F157-, R158G) were incorporated into the otherwise WuHu1 S1 backbone. ELISAs were used to quantify serum antibodies that bound to Delta NTD-WuHu1 S1 in each cohort. Delta RBD-L452 AUC titers were divided by their Delta RBD (Supplemental Fig 1A) titer to calculate a WuHu1 NTD:Delta NTD titer ratio. Each symbol represents an individual. Two-sided P values from t-test statistics were calculated for pairwise differences using one-way ANOVA. Post hoc testing for multiple comparisons between draws was performed using Tukey’s multiple comparisons test. P values greater than 0.05 are not depicted. (C) LIBRA-seq plots of isotype-switched memory B cells enriched for Spike-binding specificities from primary Delta infections. Read count thresholds to determine positivity were set using samples in which cells lacking Spike-binding specificities were sorted and sequenced. Plots are concatenated from ten individuals. (D) Quantification of Delta RBD-specific and Delta NTD-specific memory B cells (MBCs) in individuals that experienced a primary Delta infection. Lines connect specificities within the same individual. Delta RBD-specific cells were classified by cells that had Delta RBD read counts of greater than 160 and WuHu1 S1 read counts of less than 35. Delta NTD-specific cells were classified by cells that had Delta NTD-WuHu1 S1 read counts of greater than 23 and WuHu1 S1 read counts of less than 35. Two-sided P values were calculated for pairwise differences using paired t-tests.
Figure 4.
Figure 4.. Primary and recall antibody responses to Wuhan and BA.1 strains of SARS-COV-2.
(A) Virus neutralization assays were performed using the WA-1 and BA.1 isolates of SARS-CoV-2. Serial 1:3 dilutions of serums were performed and tested for the ability to prevent plaque formation on Vero cells. The lowest concentration capable of preventing more than 90% of plaques was considered to the PRNT90 value. Each symbol represents an individual. Two-sided P values from t-test statistics were calculated for pairwise differences using two-way ANOVA. Post hoc testing for multiple comparisons between draws was performed using Tukey’s multiple comparisons test. P values greater than 0.05 are not depicted. (B) Quantitative titers of Wuhu1 and BA.1 RBD antibodies. Serum was initially diluted 1:60, serially diluted 1:3, assessed by ELISA for binding to the listed antigens, and area under the curve (AUC) values were calculated. Each symbol represents an individual. WuHu1 AUC values were divided by their BA.1 RBD AUC titer in the same individual to calculate a ratio in the rightmost panel. Two-sided P values from t-test statistics were calculated for pairwise differences using one-way ANOVA. Post hoc testing for multiple comparisons between draws was performed using Tukey’s multiple comparisons test. P values greater than 0.05 are not depicted.
Figure 5.
Figure 5.. WuHu1 and BA.1 Memory B cell flow cytometric analysis and quantification.
(A) Representative flow cytometric plots of Wuhu1 and BA.1 RBD-specific memory B cells (full gating strategy shown in Figure S3) in naïve, vaccinated only, primary BA.1 infection, and post-vaccination BA.1 infection cohorts. Cells that bind both WuHu1 RBD and BA.1 RBD are annotated as cross-reactive RBD+, whereas cells that bind only WuHu1 RBD or BA.1 RBD are annotated as WuHu1 RBD+ or BA.1 RBD+, respectively. (B) Quantification of isotype-switched memory B cells for Wuhu1 RBD+, BA.1 RBD+ and cross-reactive RBD+ specificities for each cohort of SARS-CoV-2 immune histories. Each symbol represents an individual. Two-sided P values from t-test statistics were calculated for pairwise differences using one-way ANOVA. Post hoc testing for multiple comparisons between draws was performed using Tukey’s multiple comparisons test. P values greater than 0.05 are not depicted. (C) Representative flow cytometric plots of Wuhu1 and BA.1 Spike-specific memory B cells (full gating strategy shown in Figure S3) in naïve, vaccinated only, primary BA.1 infection, and post-vaccination BA.1 infection cohorts. Cells that bind both WuHu1 RBD and BA.1 Spike are annotated as cross-reactive Spike+, whereas cells that bind only WuHu1 Spike or BA.1 Spike are annotated as WuHu1 Spike+ or BA.1 Spike+, respectively. (D) Quantification of isotype-switched memory B cells for Wuhu1 Spike+, BA.1 Spike+ and cross-reactive Spike+ specificities for each cohort of SARS-CoV-2 immune histories. Each symbol represents an individual. Two-sided P values from t-test statistics were calculated for pairwise differences using one-way ANOVA. Post hoc testing for multiple comparisons between draws was performed using Tukey’s multiple comparisons test. P values greater than 0.05 are not depicted.
Figure 6.
Figure 6.. Frequency of WuHu1- and BA.1-specific memory B cells before and after BA.1 infection.
(A) Frequencies of isotype-switched memory B cells with Wuhu1 RBD+, BA.1 RBD+ and cross-reactive RBD+ specificities in both unvaccinated and vaccinated individuals before and after BA.1 infection. Lines connect the same individual from pre-infection frequency to post-infection frequency. In primary infections, pre-infection blood draws were taken on average 75.6 days before infection and post-infection blood draws occurred on 37.8 days after infection. In post-vaccination infections, pre-infection blood draws were taken on average 87.6 days before infection and post-infection draws were taken an average of 38.3 days after infection. Individuals that received a vaccine after the pre-infection draw were excluded from analysis. P values were calculated using Wilcoxon matched-pairs signed rank test on each row and post hoc testing for multiple comparisons between draws was performed using two-stage linear step-up procedure of Benjamini, Krieger and Yekutieli. P values greater than 0.05 are not depicted. (B) Frequencies of isotype-switched memory B cells with Wuhu1 Spike+, BA.1 Spike+ and cross-reactive Spike+ specificities in both unvaccinated and vaccinated individuals before and after BA.1 infection. Lines connect the same individual from pre-infection frequency to post-infection frequency. P values were calculated using Wilcoxon matched-pairs signed rank test on each row and post hoc testing for multiple comparisons between draws was performed using two-stage linear step-up procedure of Benjamini, Krieger and Yekutieli. P values greater than 0.05 are not depicted.
Figure 7.
Figure 7.. Correlations of pre-infection and post-infection BA.1-specific antibody, T and B cell responses.
(A) Correlation of pre-infection cross-reactive Spike MBCs (calculated as in Figure 5C) plotted against the frequency of post-infection BA.1 Spike MBCs (calculated as in Figure 5C) in individuals that experienced a post-vaccination BA.1 infection. Pearson correlation analysis was performed. Pre-infection blood draws were taken on average 87.6 days before infection and post-infection draws were taken an average of 38.3 days after infection. Individuals that received a vaccine after the pre-infection draw were excluded from analysis. (B) Correlation of post-infection cross-reactive Spike MBCs (calculated as in Figure 6B) plotted against the frequency of post-infection BA.1 Spike MBCs (calculated as in Figure 5C) in individuals that experienced a post-vaccination BA.1 infection. Pearson correlation analysis was performed. (C) Correlation of pre-infection BA.1 neutralizing antibody titer (calculated as in Figure 4a) plotted against post infection BA.1 Spike MBCs (calculated as in Figure 5c) in individuals that experienced a post-vaccination BA.1 infection. Pearson correlation analysis was performed. (D) Correlation of pre-infection BA.1 Spike-specific T cells as measured by IFNγ ELISPOTs plotted against post-infection BA.1 Spike MBCs in individuals that experienced a post-vaccination BA.1 infection. Pearson correlation analysis was performed.

Similar articles

  • Intrinsic immunogenicity is a major determinant of type-specific responses in SARS-CoV-2 infections.
    Quirk GE, Schoenle MV, Peyton KL, Uhrlaub JL, Lau B, Liang CY, Burgess JL, Ellingson K, Beitel S, Romine J, Lutrick K, Fowlkes A, Britton A, Tyner HL, Caban-Martinez AJ, Naleway A, Gaglani M, Yoon S, Edwards LJ, Olsho L, Dake M, Valdez R, Gordon A, Diamond MS, LaFleur BJ, Nikolich JŽ, Sprissler R, Worobey M, Bhattacharya D. Quirk GE, et al. Nat Immunol. 2025 Jun;26(6):829-836. doi: 10.1038/s41590-025-02162-2. Epub 2025 May 27. Nat Immunol. 2025. PMID: 40425779 Free PMC article.
  • Antibody tests for identification of current and past infection with SARS-CoV-2.
    Fox T, Geppert J, Dinnes J, Scandrett K, Bigio J, Sulis G, Hettiarachchi D, Mathangasinghe Y, Weeratunga P, Wickramasinghe D, Bergman H, Buckley BS, Probyn K, Sguassero Y, Davenport C, Cunningham J, Dittrich S, Emperador D, Hooft L, Leeflang MM, McInnes MD, Spijker R, Struyf T, Van den Bruel A, Verbakel JY, Takwoingi Y, Taylor-Phillips S, Deeks JJ; Cochrane COVID-19 Diagnostic Test Accuracy Group. Fox T, et al. Cochrane Database Syst Rev. 2022 Nov 17;11(11):CD013652. doi: 10.1002/14651858.CD013652.pub2. Cochrane Database Syst Rev. 2022. PMID: 36394900 Free PMC article.
  • Signs and symptoms to determine if a patient presenting in primary care or hospital outpatient settings has COVID-19.
    Struyf T, Deeks JJ, Dinnes J, Takwoingi Y, Davenport C, Leeflang MM, Spijker R, Hooft L, Emperador D, Domen J, Tans A, Janssens S, Wickramasinghe D, Lannoy V, Horn SRA, Van den Bruel A; Cochrane COVID-19 Diagnostic Test Accuracy Group. Struyf T, et al. Cochrane Database Syst Rev. 2022 May 20;5(5):CD013665. doi: 10.1002/14651858.CD013665.pub3. Cochrane Database Syst Rev. 2022. PMID: 35593186 Free PMC article.
  • SARS-CoV-2-neutralising monoclonal antibodies to prevent COVID-19.
    Hirsch C, Park YS, Piechotta V, Chai KL, Estcourt LJ, Monsef I, Salomon S, Wood EM, So-Osman C, McQuilten Z, Spinner CD, Malin JJ, Stegemann M, Skoetz N, Kreuzberger N. Hirsch C, et al. Cochrane Database Syst Rev. 2022 Jun 17;6(6):CD014945. doi: 10.1002/14651858.CD014945.pub2. Cochrane Database Syst Rev. 2022. PMID: 35713300 Free PMC article.
  • Immunogenicity and seroefficacy of pneumococcal conjugate vaccines: a systematic review and network meta-analysis.
    Feng S, McLellan J, Pidduck N, Roberts N, Higgins JP, Choi Y, Izu A, Jit M, Madhi SA, Mulholland K, Pollard AJ, Procter S, Temple B, Voysey M. Feng S, et al. Health Technol Assess. 2024 Jul;28(34):1-109. doi: 10.3310/YWHA3079. Health Technol Assess. 2024. PMID: 39046101 Free PMC article.

References

    1. Novel 2019 coronavirus genome (2020). Virological. https://virological.org/t/novel-2019-coronavirus-genome/319.
    1. Baden L.R., El Sahly H.M., Essink B., Kotloff K., Frey S., Novak R., Diemert D., Spector S.A., Rouphael N., Creech C.B., et al. (2021). Efficacy and safety of the mRNA-1273 SARS-CoV-2 vaccine. N. Engl. J. Med. 384, 403–416. 10.1056/NEJMoa2035389. - DOI - PMC - PubMed
    1. Polack F.P., Thomas S.J., Kitchin N., Absalon J., Gurtman A., Lockhart S., Perez J.L., Pérez Marc G., Moreira E.D., Zerbini C., et al. (2020). Safety and Efficacy of the BNT162b2 mRNA Covid-19 Vaccine. N. Engl. J. Med. 383, 2603–2615. 10.1056/NEJMoa2034577. - DOI - PMC - PubMed
    1. Sadoff J., Gray G., Vandebosch A., Cárdenas V., Shukarev G., Grinsztejn B., Goepfert P.A., Truyers C., Fennema H., Spiessens B., et al. (2021). Safety and efficacy of single-dose Ad26.COV2.S vaccine against Covid-19. N. Engl. J. Med. 384, 2187–2201. 10.1056/NEJMoa2101544. - DOI - PMC - PubMed
    1. Tanriover M.D., Doğanay H.L., Akova M., Güner H.R., Azap A., Akhan S., Köse Ş., Erdinç F.Ş., Akalın E.H., Tabak Ö.F., et al. (2021). Efficacy and safety of an inactivated whole-virion SARS-CoV-2 vaccine (CoronaVac): interim results of a double-blind, randomised, placebo-controlled, phase 3 trial in Turkey. Lancet 398, 213–222. 10.1016/S0140-6736(21)01429-X. - DOI - PMC - PubMed

Publication types