[Preprint]. 2023 Sep 17:2023.09.15.557918.
doi: 10.1101/2023.09.15.557918.

Interferon-α promotes neo-antigen formation and preferential HLA-B-restricted antigen presentation in pancreatic β-cells

Affiliations

Interferon-α promotes neo-antigen formation and preferential HLA-B-restricted antigen presentation in pancreatic β-cells

Alexia Carré et al. bioRxiv. .

Abstract

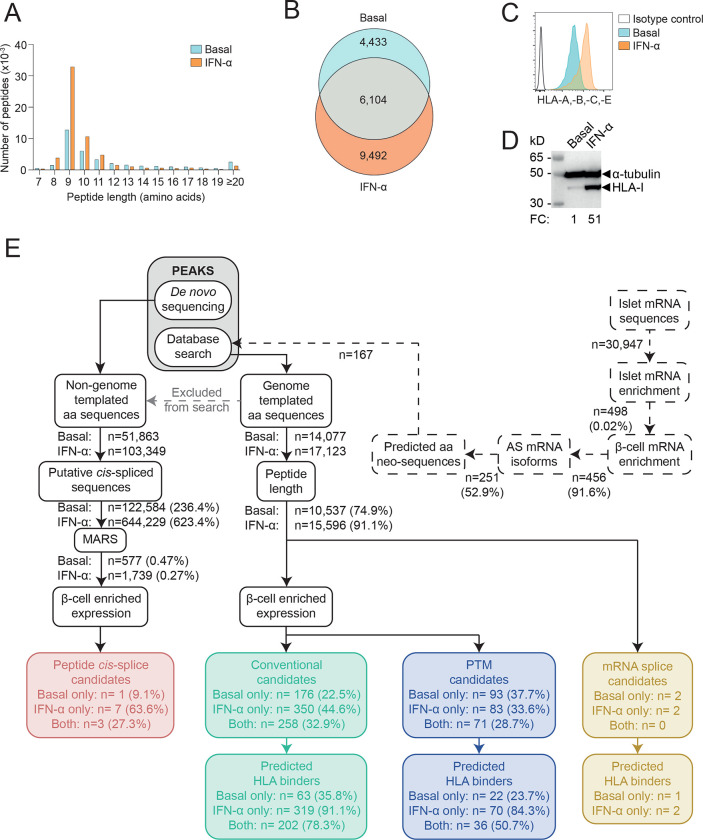
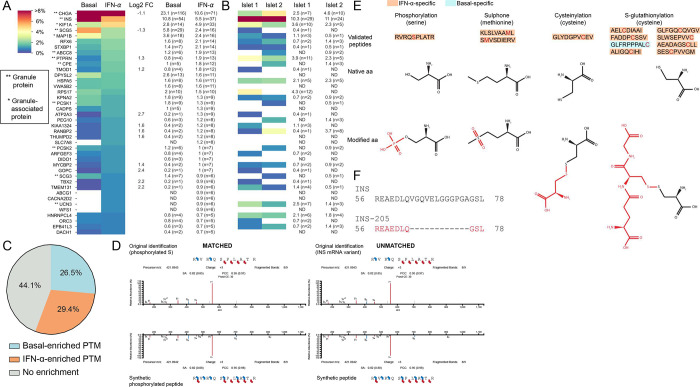
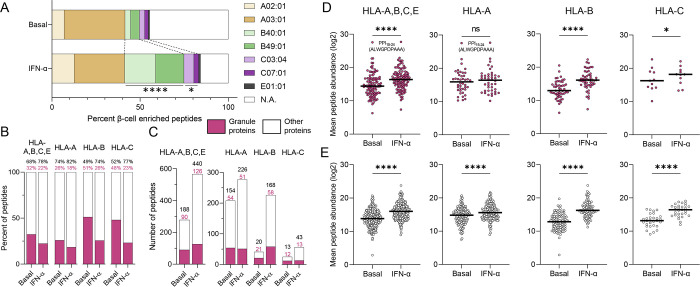
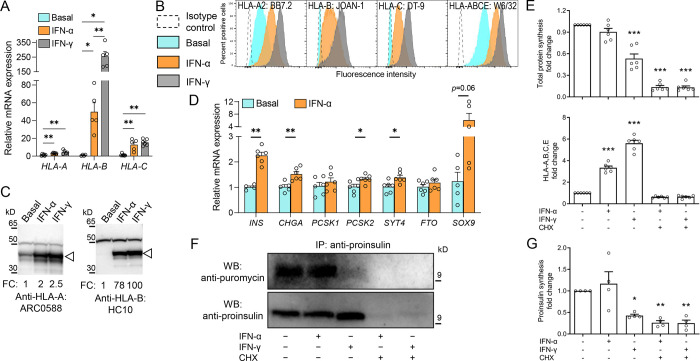
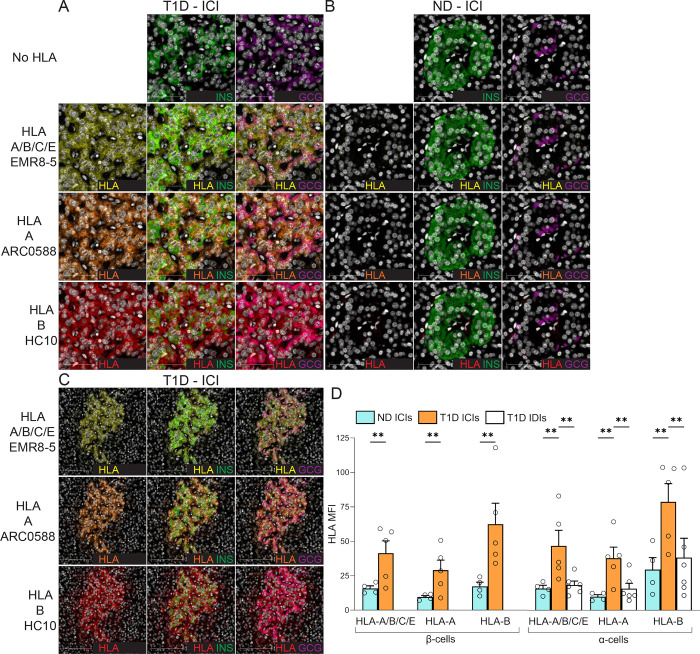
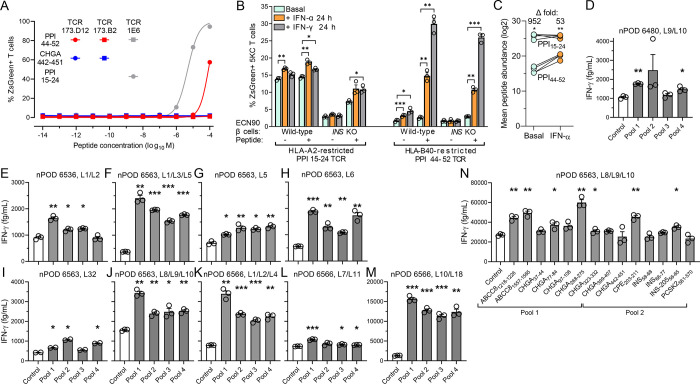
Interferon (IFN)-α is the earliest cytokine signature observed in individuals at risk for type 1 diabetes (T1D), but its effect on the repertoire of HLA Class I (HLA-I)-bound peptides presented by pancreatic β-cells is unknown. Using immunopeptidomics, we characterized the peptide/HLA-I presentation in in-vitro resting and IFN-α-exposed β-cells. IFN-α increased HLA-I expression and peptide presentation, including neo-sequences derived from alternative mRNA splicing, post-translational modifications - notably glutathionylation - and protein cis-splicing. This antigenic landscape relied on processing by both the constitutive and immune proteasome. The resting β-cell immunopeptidome was dominated by HLA-A-restricted ligands. However, IFN-α only marginally upregulated HLA-A and largely favored HLA-B, translating into a major increase in HLA-B-restricted peptides and into an increased activation of HLA-B-restricted vs. HLA-A-restricted CD8+ T-cells. A preferential HLA-B hyper-expression was also observed in the islets of T1D vs. non-diabetic donors, and we identified islet-infiltrating CD8+ T-cells from T1D donors reactive to HLA-B-restricted granule peptides. Thus, the inflammatory milieu of insulitis may skew the autoimmune response toward epitopes presented by HLA-B, hence recruiting a distinct T-cell repertoire that may be relevant to T1D pathogenesis.


Conflict of interest statement

Competing interests. No potential conflicts of interest relevant to this article were reported.

Figures

Figure 1.
Figure 1.. Immunopeptidome profiling of HLA-I-bound peptides presented by ECN90 β-cells.
A. Length distribution of HLA-I-eluted peptides from ECN90 β-cells under basal (blue) and IFN-α-stimulated conditions (orange). Four biological replicates (3.5–4.5×10⁸ cells/each) were acquired for each condition, and unique peptides across replicates were counted. B. Number of 8–14mer peptides eluted from the above conditions. C. HLA-I expression detected by flow cytometry on ECN90 β-cells in basal (blue) and IFN-α-stimulated conditions (orange) using W6/32 Ab. D. HLA-I heavy chain expression detected with HC10 Ab by Western blot in whole cell lysates of ECN90 cells exposed or not to IFN-α, with α-tubulin bands as loading controls and normalized HLA-I fold change (FC) values indicated. E. Bioinformatics analysis pipeline. Predicted aa neo-sequences from RNAseq datasets of human islets (dashed lines) were appended to the database used for immunopeptidome search. Database-matched sequences identified by PEAKS (grey box) were sequentially filtered based on their length, on whether they matched mRNA variants (yellow boxes; peptides listed in Supplementary Data 1) and on the enriched expression of their source proteins in β-cells. Conventional candidates (green boxes; Supplementary Data 2) and sequences carrying PTMs (violet boxes; Supplementary Data 3) were separated. HLA-I-binding predictions were performed using NetMHCpan4.1a (peptide motifs detailed in Supplementary Fig. 1). In parallel, non-genome-templated peptides were interpreted as potential cis-spliced candidates and fed into the MARS algorithm, followed by filtering according to the enrichment of their source proteins in β-cells (red box, Supplementary Data 4).
Figure 2.
Figure 2.. Immunopeptidome of ECN90 β-cells exposed or not to IFN-α and validation of HLA-I-eluted candidate neo-epitopes.
A-B. Heatmap of the relative representation of the top 40 source proteins in ECN90 β-cells (A) and human islets (B), ranked according to the number of peptides detected in the IFN-α-treated condition. The color scale is proportional to the number of peptides identified for each protein out of the total number of peptides in a given condition, expressed as percentage. Only conventional and PTM sequences are included. Peptides carrying PTMs were counted as such only for PTMs defined as likely biological (they were otherwise counted as unmodified); cis-spliced peptides were excluded. Percent values and peptide numbers are listed on the right. Source proteins enriched in IFN-α-treated cells (log2 fold change, FC ≥ 1) or in basal condition (log2 FC ≤ 1) are indicated for ECN90 β-cells. The complete heatmap is provided in Supplementary Fig. 2. HLA-I-bound peptides eluted from primary human islets are listed in Supplementary Data 5 and compared with those eluted from ECN90 β-cells in Supplementary Data 6. C. Global PTM enrichment in basal and IFN-α-treated condition. A detailed list is provided in Supplementary Data 7. D. Spectral matching examples of matched (left) and unmatched (right) synthetic peptides compared to the initial peptide identification using an online tool (https://www.proteomicsdb.org/use). E. Validated post-translationally modified peptides and representation of the native and modified aa. The PTM is indicated in red. A detailed list is provided in Supplementary Data 3. F. Peptide alignment of INS and INS-205 mRNA variant. The sequence of the HLA-eluted variant is indicated in red and correspond to a sequence spliced out as compared to the canonical INS mRNA.
Figure 3.
Figure 3.. HLA-I restrictions of the immunopeptidome of ECN90 β-cells exposed or not to IFN-α.
A. Relative distribution of predicted HLA-I ligands for each allele expressed by ECN90 β-cells in basal and IFN-α-treated conditions. ****p<0.0001 and *p=0.027 by Fisher exact test. Predicted HLA-E*01:01-restricted peptides are listed in Supplementary Data 9. B-C. Percent proportion (B) and number of peptides (C) originating from granule-contained and other proteins in basal and IFN-α-treated conditions. A heatmap of the source proteins of HLA-A- and HLA-B-restricted peptides is provided in Supplementary Fig. 4. D-E. Average total abundance of conventional peptides originating from granule-contained (D) and other proteins (E). The peptides were identified by PEAKS and quantified by Progenesis. The PPI15–24 sequence of the most abundant peptide identified in both conditions is indicated. Horizontal bars represent median values. ****p<0.0001 and *p<0.05 by Wilcoxon test.
Figure 4.
Figure 4.. IFN-α preferentially upregulates HLA-B expression without inducing dedifferentiation or reducing proINS synthesis.
A. Relative mRNA expression of HLA-A, HLA-B and HLA-C alleles in ECN90 β-cells exposed or not to IFN-α or IFN-γ for 24 h. GAPDH was used as an internal normalizing control, and each gene was normalized to the basal sample. Data represent mean±SEM of 5 biological replicates. **p<0.01 and *p<0.05 by Mann-Whitney U test. B-C. Protein expression of HLA-A, -B and -C in in ECN90 β-cells exposed or not to IFN-α or IFN-γ, as detected by surface flow cytometry (B) and Western blot (C) using the indicated Abs validated for their specificity (see Supplementary Fig. 5). For Western blotting, the arrowhead indicates the HLA-I heavy chain band, with the top band indicating the α-tubulin loading control and normalized HLA-I fold change (FC) values indicated. D. Relative mRNA expression of β-cell identity genes in ECN90 β-cells exposed or not to IFN-α. PPIA was used as internal normalizing control, and data representation is the same as in panel A. **p<0.01 and *p<0.05 by Mann-Whitney U test. E. Puromycin incorporation in newly synthesized total proteins (top) and HLA-A/B/C/E expression (bottom), detected by flow cytometry and expressed as fold change compared to the basal sample (first column). Inhibition of protein synthesis by cycloheximide (CHX) provided negative controls (last 2 columns). Data represent mean±SEM of 6 biological replicates. ***p<0.0001 by one-way ANOVA. F. Puromycin incorporation in newly synthesized proINS, detected by proINS immunoprecipitation followed by Western blot for puromycin (top; corresponding to newly synthesized proINS) and proINS (bottom; corresponding to total proINS). A representative experiment out of 4 performed is shown. G. Puromycin incorporation in newly synthesized proINS, detected by Western blot and expressed as fold change compared to the basal sample (first column). Data represent mean±SEM of 4 biological replicates. *p<0.03 and **p<0.002 by one-way ANOVA.
Figure 5.
Figure 5.. HLA-B vs. HLA-A hyper-expression in the islets of T1D and non-diabetic (ND) cases.
A-B. Representative immunofluorescence images of ICIs from T1D case nPOD 6396 (A) and ND case nPOD 6160 (B; all cases listed in Supplementary Table 1), stained with DAPI only (first row) or for HLA-A/B/C/E (yellow; second row), HLA-A (orange; third row) and HLA-B (red, fourth row), alone (first column) or in combination with INS (green, second column) or GCG (violet, third column). Scale bar 50 μm. C. Whole ICI images from the same T1D case nPOD 6396, scale bar 100 μm. D. Immunofluorescence quantification of HLA-I mean fluorescence intensity (MFI) for HLA-A/B/C/E, HLA-A and HLA-B in β-cells (left) and α-cells (right) from ICIs of ND (blue; n=4) and T1D cases (orange; n=5); and in α-cells from IDIs of T1D cases (white; n=6). Bars represent mean+SEM values. **p≤0.005 by 2-way ANOVA. T1D IDI images and individual quantifications for each T1D donor are provided in Supplementary Fig. 6.
Figure 6.
Figure 6.. Recognition of HLA-B40-restricted peptides in the islets of T1D donors.
A. Dose-response peptide recall of 173.D12, 1E6 and negative control 173.B2 TCR-transduced ZsGreen-NFAT reporter 5KC T-cells co-cultured for 18 h K562 antigen-presenting cells transduced with HLA-B40 (for 173.D12 and 173.B2) or HLA-A2 (for 1E6) and pulsed with the indicated peptides. A representative experiment out of 2 performed is shown. B. Activation of ZsGreen-NFAT reporter 5KC T-cells transduced with a 1E6 TCR recognizing HLA-A2-restricted PPI15–24 or a 173.D12 TCR recognizing HLA-B40-restricted PPI44–52. Following the indicated cytokine pretreatment, ECN90 β-cells (wild-type or INS KO) left unpulsed or pulsed with the cognate peptide were put in contact with TCR-transduced 5KC T-cells for 6 h. Data represent mean±SEM of triplicate measurements from a representative experiment performed in triplicate. *p<0.05, **p<0.01 and ***p<0.001 by Student’s t test. C. Average total abundance and fold difference of HLA-A2-restricted PPI15–24 and HLA-B40-restricted PPI44–52 peptides presented under basal and IFN-α-treated conditions (n=4/each; PPI15–24 but not PPI44–52 was detected in 4 additional replicates). *p<0.05 and **p<0.01 by paired Student’s t test. D-N. IFN-γ secretion by polyclonal CD8+ T-cell lines expanded from islet infiltrates of HLA-B40+ nPOD T1D donors (listed in Supplementary Table 2) and exposed to HLA-B40-transduced K562 antigen-presenting cells pulsed with HLA-B40-restricted peptide pools (D-M; listed in Supplementary Table 3) or with individual peptides (N). Data represent mean±SEM of triplicate measurements from a representative experiment performed in duplicate. *p<0.05, **p<0.01 and ***p<0.001 by paired Student’s t test.

Similar articles

References

    1. Ivashkiv L. B. & Donlin L. T. Regulation of type I interferon responses. Nat Rev Immunol 14, 36–49 (2014). - PMC - PubMed
    1. Le Bon A. et al. Type i interferons potently enhance humoral immunity and can promote isotype switching by stimulating dendritic cells in vivo. Immunity 14, 461–470 (2001). - PubMed
    1. Luft T. et al. Type I IFNs enhance the terminal differentiation of dendritic cells. J Immunol 161, 1947–1953 (1998). - PubMed
    1. Marroqui L. et al. Interferon-alpha mediates human beta cell HLA class I overexpression, endoplasmic reticulum stress and apoptosis, three hallmarks of early human type 1 diabetes. Diabetologia 60, 656–667 (2017). - PubMed
    1. Marrack P., Kappler J. & Mitchell T. Type I interferons keep activated T cells alive. J Exp Med 189, 521–530 (1999). - PMC - PubMed

Publication types