[Preprint]. 2024 Nov 9:2023.09.12.557469.
doi: 10.1101/2023.09.12.557469.

Cerebellar Purkinje Cells Control Posture in Larval Zebrafish (Danio rerio)

Affiliations

Cerebellar Purkinje Cells Control Posture in Larval Zebrafish (Danio rerio)

Franziska Auer et al. bioRxiv. .

Update in

Abstract

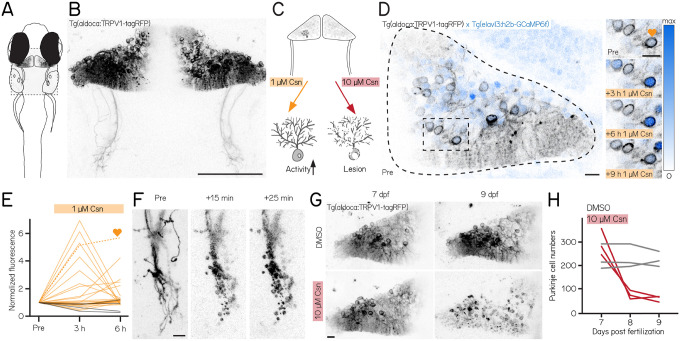
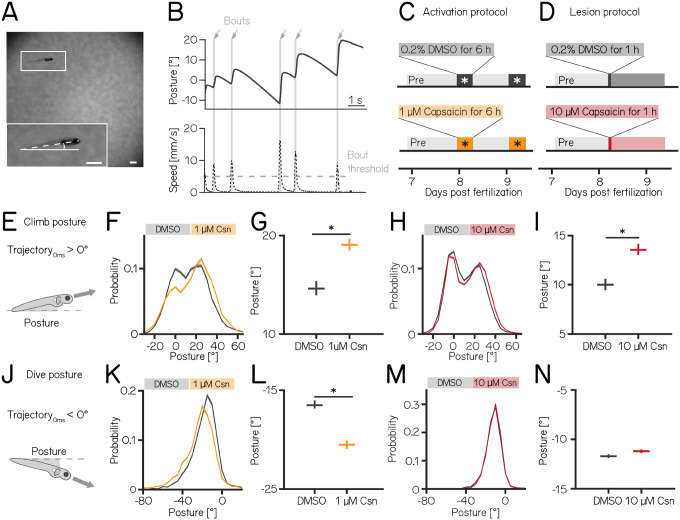
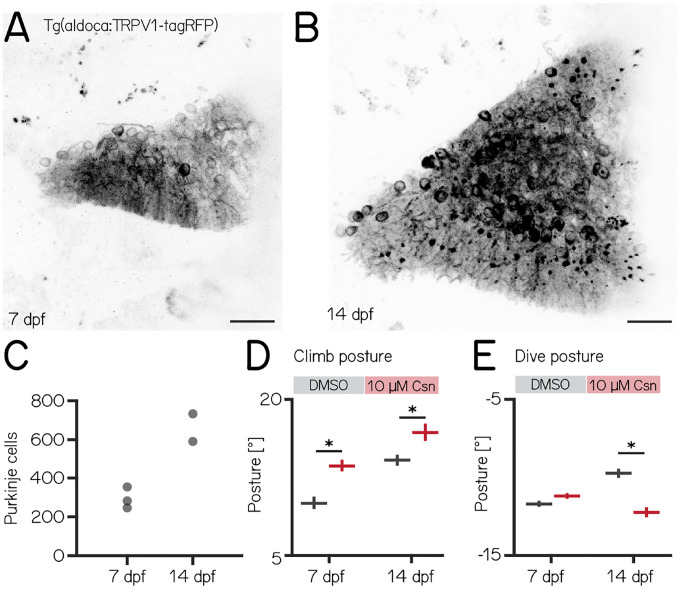
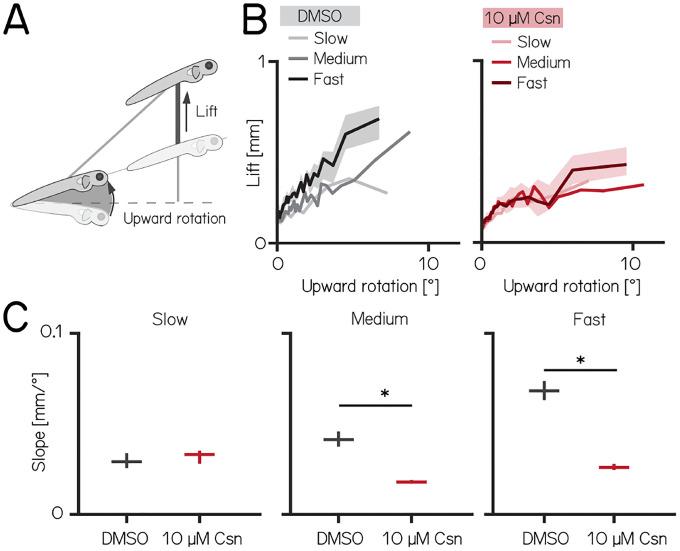
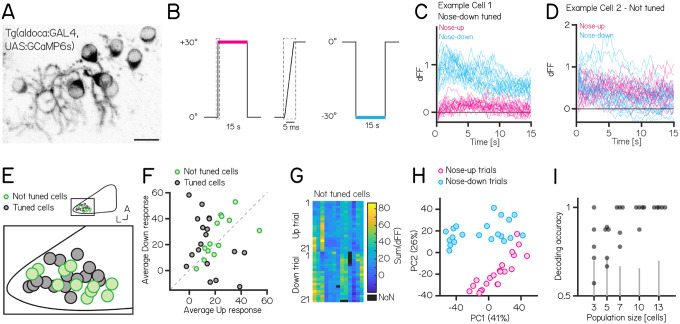
Cerebellar dysfunction leads to postural instability. Recent work in freely moving rodents has transformed investigations of cerebellar contributions to posture. However, the combined complexity of terrestrial locomotion and the rodent cerebellum motivate new approaches to perturb cerebellar function in simpler vertebrates. Here, we adapted a validated chemogenetic tool (TRPV1/capsaicin) to describe the role of Purkinje cells - the output neurons of the cerebellar cortex - as larval zebrafish swam freely in depth. We achieved both bidirectional control (activation and ablation) of Purkinje cells while performing quantitative high-throughput assessment of posture and locomotion. Activation modified postural control in the pitch (nose-up/nose-down) axis. Similarly, ablations disrupted pitch-axis posture and fin-body coordination responsible for climbs. Postural disruption was more widespread in older larvae, offering a window into emergent roles for the developing cerebellum in the control of posture. Finally, we found that activity in Purkinje cells could individually and collectively encode tilt direction, a key feature of postural control neurons. Our findings delineate an expected role for the cerebellum in postural control and vestibular sensation in larval zebrafish, establishing the validity of TRPV1/capsaicin-mediated perturbations in a simple, genetically-tractable vertebrate. Moreover, by comparing the contributions of Purkinje cell ablations to posture in time, we uncover signatures of emerging cerebellar control of posture across early development. This work takes a major step towards understanding an ancestral role of the cerebellum in regulating postural maturation.


Conflict of interest statement

AUTHOR COMPETING INTERESTS The authors declare no competing interests.

Figures

Figure 1:
Figure 1:. A chemogenetic approach allows dose-dependent activation and lesion of Purkinje cells in the cerebellum.
(A) Schematic of a larval zebrafish overlaid with a confocal image of labeled Purkinje cells in the cerebellum. Gray rectangle corresponds to field of view in (B). (B) Confocal image of Purkinje cells in the cerebellum of a 7 days post-fertilization (dpf) Tg(aldoca:TRPV1-tagRFP) larvae. Scale bar 100 μm. (C) Schematic of strategy for dose-dependent activation (yellow, left) or lesion (red, right) of Purkinje cells by addition of the TRP channel agonist capsaicin (Csn). (D) Confocal image (inverted look-up table) of one cerebellar hemisphere of Tg(aldoca:TRPV1-tagRFP); Tg(elavl3:h2b-GCaMP6f) larvae before, 3, 6, and 9 h after addition of capsaicin. Heart corresponds to the labelled trace in (E). (E) Normalized change in fluorescence following treatment with 1 μM capsaicin in individual Purkinje cells as a function of time. Purkinje cells from Tg(aldoca:TRPV1-tagRFP);Tg(elavl3:h2b-GCaMP6f) larvae (orange) and Tg(elavl3:h2b-GCaMP6f) control larvae (grey). (F) Timelapse images of Purkinje cell axons in Tg(aldoca:TRPV1-tagRFP) larvae immediately after addition of 10 μM capsaicin. Scale bar 10 μm. (G) Confocal images of cerebellar hemispheres of Tg(aldoca:TRPV1-tagRFP) larvae before (7 dpf, left) and after (9 dpf, right) treatment with 10 μM capsaicin. Control larvae (DMSO, top) and lesion larvae (10 μM capsaicin, bottom). Scale bar 10 μm. (H) Quantification of Purkinje cell numbers of fish (n=3) from (G).
Figure 2:
Figure 2:. Both chemogenetic activation and ablation of Purkinje cells modify postural stability.
(A) Sample image of a freely-swimming zebrafish larva imaged from the side. Inset shows the larva at higher magnification view and its pitch, defined as the angle between the horizon (straight line) and the long axis of the body (dashed line). Scale bars 1mm. (B) Pitch angle (posture, top) and speed (bottom) as a function of time for one recorded epoch. Individual swim bouts (speed > 5 mm/s threshold) are highlighted in grey (arrows). (C) Timecourse for activation experiments between 7–9 dpf. Larvae received 1 μM of capsaicin in 0.2% DMSO twice on days 8&9 for 6h each. (D) Timecourse for lesion experiments; larvae received a single dose of 10 μmM capsaicin in 0.2% DMSO for 1h on day 8. (E) Climbs are defined as a bout where the trajectory at peak speed took the fish nose-up (>0°). (F) Probability distribution of climb postures for control (black) and 1 μM capsaicin treated larvae (yellow). Data is shown as median and inter-quartile range. (G) Average climb posture of control and activated larvae (8 repeats/149 control fish; 8 repeats/155 1 μM capsaicin treated fish; climb postures: 14.7° [14.0 – 15.4°] vs. 19.0° [18.5 – 19.7°], p-value < 0.001, effect size: 29%, Wilcoxon rank sum test). (H) Probability distribution of climb postures for control (black) and 10 μM capsaicin treated larvae (red). Data is shown as median and inter-quartile range. (I) Average climb posture of control and lesioned larvae (14 repeats/110 control fish; 14 repeats/120 10 μM capsaicin treated fish; climb postures: 10.0° [9.5 – 10.7°] vs. 13.6° [13.1 – 14.3°], p-value < 0.001, effect size: 36%, Wilcoxon rank sum test). (J-N) Same as E-I, but for dive bouts (trajectory that took the fish in the nose-down direction). (L) Average dive posture of control and activated larvae (8 repeats/149 control fish; 8 repeats/155 1 μM capsaicin treated fish; dive postures: −16.6° [−16.9 – −16.1°] vs. −20.5° [−20.9 – −20.1°], p-value < 0.001, effect size = 24%, Wilcoxon rank sum test). (N) Average dive posture of control and lesioned larvae (14 repeats/110 control fish; 14 repeats/120 10 μmM capsaicin treated fish; dive postures: −11.7° [−11.9 – −11.5°] vs. −11.2° [−11.4 – −11.0°], p-value = 0.002, effect size = −4%, Wilcoxon rank sum test). Unless otherwise indicated data are shown as median with 95% confidence interval, * indicates p-value < 0.05 and effect size ≥ 15%
Figure 3:
Figure 3:. Changes to postural stability after chemogenetic ablation of Purkinje cells are more pronounced in older fish.
(A) Confocal image of Purkinje cells in the cerebellum of a 7 dpf Tg(aldoca:TRPV1-tagRFP) larvae. Scale bar: 25 μm. (B) Confocal image of Purkinje cells in the cerebellum of a 14 dpf Tg(aldoca:TRPV1-tagRFP) larvae. Scale bar: 25 μm. (C) Increase in Purkinje cell numbers between 7 and 14 dpf. (D) Average climb bouts postures for 7 dpf control and lesion larvae (left) and 14 dpf control and lesion larvae (right). (14 dpf lesion: 7 repeats/48 control fish; 7 repeats/44 10 μM capsaicin treated fish; climb postures: 14.3° [13.8 – 14.8°] vs. 17.1° [16.2 – 17.8°]; p-value < 0.001; effect size: 20%, Wilcoxon rank sum test). (E) Average dive bouts postures for 7 dpf control and lesion larvae (left) and 14 dpf control and lesion larvae (right). (14 dpf lesion: 7 repeats/48 control fish; 7 repeats/44 10 μM capsaicin treated fish; dive postures: −9.8° [−10.1 – −9.5°] vs. −12.3° [−12.6 – −11.9°]; p-value < 0.001; effect size: 26%, Wilcoxon rank sum test). all data are shown as median with 95% confidence interval, * indicates p-value < 0.05 and effect size ≥ 15%
Figure 4:
Figure 4:. Chemogenetic ablation of Purkinje cells disrupts fin-body coordination in a speed-dependent manner.
(A) Larval zebrafish use two independent effectors (trunk and body) to climb. The contribution of each effector can be dissociated by the observed kinematics: changes to the angle of the trunk predict a trajectory for a particular bout (upward rotation). The actual position of the fish in depth at the end of the bout reveals the lift generated by the fins. A detailed kinematic examination of climbing, including fin ablations, is detailed in. (B) Coordination of fin and trunk engagement plotted as upward rotation against lift. Positive slopes reveal that larger rotations are coupled to greater fin engagement and greater changes in depth. The slope of this relationship becomes steeper for bouts with greater translational speed. Bouts from control (grey,left) and 10 μM capsaicin treated larvae (red,right) are plotted at different swim speeds, shaded areas indicate 95% confidence interval of the median of the fast swim speeds. (C) Average slopes of lift/rotation curves for control and 10 μM capsaicin treated larvae at different swim speeds. (8 repeats/15 control fish; 8 repeats/18 10 μM capsaicin treated fish); slow: p = 0.341; medium: p<0.001; fast: p<0.001. Data are plotted as median with inter-quartile range. * indicates p < 0.05 and effect size ≥ 15%
Figure 5:
Figure 5:. Activity in larval zebrafish Purkinje cells can differentiate nose-up from nose-down pitch both individually and collectively.
(A) 2-photon image of Purkinje cell somata expressing a calcium indicator in the Tg(aldoca:GAL4);Tg(UAS:GCaMP6s) line. Scale bar 10 μm. (B) Pitch tilt stimuli consisted of rapid galvanometer steps for 15 seconds in the nose up (+30°, pink) and nose-down (−30°, blue) direction. Inset in dotted rectangle shows the near-instantaneous timecourse of the step. (C) Example responses (n=42) from a single Purkinje cell sensitive to nose-down pitch (blue) but not nose-up (pink). (D) Example responses (n=42) from a single Purkinje cell without directional selectivity. (E) Superimposed positions of Purkinje cell somata within a single cerebellar hemisphere; no obvious topography separates tuned (black, n=16) and untuned (green, n=11 |directionality index| < 0.35) cells. (F) Averaged integrated response (dFF) for individual cells over the 15 second stimulus plotted for nose-up vs. nose-down stimuli, colored by tuned (black) and untuned (green). (G) Heatmap of integrated response (dFF) for 13 untuned neurons on 21 up/down tilts. (H) Principal component analysis of integrated responses for untuned neurons for each of 21 up (pink) and 21 down (blue) trials. (Percentage of variance explained) (I) Performance of a support vector machine for binary classification of up/down tilt using integrated responses from increasing numbers of untuned neurons. Dots are different sets of neurons, gray lines shows the spread of performance from shuffled up/down identity (median [interquartile range] accuracy: 3/5/7/10/13 cells: 0.78 [0.68 – 0.91] / 0.88 [0.70 – 0.88] / 1 [0.84 – 1] / 1 [0.97 – 1] / 1 [1 – 1]).

Similar articles

References

    1. Sprague James M. and Chambers William W.. Regulation of posture in intact and decerebrate cat: I. cerebellum, reticular formation, vestibular nuclei. Journal of Neurophysiology, 16(5):451–463, September 1953. - PubMed
    1. Kleine J. F., Guan Y., Kipiani E., Glonti L., Hoshi M., and Büttner U.. Trunk position influences vestibular responses of fastigial nucleus neurons in the alert monkey. Journal of Neurophysiology, 91(5):2090–2100, May 2004. - PubMed
    1. Ioffe M. E.. Cerebellar control of posture. In Handbook of the Cerebellum and Cerebellar Disorders, pages 1221–1240. Springer Netherlands, 2013.
    1. Tsutsumi Shinichiro, Chadney Oscar, Yiu Tin-Long, Bäumler Edgar, Faraggiana Lavinia, Beau Maxime, and Häusser Michael. Purkinje cell activity determines the timing of sensory-evoked motor initiation. Cell Reports, 33(12):108537, December 2020. - PMC - PubMed
    1. Becker Matthew I. and Person Abigail L.. Cerebellar control of reach kinematics for endpoint precision. Neuron, 103(2):335–348.e5, July 2019. - PMC - PubMed

Publication types