

This is a preprint.
A Novel Quantitative Metric Based on a Complete and Unique Characterization of Neural Network Activity: 4D Shannon's Entropy
- PMID: 37745513
- PMCID: PMC10516034
- DOI: 10.1101/2023.09.15.557974
A Novel Quantitative Metric Based on a Complete and Unique Characterization of Neural Network Activity: 4D Shannon's Entropy
Abstract
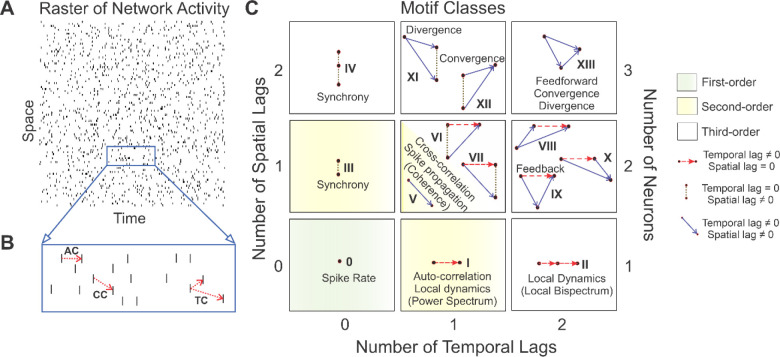
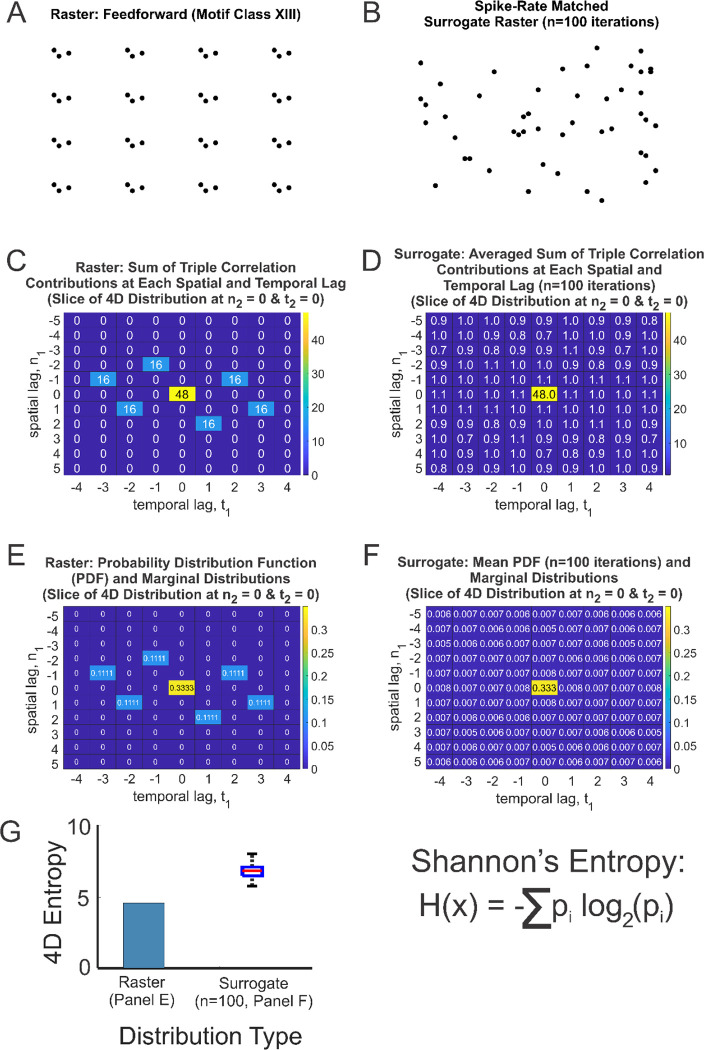
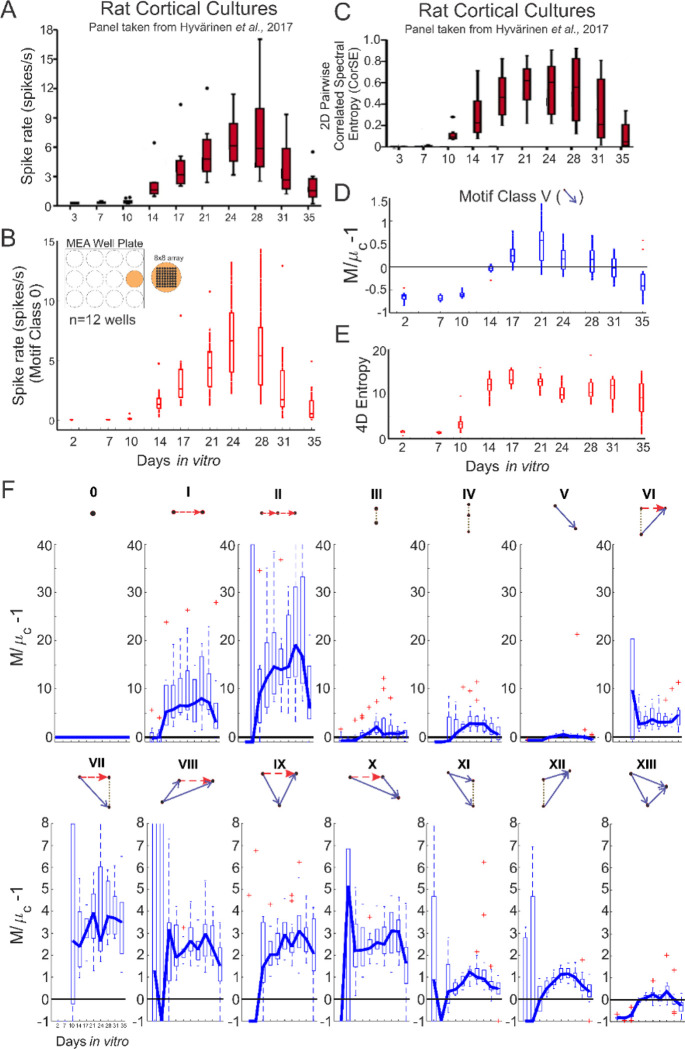
The human brain comprises an intricate web of connections that generate complex neural networks capable of storing and processing information. This information depends on multiple factors, including underlying network structure, connectivity, and interactions; and thus, methods to characterize neural networks typically aim to unravel and interpret a combination of these factors. Here, we present four-dimensional (4D) Shannon's entropy, a novel quantitative metric of network activity based on the Triple Correlation Uniqueness (TCU) theorem. Triple correlation, which provides a complete and unique characterization of the network, relates three nodes separated by up to four spatiotemporal lags. Here, we evaluate the 4D entropy from the spatiotemporal lag probability distribution function (PDF) of the network activity's triple correlation. Given a spike raster, we compute triple correlation by iterating over time and space. Summing the contributions to the triple correlation over each of the spatial and temporal lag combinations generates a unique 4D spatiotemporal lag distribution, from which we estimate a PDF and compute Shannon's entropy. To outline our approach, we first compute 4D Shannon's entropy from feedforward motif-class patterns in a simulated spike raster. We then apply this methodology to spiking activity recorded from rat cortical cultures to compare our results to previously published results of pairwise (2D) correlated spectral entropy over time. We find that while first- and second-order metrics of activity (spike rate and cross-correlation) show agreement with previously published results, our 4D entropy computation (which also includes third-order interactions) reveals a greater depth of underlying network organization compared to published pairwise entropy. Ultimately, because our approach is based on the TCU, we propose that 4D Shannon's entropy is a more complete tool for neural network characterization.
Figures
Similar articles
-
Third-order entropy for spatiotemporal neural network characterization.J Neurophysiol. 2025 Apr 1;133(4):1234-1244. doi: 10.1152/jn.00108.2024. Epub 2025 Mar 17. J Neurophysiol. 2025. PMID: 40098383
-
Asymptotic Normality for Plug-In Estimators of Generalized Shannon's Entropy.Entropy (Basel). 2022 May 12;24(5):683. doi: 10.3390/e24050683. Entropy (Basel). 2022. PMID: 35626567 Free PMC article.
-
Analysis of Shannon's entropy to contrast between the Embodied and Neurocentrist hypothesis of conscious experience.Biosystems. 2024 Dec;246:105323. doi: 10.1016/j.biosystems.2024.105323. Epub 2024 Sep 5. Biosystems. 2024. PMID: 39244080
-
Entropy of Neuronal Spike Patterns.Entropy (Basel). 2024 Nov 11;26(11):967. doi: 10.3390/e26110967. Entropy (Basel). 2024. PMID: 39593911 Free PMC article. Review.
-
What do we mean by biological complexity?C R Biol. 2003 Feb;326(2):133-40. doi: 10.1016/s1631-0691(03)00064-7. C R Biol. 2003. PMID: 12754932 Review.
References
-
- Shannon CE. A Mathematical Theory of Communication. The Bell System Technical Journal. 1948;27:379–423.
Publication types
Grants and funding
LinkOut - more resources
Full Text Sources