[Preprint]. 2023 Sep 17:2023.09.15.557984.
doi: 10.1101/2023.09.15.557984.

Pyruvate Kinase Activity Regulates Cystine Starvation Induced Ferroptosis through Malic Enzyme 1 in Pancreatic Cancer Cells

Affiliations

Pyruvate Kinase Activity Regulates Cystine Starvation Induced Ferroptosis through Malic Enzyme 1 in Pancreatic Cancer Cells

Elliot Ensink et al. bioRxiv. .

Abstract

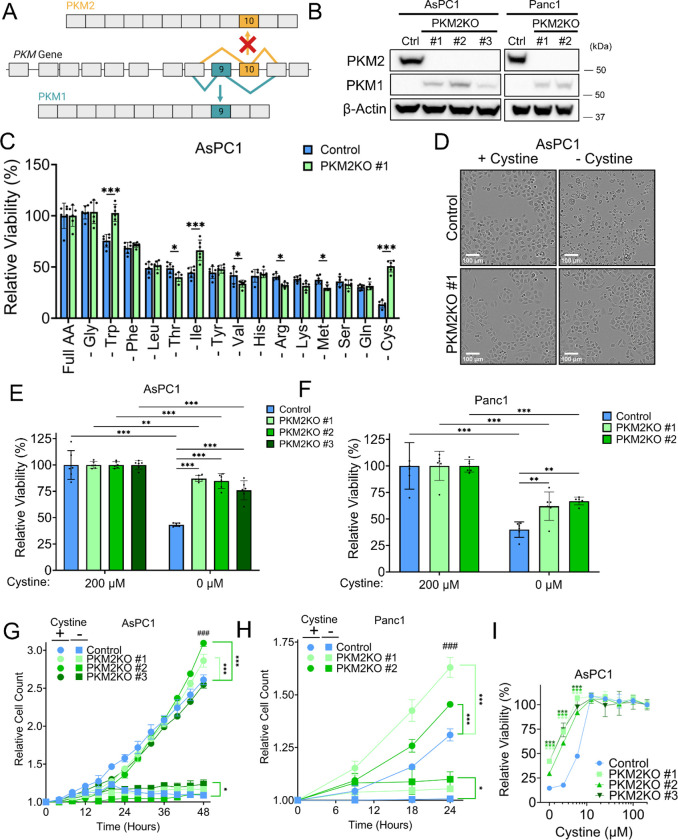
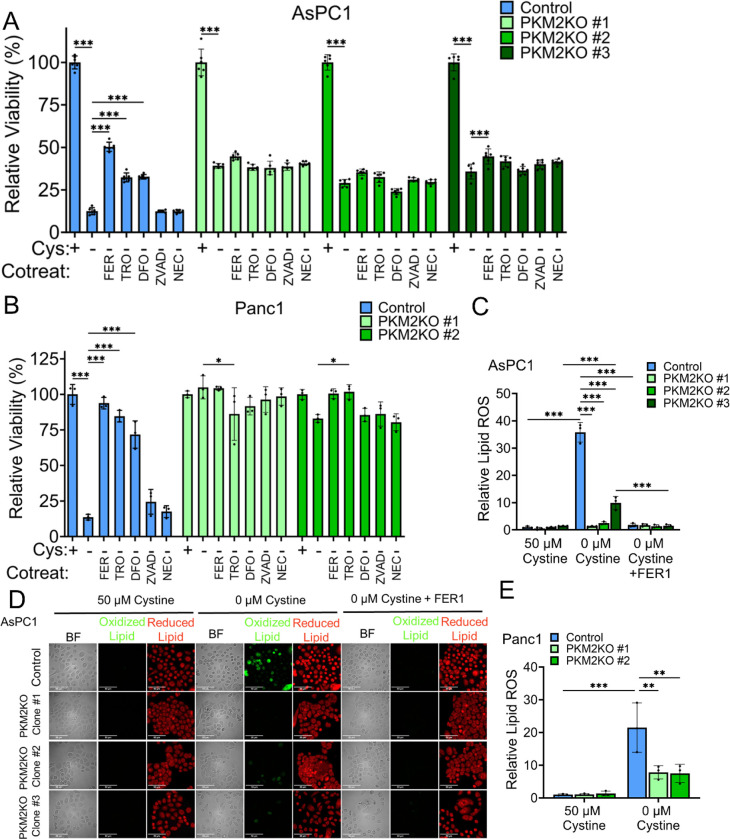
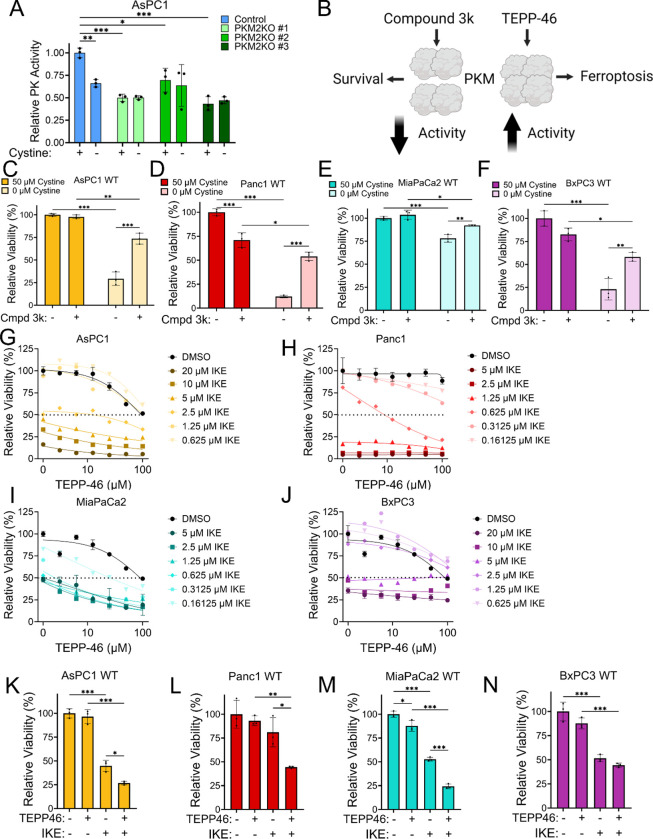
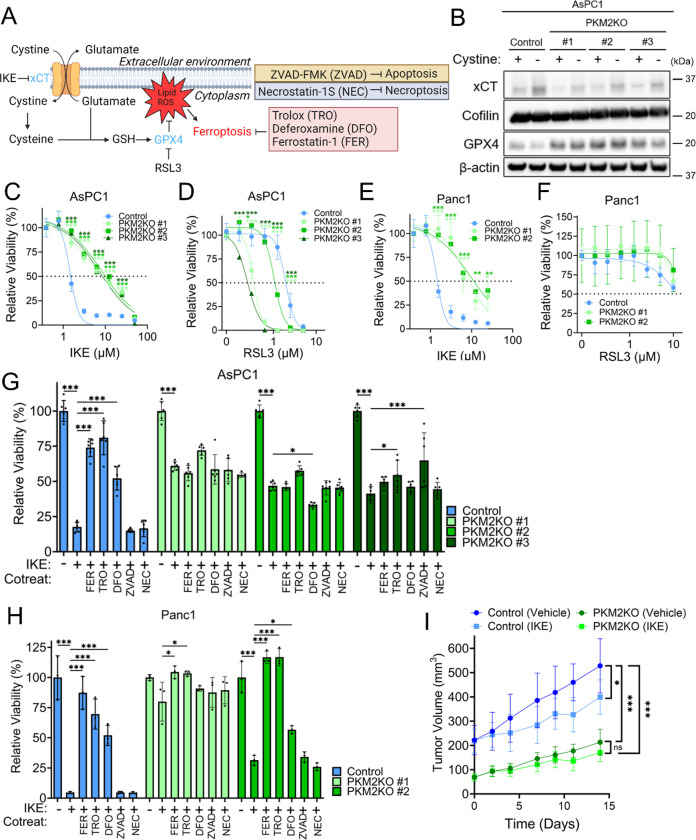
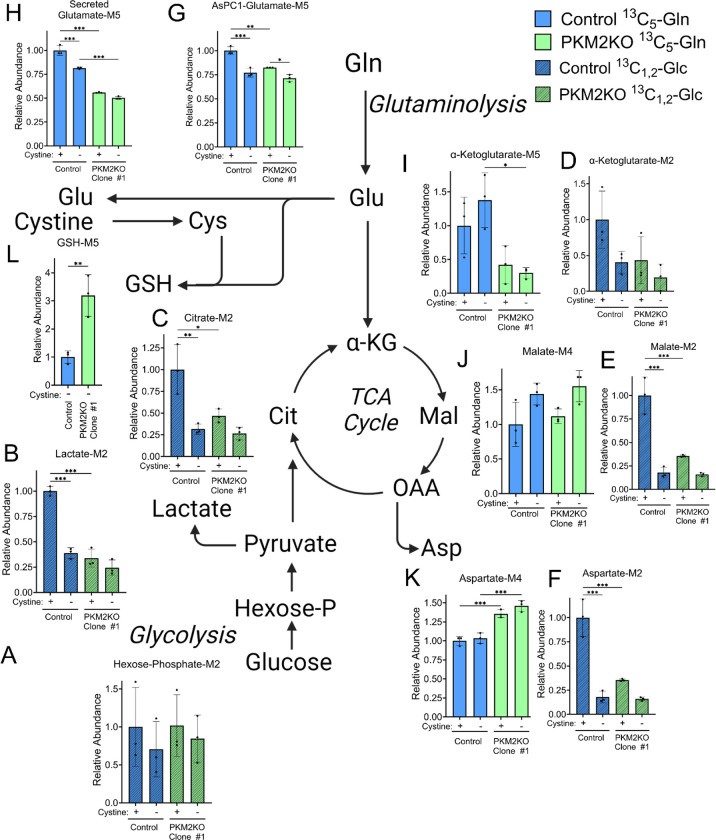
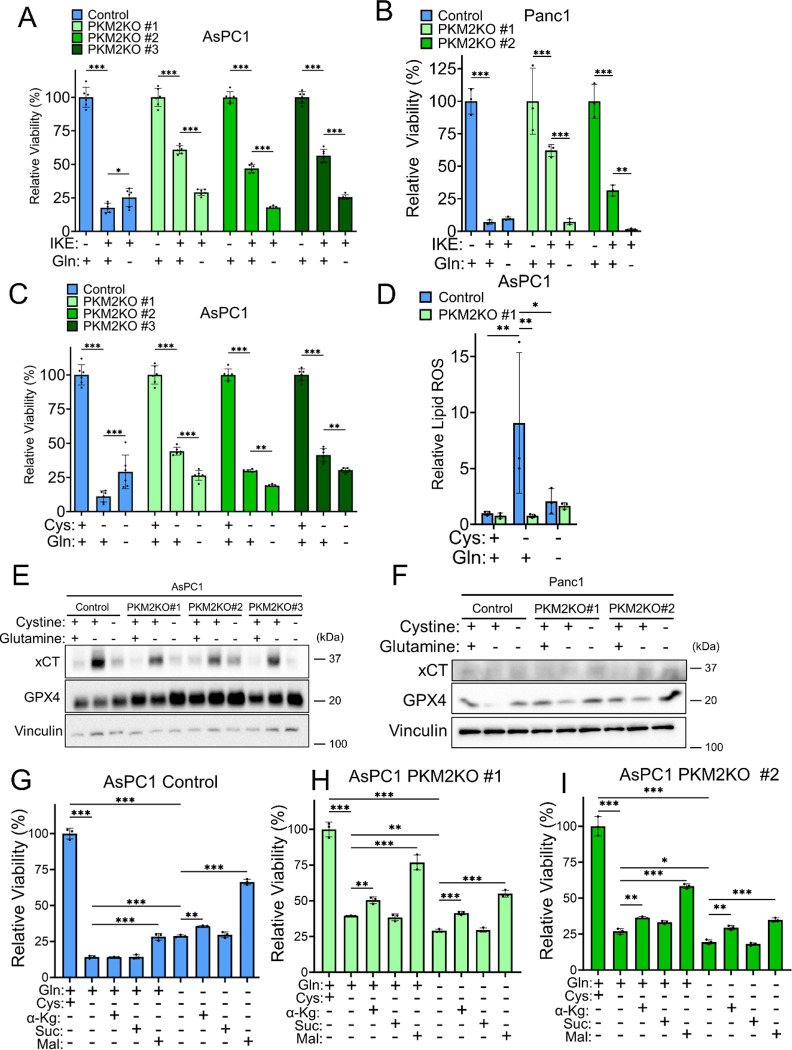
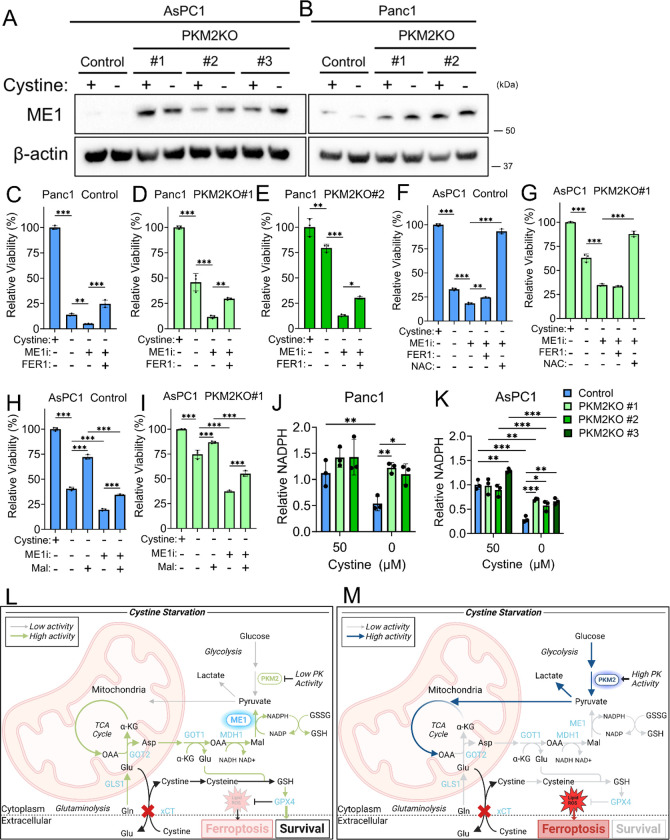
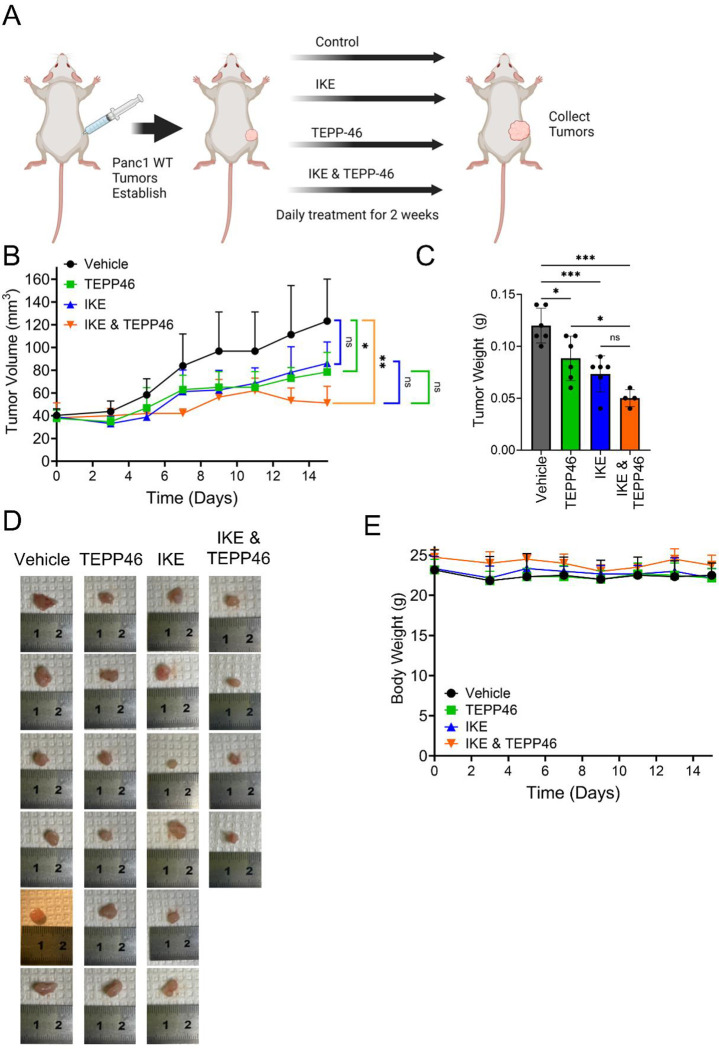
Pancreatic ductal adenocarcinoma (PDAC) is an aggressive cancer with high mortality and limited efficacious therapeutic options. PDAC cells undergo metabolic alterations to survive within a nutrient-depleted tumor microenvironment. One critical metabolic shift in PDAC cells occurs through altered isoform expression of the glycolytic enzyme, pyruvate kinase (PK). Pancreatic cancer cells preferentially upregulate pyruvate kinase muscle isoform 2 isoform (PKM2). PKM2 expression reprograms many metabolic pathways, but little is known about its impact on cystine metabolism. Cystine metabolism is critical for supporting survival through its role in defense against ferroptosis, a non-apoptotic iron-dependent form of cell death characterized by unchecked lipid peroxidation. To improve our understanding of the role of PKM2 in cystine metabolism and ferroptosis in PDAC, we generated PKM2 knockout (KO) human PDAC cells. Fascinatingly, PKM2KO cells demonstrate a remarkable resistance to cystine starvation mediated ferroptosis. This resistance to ferroptosis is caused by decreased PK activity, rather than an isoform-specific effect. We further utilized stable isotope tracing to evaluate the impact of glucose and glutamine reprogramming in PKM2KO cells. PKM2KO cells depend on glutamine metabolism to support antioxidant defenses against lipid peroxidation, primarily by increased glutamine flux through the malate aspartate shuttle and utilization of ME1 to produce NADPH. Ferroptosis can be synergistically induced by the combination of PKM2 activation and inhibition of the cystine/glutamate antiporter in vitro. Proof-of-concept in vivo experiments demonstrate the efficacy of this mechanism as a novel treatment strategy for PDAC.

Keywords: Ferroptosis; Metabolism; Metabolomics; PKM1; PKM2; Pancreatic Cancer; Pyruvate Kinase.


Figures

Figure 1.
Figure 1.. PKM2KO enhances PDAC survival during cystine starvation.
A. Schematic view of mutually exclusive alternative splicing of PKM to produce PKM1 or PKM2. Targeting of exon 10 by CRISPR deletes PKM2 expression. B. Western blot of PKM1 and PKM2 in AsPC1 and Panc1 control cells and PKM2KO clones. C. Relative viabilities of AsPC1 control and PKM2KO clone #1 in DMEM without each individual amino acid as shown. Significance was assessed by two-way ANOVA and Tukey test. *p<0.05, ***p<0.001. D. Brightfield microscopy images of AsPC1 control and PKM2KO cells under either 200 μM (+) or 0 μM (−) cystine conditions. Scale bar = 100 μm. E, F. Relative viabilities of AsPC1 (E) and Panc1 (F) control and PKM2KO clones under 200 μM or 0 μM cystine. Significance was assessed by two-way ANOVA and Tukey test. **p<0.01, ***p<0.001. G, H. Proliferation analysis using Incucyte cell counts of both AsPC1 (G) and Panc1 (H) control and their respective PKM2KO clones under 200 μM (+) or 0 μM (−) cystine. Significance was assessed by two-way ANOVA and Tukey test. Comparison between Control and PKM2KO cells at endpoint: *p<0.05, ***p<0.001. Comparison between 200 and 0 μM cystine conditions for each cell line at endpoint: ###p<0.001. I. Relative viabilities of AsPC1 control and PKM2KO clones under a range of cystine concentrations from 200 μM to 0 μM. Significance was assessed by two-way ANOVA and Dunnet test. *p<0.05.
Figure 2.
Figure 2.. PKM2KO improves defense against cystine depletion induced ferroptosis in PDAC.
A, B. Relative viabilities of AsPC1 (A) and Panc1 (B) control and PKM2KO cells under 50 μM cystine (+) and 0 μM cystine (−) co-treated with 5 μM ferrostatin-1 (FER), 100 μM trolox (TRO), 100 μM deferoxamine (DFO), 50 μM Z-VAD-FMK (ZVAD), or 10 μM necrostatin-1S (NEC). Significance by two-way ANOVA. *p<0.05, ***p<0.001. Multiple hypothesis correction by Tukey test. C. Relative lipid peroxidation of AsPC1 control and PKM2KO cells under 50 μM cystine, 0 μM cystine, and 0 μM cystine with 5 μM FER1, visualized by C11-BODIPY. D. Representative brightfield and fluorescent images of AsPC1 cell lipid peroxidation quantified in panel C. Scale bar = 50 μm. E. Relative lipid peroxidation of Panc1 control and PKM2KO cells under 50 μM cystine and 0 μM cystine, visualized by C11-BODIPY. For C and E, significance was assessed by two-way ANOVA. *p<0.05, ***p<0.001. Multiple hypothesis correction by Tukey test.
Figure 3.
Figure 3.. Pyruvate kinase activity dictates response to cystine starvation induced ferroptosis.
A. Relative PK activity in AsPC1 control and PKM2KO cells under 50 μM (+) and 0 (−) μM cystine. Significance was assessed by two-way ANOVA. *p<0.05, ***p<0.001. Multiple hypothesis correction by Tukey test. B. Schematic showing TEPP-46 promoting the formation of the active tetrameric form of PKM2 and compound 3k inhibiting tetramer formation, producing the less active dimeric form of PKM2. C-F. Relative viabilities at 50 μM and 0 μM cystine with (+) or without (−) treatment of 10 μM compound 3k in WT cells: AsPC1 (C), Panc1 (D), MiaPaCa2 (E), and BxPC3 (F). Significance was assessed by two-way ANOVA. *p<0.05, **p<0.01, ***p<0.001. Multiple hypothesis correction by Tukey test. G-J. The effect of IKE and TEPP-46 combination treatment in the range of the indicated concentrations in AsPC1 WT cells (G), Panc1 WT cells (H), MiaPaCa2 WT cells (I), and BxPC3 WT cells (J). K. Relative viability of AsPC1 WT cells with (+) or without (−) treatment with 5 μM IKE and 12.5 μM TEPP-46. L. Relative viability of Panc1 WT cells with (+) or without (−) treatment with 0.625 μM IKE and 12.5 μM TEPP-46. M. Relative viability of MiaPaCa2 WT cells with (+) or without (−) treatment with 0.625 μM IKE and 12.5 μM TEPP-46. N. Relative viability of BxPC3 WT cells with (+) or without (−) treatment with 5 μM IKE and 12.5 μM TEPP-46. For L-N, significance was assessed by two-way ANOVA. *p<0.05, **p<0.01, ***p<0.001. Multiple hypothesis correction by Tukey test.
Figure 4.
Figure 4.. PKM2KO enhances defense against ferroptosis induction specific to cystine starvation.
A. Schematic of the mechanism of ferroptosis, the defense proteins xCT and GPX4 (the targets of imidazole ketone erastin (IKE) and Ras selective lethal 3 (RSL3), respectively), and the ferroptosis, apoptosis, and necroptosis inhibitors used in the study. B. Western blot of xCT and GPX4 expression in AsPC1 control and PKM2KO cells under 50 μM (+) and 0 μM (−) cystine. C, E. Concentration dependent response in viability of AsPC1 (C) and Panc1 (E) control and PKM2KO clones to a range of IKE concentrations from 50–0 μM. D, F. Concentration dependent viability responses of AsPC1 (D) and Panc1 (F) control and PKM2KO clones to a range of RSL3 concentrations from 10–0 μM. For C-F, significance is determined two-way ANOVA. *p<0.05, ***p<0.01, ***p<0.001. Multiple hypothesis correction by the Dunnet test. G, H. Relative viabilities of AsPC1 (G) and Panc1 (H) control and PKM2KO cells under 50 μM cystine with 5 μM IKE (+) co-treated with 5 μM ferrostatin-1 (FER), 100 μM trolox (TRO), 100 μM deferoxamine (DFO), 50 μM Z-VAD-FMK (ZVAD), or 10 μM necrostatin-1S (NEC). Significance was assessed by two-way ANOVA. *p<0.05, ***p<0.001. Multiple hypothesis correction by Tukey test. I. Growth of xenograft tumors produced from AsPC1 control and PKM2KO cells treated with vehicle control or 50 mg/kg IKE. Significance was assessed by two-way ANOVA at end point. *p<0.05, ***p<0.001, ns = non-significant. Multiple hypothesis correction by Tukey test.
Figure 5.
Figure 5.. PKM2KO PDACs exhibit increased glutamine anaplerosis and decreased glucose metabolism under cystine starvation.
A-F. Stable isotope tracing of 13C1,2-glucose under 50 μM (+) and 0 μM (−) cystine for 4 hours in AsPC1 control and PKM2KO clone #1 to produce M+2 labeled hexose-phosphate (A), lactate (B), citrate (C), α-ketoglutarate (D), malate (E), and aspartate (F). G-K Stable isotope tracing of 13C5-glutamine under 50 μM (+) and 0 μM (−) cystine for 24 hours in AsPC1 control and PKM2KO clone #1 to produce M+5 labeled glutamate (G), secreted glutamate (H), α-ketoglutarate (I), glutathione (L), M+4 labeled malate (J), and aspartate (K). Significance was assessed by two-way ANOVA. *p<0.05, **p<0.01, ***p<0.001. Multiple hypothesis correction by Tukey test.
Figure 6.
Figure 6.. Glutamine is required for PKM2KO PDAC defense against cystine starvation induced ferroptosis.
A, B. Relative viabilities of AspC1 (A) and Panc1 (B) control and PKM2KO cells under 50 μM cystine with (+) or without (−) 1 mM glutamine treated with 5 μM IKE. C. Relative viabilities of AsPC1 control and PKM2KO cells under 50 μM (+) and 0 μM (−) cystine with (+) or without (−) 1 mM glutamine. D. Relative lipid peroxidation in AsPC1 Control and PKM2KO clone #1 under 50 μM (+) or 0 μM (−) cystine with (+) or without (−) 1 mM glutamine. For A-D, significance was assessed by two-way ANOVA. *p<0.05, **p<0.01, ***p<0.001. Multiple hypothesis correction by Tukey test. E, F. Western blot of xCT and GPX4 expression in AsPC1 (A) and Panc1 (F) cells under 50 μM (+) and 0 μM (−) cystine with (+) or without (−) 1 mM glutamine. G-I. Relative viabilities of AsPC1 control and PKM2KO clones under 50 μM (+) or 0 μM (−) cystine with (+) or without (−) 1 mM glutamine supplemented with either 8 mM dimethyl-α-ketoglutarate (αKG), 8 mM dimethyl-succinate (Suc), or 32 mM dimethyl-malate (Mal). Significance was assessed by one-way ANOVA. *p<0.05, **p<0.01, ***p<0.001. Multiple hypothesis correction by Sidak test.
Figure 7.
Figure 7.. Malic enzyme enables survival of PKM2KO PDAC under cystine starvation.
A, B. Western blot of malic enzyme 1 (ME1) expression in AsPC1 (A) and Panc1 (B) control cells and PKM2KO clones under 50 μM (+) or 0 μM (−) cystine conditions. C-G. Relative viabilities of Panc1 control cells (C), Panc1 PKM2KO #1 (D), Panc1 PKM2KO #2 (E), AsPC1 control cells (F), and AsPC1 PKM2KO clone #1 (G) under 0 μM cystine treated with (+) or without (−) 50 μM malic enzyme 1 inhibitor (ME1i) and co-treated with either 5 μM ferrostatin-1 (FER) or 1 mM N-acetylcysteine (NAC). H, I. Relative viabilities of AsPC1 control (H) and PKM2KO clone #1 (I) under 50 μM (+) or 0 μM (−) cystine with (+) or without (−) 50 μM ME1i and 32 mM dimethyl-malate (Mal) supplement. For C-I, significance was assessed by one-way ANOVA. *p<0.05, **p<0.01, ***p<0.001. Multiple hypothesis correction by Sidak test. J, K. Relative NADPH abundance in AsPC1 (J) and Panc1 (K) control and PKM2KO clones under 50 or 0 μM cystine. For J-K, significance was assessed by two-way ANOVA. *p<0.05, **p<0.01, ***p<0.001. Multiple hypothesis correction by Tukey test. L-M. Proposed model on how PK reprograms metabolism to influence cystine starvation induced ferroptosis under low PK activity (L) and high PK activity (M).
Figure 8.
Figure 8.. The combination of pyruvate activation and cystine starvation is an efficacious treatment for PDAC in vivo.
A. Treatment schematic for xenograft tumors formed from Panc1 WT cells, treated daily for 2 weeks with vehicle control, IKE, TEPP-46, or IKE and TEPP-46 combined. N=6 for each treatment group, except IKE and TEPP-46 combination with N=4. B. Tumor volume of xenograft tumors for each treatment group over time. C. Tumor weight at end point for each treatment group. For B-C, significance was assessed by one-way ANOVA at end point. *p<0.05, **p<0.01, ns = non-significant. Multiple hypothesis correction by Sidak test. D. Images of tumors for each treatment group at end point. E. Body weight of treated mice throughout the treatment course.

Similar articles

References

    1. Wood L. D., Canto M. I., Jaffee E. M. & Simeone D. M. Pancreatic Cancer: Pathogenesis, Screening, Diagnosis, and Treatment. Gastroenterology 163, 386–402.e1 (2022). - PMC - PubMed
    1. Halbrook C. J. & Lyssiotis C. A. Employing Metabolism to Improve the Diagnosis and Treatment of Pancreatic Cancer. Cancer Cell 31, 5–19 (2017). - PubMed
    1. Rahib L. et al. Projecting Cancer Incidence and Deaths to 2030: The Unexpected Burden of Thyroid, Liver, and Pancreas Cancers in the United States. Cancer Res 74, 2913–2921 (2014). - PubMed
    1. Cancer Facts & Figures 2023. (2023).
    1. Andersson R., Pereira C.-F., Bauden M. & Ansari D. Is immunotherapy the holy grail for pancreatic cancer? Immunotherapy 11, 1435–1438 (2019). - PubMed

Publication types