[Preprint]. 2023 Sep 12:2023.09.08.556867.
doi: 10.1101/2023.09.08.556867.

Multi-OMIC analysis of Huntington disease reveals a neuroprotective astrocyte state

Affiliations

Multi-OMIC analysis of Huntington disease reveals a neuroprotective astrocyte state

Fahad Paryani et al. bioRxiv. .

Update in

  • Multi-omic analysis of Huntington's disease reveals a compensatory astrocyte state.
    Paryani F, Kwon JS, Ng CW, Jakubiak K, Madden N, Ofori K, Tang A, Lu H, Xia S, Li J, Mahajan A, Davidson SM, Basile AO, McHugh C, Vonsattel JP, Hickman R, Zody MC, Housman DE, Goldman JE, Yoo AS, Menon V, Al-Dalahmah O. Paryani F, et al. Nat Commun. 2024 Aug 8;15(1):6742. doi: 10.1038/s41467-024-50626-0. Nat Commun. 2024. PMID: 39112488 Free PMC article.

Abstract

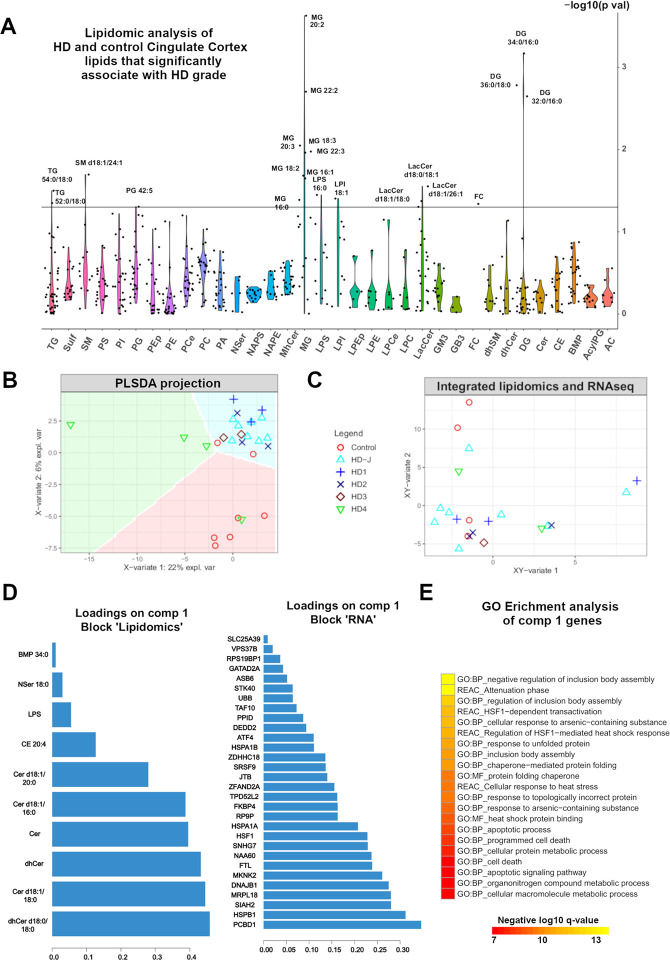
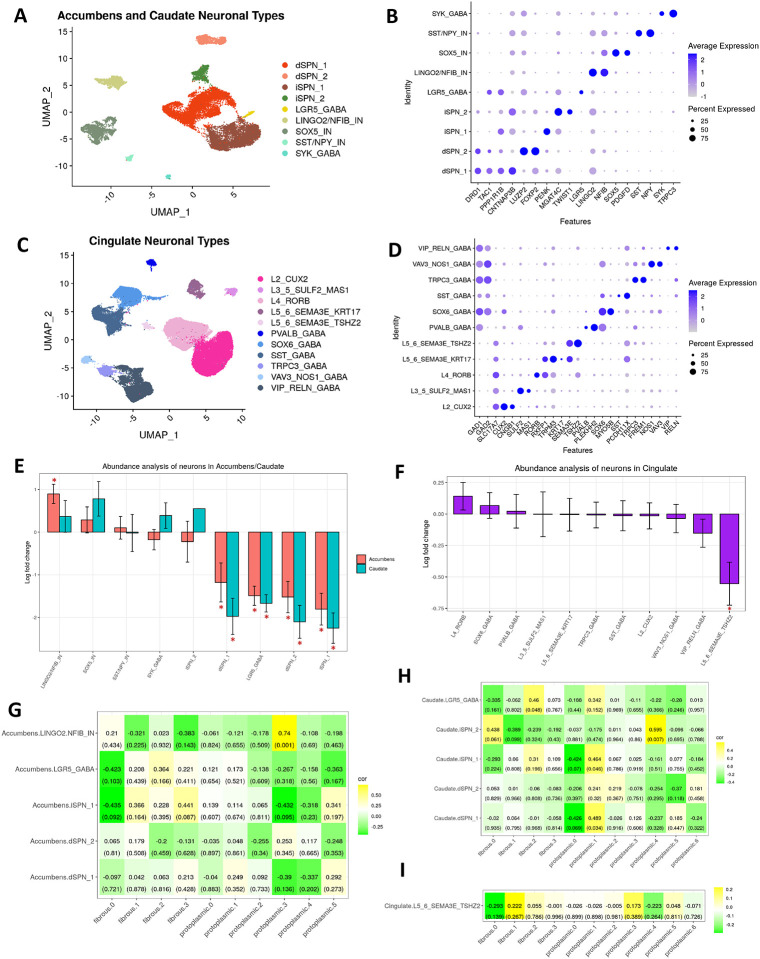
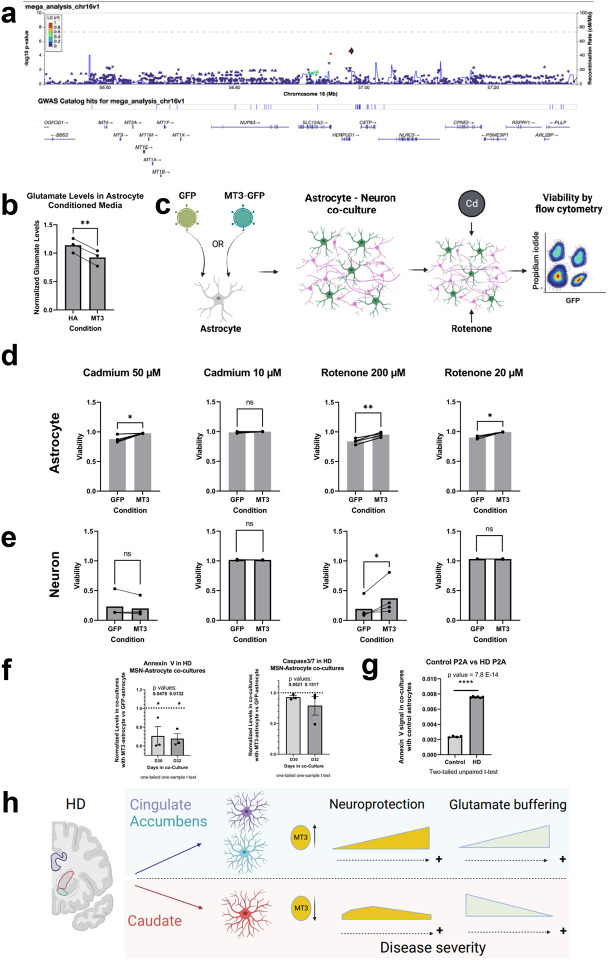
Huntington disease (HD) is an incurable neurodegenerative disease characterized by neuronal loss and astrogliosis. One hallmark of HD is the selective neuronal vulnerability of striatal medium spiny neurons. To date, the underlying mechanisms of this selective vulnerability have not been fully defined. Here, we employed a multi-omic approach including single nucleus RNAseq (snRNAseq), bulk RNAseq, lipidomics, HTT gene CAG repeat length measurements, and multiplexed immunofluorescence on post-mortem brain tissue from multiple brain regions of HD and control donors. We defined a signature of genes that is driven by CAG repeat length and found it enriched in astrocytic and microglial genes. Moreover, weighted gene correlation network analysis showed loss of connectivity of astrocytic and microglial modules in HD and identified modules that correlated with CAG-repeat length which further implicated inflammatory pathways and metabolism. We performed lipidomic analysis of HD and control brains and identified several lipid species that correlate with HD grade, including ceramides and very long chain fatty acids. Integration of lipidomics and bulk transcriptomics identified a consensus gene signature that correlates with HD grade and HD lipidomic abnormalities and implicated the unfolded protein response pathway. Because astrocytes are critical for brain lipid metabolism and play important roles in regulating inflammation, we analyzed our snRNAseq dataset with an emphasis on astrocyte pathology. We found two main astrocyte types that spanned multiple brain regions; these types correspond to protoplasmic astrocytes, and fibrous-like - CD44-positive, astrocytes. HD pathology was differentially associated with these cell types in a region-specific manner. One protoplasmic astrocyte cluster showed high expression of metallothionein genes, the depletion of this cluster positively correlated with the depletion of vulnerable medium spiny neurons in the caudate nucleus. We confirmed that metallothioneins were increased in cingulate HD astrocytes but were unchanged or even decreased in caudate astrocytes. We combined existing genome-wide association studies (GWAS) with a GWA study conducted on HD patients from the original Venezuelan cohort and identified a single-nucleotide polymorphism in the metallothionein gene locus associated with delayed age of onset. Functional studies found that metallothionein overexpressing astrocytes are better able to buffer glutamate and were neuroprotective of patient-derived directly reprogrammed HD MSNs as well as against rotenone-induced neuronal death in vitro. Finally, we found that metallothionein-overexpressing astrocytes increased the phagocytic activity of microglia in vitro and increased the expression of genes involved in fatty acid binding. Together, we identified an astrocytic phenotype that is regionally-enriched in less vulnerable brain regions that can be leveraged to protect neurons in HD.


Conflict of interest statement

Competing interests The authors declare no competing interests.

Figures

Figure 1.
Figure 1.
Transcriptomic analysis of HD identifies cross-regional and CAG-correlated gene signatures. A) Cartoon depicting experimental plan. B) t-distributed stochastic neighbor (tSNE) embedding of bulk RNAseq samples used in the study color-coded by condition (left), anatomic region (middle), and CAG repeat length (right). Control samples and ones with no available CAG repeat lengths are shown in grey. C) Heatmap of normalized gene expression showing a select subset of DEGs. The differentially expressed genes (DEGs - rows) are color-coded on the right by the direction of differential expression (Control -red vs HD – blue vs non significant (NS) – grey), and anatomic region where comparisons are significant (Sign_Acc: Accumbens, Sign_Caud: Caudate, Sign_Cing: Cingulate). The samples (Columns) are also color-coded by HD grade/Condition (Con: Control, HD1–4: 1–4, J: Juvenile onset HD). D) Venn diagram showing the overlap between DEGs – increased – black; and decreased – blue across the anatomic regions indicated. The genes consider for this analysis were considered significant if the adjusted p value was less than 0.05. E) Scatter plot showing genes with significant correlation with CAG repeat length. The correlation coefficient is shown on the y-axis, the order of genes on the x-axis is random. Color indicates adjusted p value. Genes with coefficients two standard deviations above the mean are indicated. F-G) EnrichR bar plots of KEGG pathways enriched in genes that positively or negatively correlate with CAG repeat length (F) or DEGs shared that are shared across two or three anatomic regions (increased and decreased - G).
Figure 2.
Figure 2.
Lipidomic analysis of HD cingulate cortex. A) Violin plot of the -log10 of the p values of lipid species that significantly correlate with HD grade – see Figure S3A for details. B) Scatter plot showing the projection of lipidomics samples in the first two latent variables of the sparse-Partial least squares (sPLS) discriminant analysis model. The variance explained by each latent variable is indicated on the axes. The samples are color- and shape-coded by Condition/grade. The Condition can be predicted to a high degree of accuracy in the colored background regions - see also Figure S3B. C) Integration of lipidomics data and match bulk RNAseq data generated from the same samples using sPLS. The samples are color- and shape-coded as per B and projected in the combined integrated sPLS space. D) The loadings of the lipid species (left) and RNA transcripts (right) with strong positive correlation with the first sPLS latent variable that predicts grade are shown. E) Gene ontology enrichment analysis of component 1 genes. Negative log 10 of the adjusted p values are indicated.
Figure 3.
Figure 3.. snRNAseq data analysis of HD and control astrocytes.
A) tSNE projection of snRNAseq samples across all lineages (left), brain regions (middle), and condition (right). B) Stacked bar plot depicting the proportion (y-axis) of each cell lineage (color-coded) in different brain regions (x-axis). C) Dot plot showing select marker genes for each cell type/lineage. D) UMAP plot of the astrocytes snRNAseq profiles projected in isolation of other cell types, and color-coded by region. E) Feature plots of normalized gene expression projected in the UMAP embedding to highlight genes that differentiate fibrous-like (left) and protoplasmic astrocytes (right) – see also Figure S5. F) Sub-clusters of fibrous-like astrocytes (defined by highest expression of CD44 - cluster 0 see Figures S5D–E) and a bar plot displaying the proportion of different brain regions in each cluster (F’) and the proportion of clusters in each HD grade/Condition (F”). G) Sub-clusters of protoplasmic astrocytes (defined as all astrocytes except cluster 0 in Figure S5D) along with similar bar plots showcasing proportions of region (G’) in each cluster and proportion of cluster by HD grade/Condition (G”).
Figure 4.
Figure 4.. Astrocytes are regionally heterogeneous in HD.
A) Dot plot displaying the expression of various genes from four different gene sets (Quiescent Genes = baseline astrocyte genes, Neuroprotective Genes as predicted from our previous work, CAG-correlated genes = genes with significant positive regression weights - see Figure 1E for more details, RNA-correlated Lipid Genes = set of genes that correlated with lipid abundance from Figure S3D. B) UMAP embedding of fibrous-like astrocytes. C) Heatmap of the average GSVA (gene set variation analysis) score within each cluster and brain region combination in fibrous-like astrocytes across the four gene sets described in A. D) Venn diagram analysis of DEGs in fibrous-across the three brain regions (increased: blue; decreased: black). E) Dot plot of same gene sets in (A) but for protoplasmic astrocytes. F) UMAP embedding of protoplasmic astrocytes. G) Similar GSVA analysis as (C) but for protoplasmic astrocytes. H) Similar DEG analysis as (D) but for protoplasmic astrocytes. I) Heatmap displaying the log10(p-value) of select GO terms (columns): red indicates terms significantly enriched in DEGs increased in HD, blue indicates GO terms enriched in DEGs significantly decreased in HD, and white indicates no significance. This is presented for fibrous-like and protoplasmic astrocytes (rows).
Figure 5.
Figure 5.. Pseudotime analysis reveals diverse astrocytic gene programs in HD.
A) PHATE embeddings of protoplasmic astrocytes in the caudate nucleus and cingulate cortex along with pseudotime trajectories color-coded by pseudotime value. The principal graphs are indicated as black lines, and the cells are colored by their pseudotime values along each trajectory. In each plot, cells colored grey do not vary along the plotted trajectory. B) Histograms showing the pseudotime values of astrocytes as assigned by clusters (Figure 4F) in each trajectory and respective brain region. C) Same as B but showing astrocytes by HD Vonsattel grade. D) PHATE embeddings of fibrous-like astrocytes in the caudate nucleus along with pseudotime trajectories and color-coded by pseudotime values – same as A. E) Similar analysis as (B) but for fibrous-like astrocytes. F) Similar analysis as (C) but for fibrous-like astrocytes. G) Heatmap displaying the log10(p-value) of the GO terms enriched in the DEGs between the cells with highest vs lowest pseudotime values for each individual trajectory as implemented in Tradeseq. Red and blue colors indicate GO terms significantly enriched in DEGs increased and decreased along the trajectory, respectively. White color indicates no significance. H) Heatmap displaying the normalized enrichment score for GSEA analysis on our four gene sets discussed in (Figure 4A) with stars indicating if the enrichment is significant, using pre-ranked GO enrichment analysis.
Figure 6.
Figure 6.. Differential abundance analysis of neurons in HD shows correlations to astrocytic states.
A) UMAP plot of nucleus accumbens and caudate neuronal subtypes. B) Dot plot of gene markers that identify neuronal subtypes from accumbens and caudate cells in (A). C) UMAP plot of cingulate neuronal subtypes. D) Dot plot of gene markers for neuronal clusters from the cingulate (C). E) Differential abundance comparing the enrichment or depletion of neuronal subtypes in (A) in HD versus control. The logFC differences are shown on the y-axis. Starred plots indicate statistically significant differences. Error bars indicate SEM. F) Similar analysis as out but for cingulate cells from (C). G) Heatmap displaying the correlation of fibrous-like and protoplasmic sub-clusters, from Figures 3F–G, with proportions of neuronal clusters. The top value in each tile represents the Pearson correlation coefficient with its respective p-value below in parentheses. H) Similar analysis as (G) but for caudate neurons only from (A). I) Similar analysis as (G) but for cingulate neurons only from (C).
Figure 7.
Figure 7.. MT3 expression is Increased in the Cingulate and is Decreased in the Caudate of HD brains.
A) Immunofluorescent images of the Caudate labeled for nuclei (DAPI-blue) and GFAP (green) to detect astrocytes (left), and MT (red-middle panel). A merged panel is shown on the right. Arrows indicate DAPI, GFAP and MT positive cells (MT positive astrocytes) and arrowheads indicate MT negative astrocytes. The antibody detects MT2A and MT1 proteins. Scale bar=50μm. B) Quantification of the percent of MT positive astrocytes in the Caudate. Unpaired one-tailed T-test with N=7 for control and HD. Data is shown as mean +/− SEM. P value= 0.3232. C) Immunofluorescent images of the Caudate labeled for nuclei (DAPI-blue) and GFAP (green) to detect astrocytes (left panel), and MT3 (red-middle panel). A merge of the three channels is shown on the right. Arrows indicate DAPI, GFAP and MT3 positive cells (MT3 positive astrocytes) and arrowheads indicate MT3 negative astrocytes. Scale bar=50μm. D) Quantification of the percent of MT3 positive astrocytes in the Caudate. Unpaired one-tailed T-test used with N=10 for control and 5 for HD. Data is shown as mean +/− SEM. P value= 0.0120. E) Same as D bur for the cingulate. F) Quantification of the percent of MT3 positive astrocytes in the Cingulate. Unpaired one-tailed T-test with N=8 for control and 6 for HD. Data is shown as mean +/− SEM. P value= 0.0405. For all IHC panels, control and HD images are shown on the top and bottom rows, respectively.
Figure 8.
Figure 8.. Metallothioneins are implicated in GWAS studies and are neuroprotective.
A) GWA for HD residual age of onset identifies a significant signal within the metallothionein (mt) cluster of genes on chromosome 16. LocusZoom plot of the metallothionein (mt) gene cluster on chromosome 16 association with HD residual age of motor onset utilizing a linear mixed model. For each SNP in the association analysis, the log-transformed p-value of significance is graphed on the y-axis. SNPs are color-coded according to their correlation (r2) with the representative SNP rs74611520, as indicated by the diamond – the two neighboring SNPs that are in linkage disequilibrium with this SNP are indicated by the red triangles - rs2518054, rs3812963. This study combines data from the Venezuelan Kindreds and GeM-HD consortium of patients. B) Glutamate level measurement in conditioned media by control and MT3 astrocytes. C) A cartoon depiction of the design of the astrocyte-neuron co-culture viability experiment. D) Bar plots of the viability of control GFP vs MT3 overexpressing astrocytes when incubated in co-cultures with murine neurons under the indicated conditions. E) Bar plots of murine neuron viability when co-cultured with control GFP astrocytes GFP vs MT3 overexpressing astrocytes across the same set of conditions as in D. F) Expression of Annexin V and Caspase 3/7 in HD-derived directly reprogrammed MSNs co-cultured with control (GFP) versus MT3 astrocytes. The values are expressed as fold change from control. N=3 biological replicates. The p values are indicated. One-tailed one sample t-test. G) Example of Annexin V signal in control versus HD derived directly reprogrammed MSNs co-cultured with control astrocytes at day 30 demonstrating significant neurodegeneration in HD co-cultures evidenced by the increase in Annexin V signal. N= 4 and 6 technical replicates for control and HD, respectively, unpaired t-test, the p values are indicated. H) Cartoon illustration of astrocytic regional heterogeneity in HD and how that relates to neuroprotection.

References

    1. Hirano M. et al. Clinicopathological differences between the motor onset and psychiatric onset of Huntington’s disease, focusing on the nucleus accumbens. Neuropathology 39, 331–341 (2019). - PubMed
    1. Hebb M.O., Denovan-Wright E.M. & Robertson H.A. Expression of the Huntington’s disease gene is regulated in astrocytes in the arcuate nucleus of the hypothalamus of postpartum rats. FASEB J 13, 1099–1106 (1999). - PubMed
    1. DiFiglia M. et al. Aggregation of huntingtin in neuronal intranuclear inclusions and dystrophic neurites in brain. Science 277, 1990–1993 (1997). - PubMed
    1. Mangiarini L. et al. Exon 1 of the HD gene with an expanded CAG repeat is sufficient to cause a progressive neurological phenotype in transgenic mice. Cell 87, 493–506 (1996). - PubMed
    1. Vonsattel J.P. et al. Neuropathological classification of Huntington’s disease. J Neuropathol Exp Neurol 44, 559–577 (1985). - PubMed

Publication types