[Preprint]. 2023 Oct 12:2023.06.06.543964.
doi: 10.1101/2023.06.06.543964.

The white-footed deermouse, an infection-tolerant reservoir for several zoonotic agents, tempers interferon responses to endotoxin in comparison to the mouse and rat

Affiliations

The white-footed deermouse, an infection-tolerant reservoir for several zoonotic agents, tempers interferon responses to endotoxin in comparison to the mouse and rat

Ana Milovic et al. bioRxiv. .

Update in

Abstract

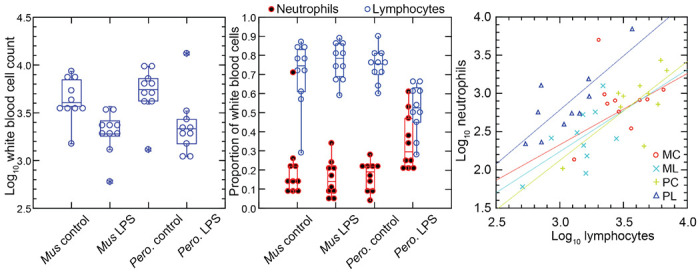
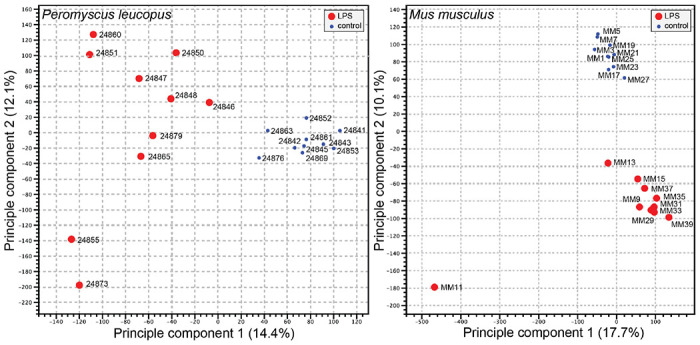
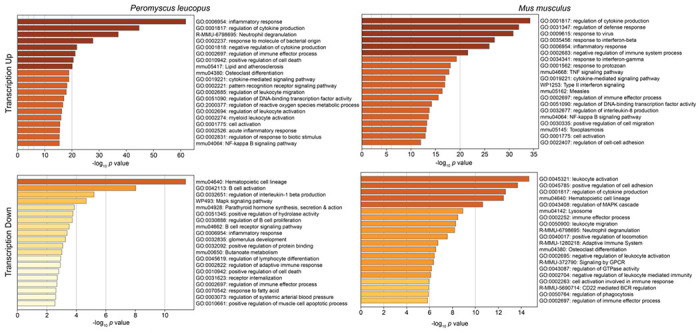
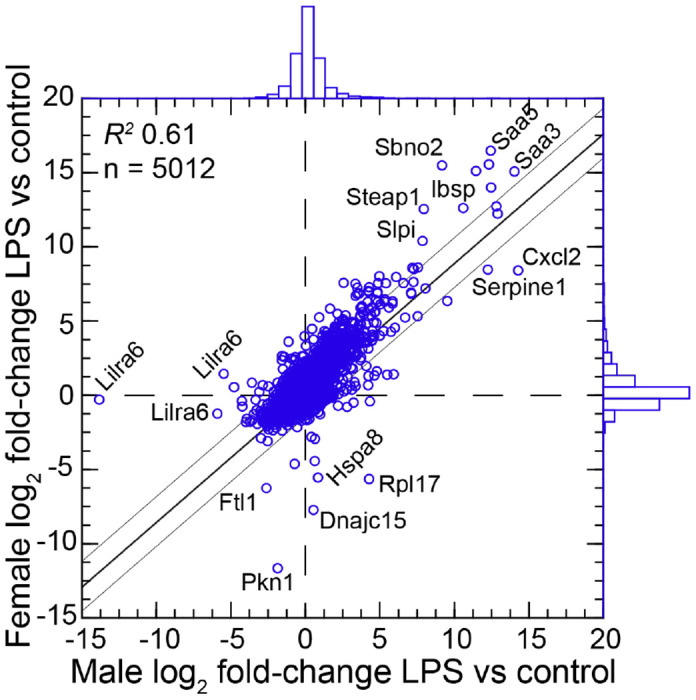
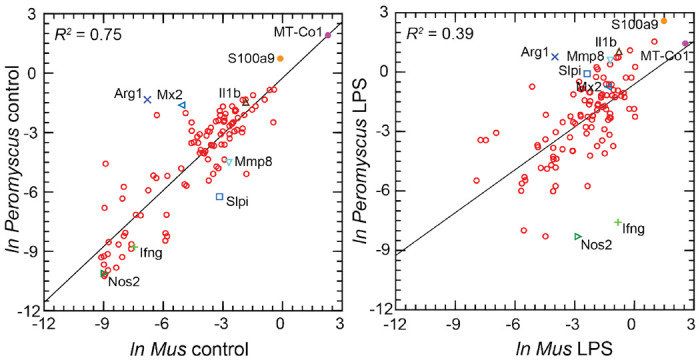
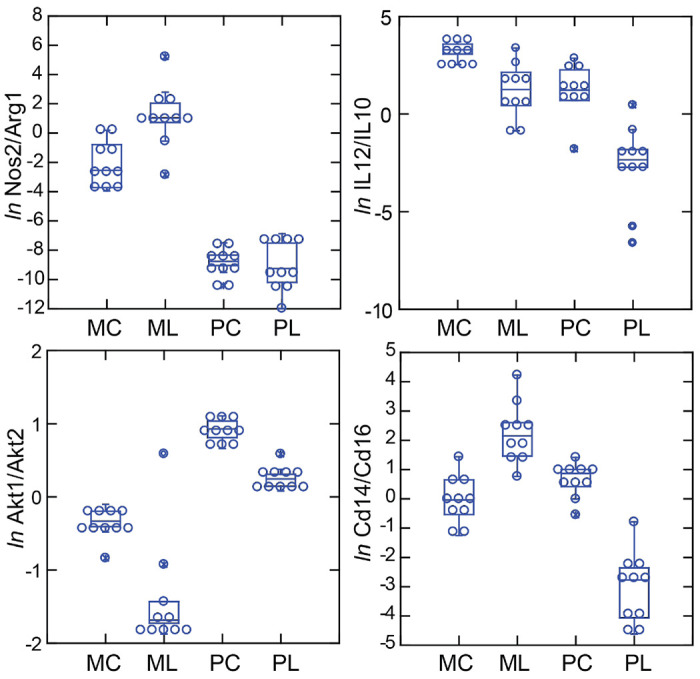
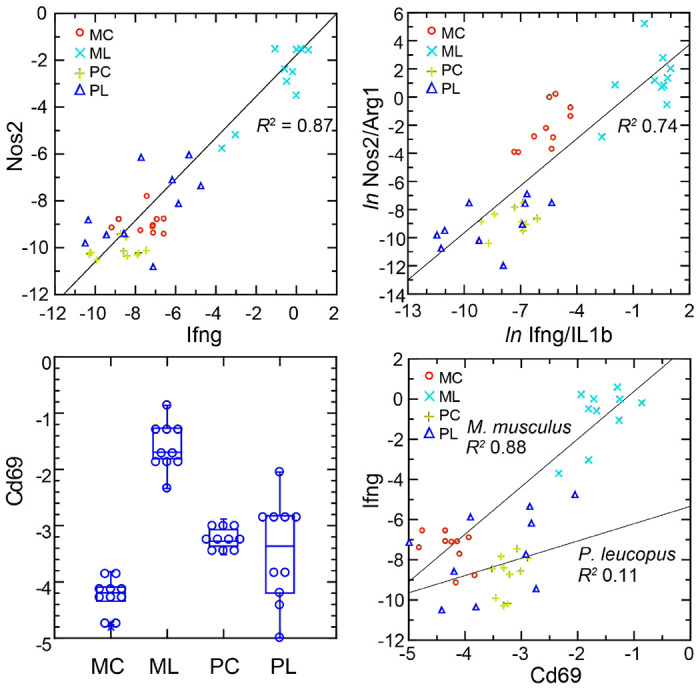
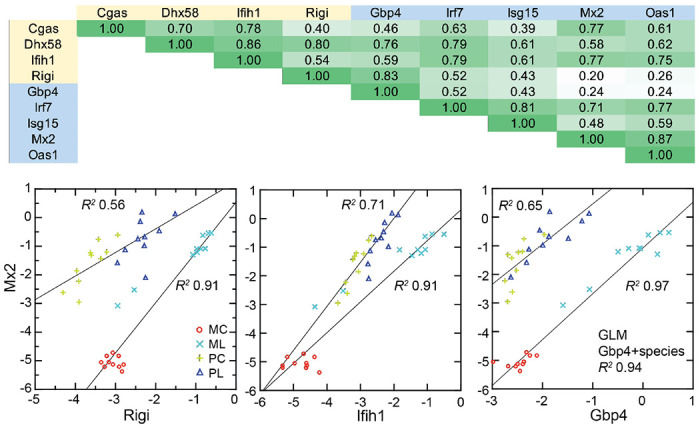
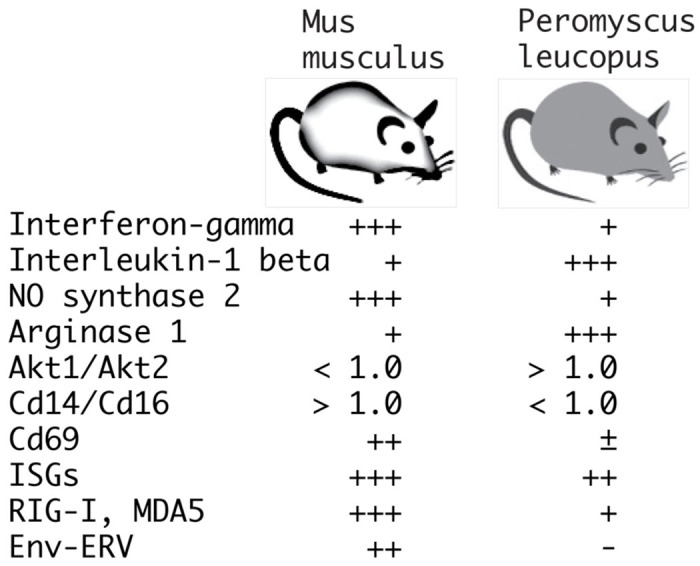
The white-footed deermouse Peromyscus leucopus, a long-lived rodent, is a key reservoir for agents of several zoonoses, including Lyme disease. While persistently infected, this deermouse is without apparent disability or diminished fitness. For a model for inflammation elicited by various pathogens, the endotoxin lipopolysaccharide (LPS) was used to compare genome-wide transcription in blood by P. leucopus, Mus musculus and Rattus norvegicus and adjusted for white cell concentrations. Deermice were distinguished from the mice and rats by LPS response profiles consistent with non-classical monocytes and alternatively-activated macrophages. LPS-treated P. leucopus, in contrast to mice and rats, also displayed little transcription of interferon-gamma and lower magnitude fold-changes in type 1 interferon-stimulated genes. This was associated with comparatively reduced transcription of endogenous retrovirus sequences and cytoplasmic pattern recognition receptors in the deermice. The results reveal a mechanism for infection tolerance in this species and perhaps other animal reservoirs for agents of human disease.

Keywords: endogenous retroviruses; innate immunity; interferon stimulated genes; interferon-gamma; lipopolysaccharide; pathogen recognition receptors; type 1 interferons.


Figures

Figure 1.
Figure 1.
Total white blood cells, neutrophils, and lymphocytes of Mus musculus (M) and Peromyscus leucopus (P) with or without (control; C) treatment with 10 μg lipopolysaccharide (LPS; L) per g body mass 4 h previous. The box plots of left and center panels show values of individual animals and compiled median, quartiles, and extreme values. The linear regressions of the right panel are color-coded according to the species and treatment designations. The outlier value for a M. musculus control (MM17) was excluded from the linear regression for that group.
Figure 2.
Figure 2.
Principle component analysis of genome-wide RNA-seq data of P. leucopus or M. musculus with or without (blue dot) treatment with LPS 4 h previous. The individual animals listed in Table 1 are indicated on the graphs. The insets indicate the size and color of the symbol for the experimental condition (LPS-treated or control).
Figure 3.
Figure 3.
Gene Ontology (GO) term clusters associated with up-regulated genes (upper panels) and down-regulated genes (lower panels) of P. leucopus (left panels) and M. musculus (right panels) treated with LPS in comparison with untreated controls of each species. The scale for the x-axes for the panels was determined by the highest −log10 p values in each of the 4 sets. The horizontal bar color, which ranges from white to dark brown through shades of yellow through orange in between, is a schematic representation of the −log10 p values.
Figure 4.
Figure 4.
Scatter plot with linear regression of pairs of log2-transformed mean fold-changes between LPS-treated and control P. leucopus by male and female sex. The 5012 reference transcripts from the genome reference set are defined in the text and listed in Table S2 and Dryad Table D5. The coefficient of determination (R2), the 95% upper and lower prediction limits for the regression line, and distributions of the values on the x- and y-axes are shown. Selected genes for which their x-y coordinates fall outside the limits of prediction are labeled. Cxcl2, Ibsp, Saa3, Saa5, Sbno2, Serpine1, Slpi, and Steap1 were noted as up-regulated DEGs for the groups with both sexes (Table S1).
Figure 5.
Figure 5.
Scatter plots with linear regression of pairs of log-transformed (In) normalized RNA-seq reads for selected coding sequences for control P. leucopus and M. musculus (left panel) and LPS-treated P. leucopus and M. musculus (right panel). The R2 values and selected genes (each with a different symbol) are indicated in each graph.
Figure 6.
Figure 6.
Box plots of log-transformed ratios of four pairs of gene transcripts from targeted RNA-seq analysis of blood of P. leucopus (P) or M. musculus (M) with (L) or without (C) treatment with LPS. The values are from Table S4. Upper left, Nos2/Arg1. Upper right, IL12/IL10. Lower left, Akt1/Akt2. Lower right, Cd14/Cd16.
Figure 7.
Figure 7.
Transcripts of interferon-gamma and interleukin-1 beta by targeted RNA-seq of the blood of P. leucopus (P) or M. musculus (M) with (L) or without (C) treatment with LPS. The top panels are box plots of the individual values. The lower left panel is a scatter plot of interleukin-1 β on interferon- γ values. The lower right panel is a Discriminant Analysis of these pairs of values where Factor 1 corresponds to interferon-gamma, and Factor 2 corresponds to interleukin-1 beta. Values for analysis are in Table S4.
Figure 8.
Figure 8.
Normalized transcripts of Nos2, Ifng, and Cd69 in targeted RNA-seq analysis of blood of P. leucopus (P) or M. musculus (M) with (L) or without (C) treatment with LPS. Upper left: scatter plot of individual values for Nos2 on Ifng with linear regression curve and coefficient of determination (R2). Upper right: natural logarithm (ln) of ratios of Nos2/Argi1 on Ifng/IL1b with regression curve and R2. Lower left: Box plots of individual values of normalized transcripts of Cd69. Lower right: Scatter plot of Ifng on Cd69 with separate regression curves and R2 values for M. musculus and P. leucopus. Values for analysis are in Table S4. Box plots for Nos2 and Arg1 are provided in Figure S5, and box plots for Ifng and Il1b are provided in Figure 7.
Figure 9.
Figure 9.
Co-variation between transcripts for selected PRRs and ISGs in the blood of P. leucopus (P) or M. musculus (M) with (L) or without (C) LPS treatment. Top panel: matrix of coefficients of determination (R2) for combined P. leucopus and M. musculus data. PRRs are indicated by yellow fill and ISGs by blue fill on horizontal and vertical axes. Shades of green of the matrix cells correspond to R2 values, where cells with values less than 0.30 have white fill and those of 0.90-1.00 have deepest green fill. Bottom panels: scatter plots of log-transformed normalized Mx2 transcripts on Rigi (left), Ifih1 (center), and Gbp4 (right). The linear regression curves are for each species. For the right-lower graph the result from the General Linear Model (GLM) estimate is also given. Values for analysis are in Table S4; box plots for Gbp4, Irf7, Isg15, Mx2, and Oas1 are provided in Figure S6.
Figure 10.
Figure 10.
Scatter plots of endogenous retrovirus (ERV) Env and Gag-pol protein gene transcription (left) and association of ERV Env with Rigi transcription (right) in the blood of P. leucopus (Pero; P), M. musculus (Mus; M), or R. norvegicus (Rattus) with (L) or without (control; C) treatment with LPS. In right panel the linear regression curve and coefficients of determination (R2) for P. leucopus and M. musculus are shown. Values for analysis are in Table S4; box plots for ERV Env and ERV Gag-pol are provided in Figure S7.
Figure 11.
Figure 11.
Summary of distinguishing features of transcriptional responses in the blood between P. leucopus and M. musculus 4 h after treatment with LPS. There is semi-quantitative representation of relative transcription of selected coding sequences or ratios of transcription for selected pairs of genes in the blood.

Similar articles

References

    1. Arranz A, Doxaki C, Vergadi E, Martinez de la Torre Y, Vaporidi K, Lagoudaki ED, Ieronymaki E, Androulidaki A, Venihaki M, Margioris AN. Akt1 and Akt2 protein kinases differentially contribute to macrophage polarization. Proc Natl Acad Sci U S A. 2012;109(24):9517–22. - PMC - PubMed
    1. Ashburner M, Ball CA, Blake JA, Botstein D, Butler H, Cherry JM, Davis AP, Dolinski K, Dwight SS, Eppig JT, Harris MA, Hill DP, Issel-Tarver L, Kasarskis A, Lewis S, Matese JC, Richardson JE, Ringwald M, Rubin GM, Sherlock G. Gene Ontology: tool for the unification of biology. Nature Genet. 2000;25(1):25–9. doi: 10.1038/75556. - DOI - PMC - PubMed
    1. Balderrama-Gutierrez G, Milovic A, Cook VJ, Islam MN, Zhang Y, Kiaris H, Belisle JT, Mortazavi A, Barbour AG. An infection-tolerant mammalian reservoir for several zoonotic agents broadly counters the inflammatory effects of endotoxin. mBio. 2021;12(2). Epub 20210413. doi: 10.1128/mBio.00588-21. - DOI - PMC - PubMed
    1. Barbour AG. Infection resistance and tolerance in Peromyscus spp., natural reservoirs of microbes that are virulent for humans. Semin Cell Devel Biol. 2017;61(1):115–22. doi: 10.1016/j.semcdb.2016.07.002. - DOI - PMC - PubMed
    1. Barbour AG. Borreliaceae. In: Whitman WB, Rainey R, P. Kämpfe P, Trujillo M, Chun J, DeVos P, Hedlund B, Dedysh S, editors. Bergey’s Manual of Systematics of Archaea and Bacteria. 2018. p. 1–9. Wiley, Hoboken, NJ, USA

Publication types