[Preprint]. 2023 Sep 21:2023.09.14.557739.
doi: 10.1101/2023.09.14.557739.

Strong environmental memory revealed by experimental evolution in static and fluctuating environments

Affiliations

Strong environmental memory revealed by experimental evolution in static and fluctuating environments

Clare I Abreu et al. bioRxiv. .

Update in

Abstract

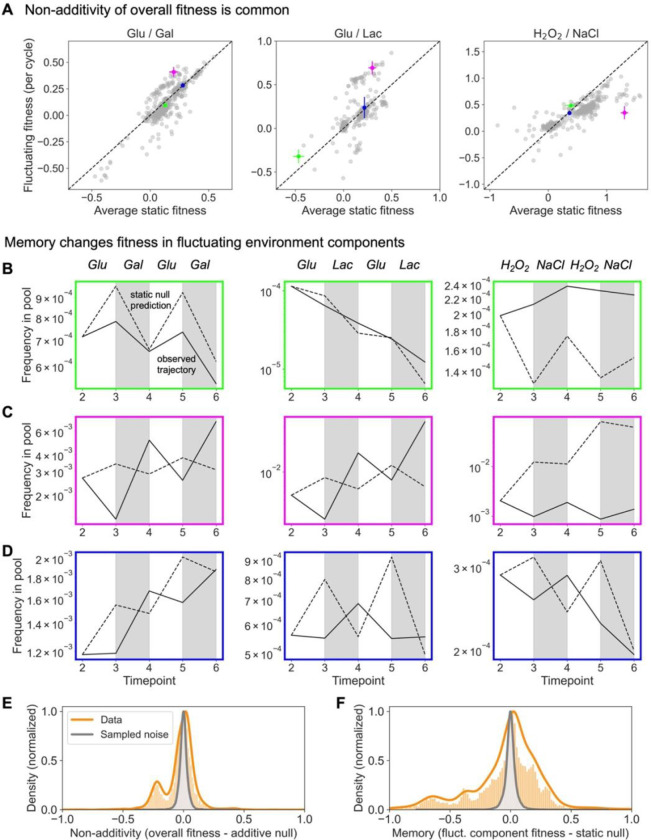
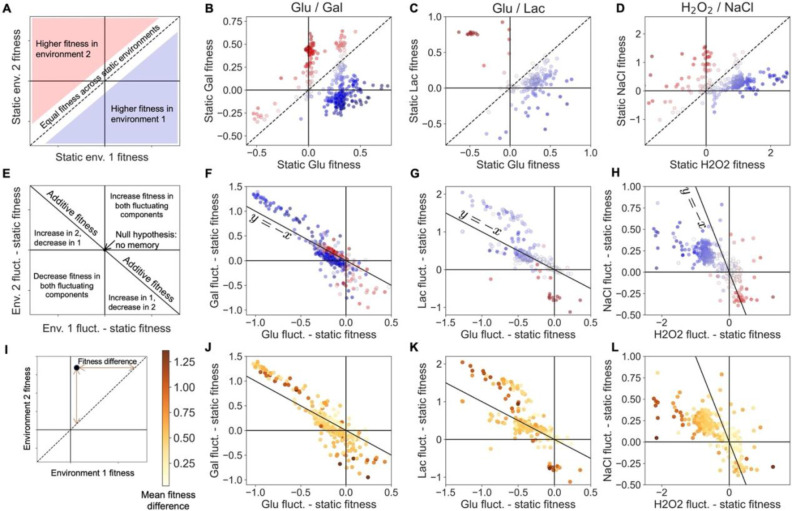
Evolution in a static environment, such as a laboratory setting with constant and uniform conditions, often proceeds via large-effect beneficial mutations that may become maladaptive in other environments. Conversely, natural settings require populations to endure environmental fluctuations. A sensible assumption is that the fitness of a lineage in a fluctuating environment is the time-average of its fitness over the sequence of static conditions it encounters. However, transitions between conditions may pose entirely new challenges, which could cause deviations from this time-average. To test this, we tracked hundreds of thousands of barcoded yeast lineages evolving in static and fluctuating conditions and subsequently isolated 900 mutants for pooled fitness assays in 15 environments. We find that fitness in fluctuating environments indeed often deviates from the expectation based on static components, leading to fitness non-additivity. Moreover, closer examination reveals that fitness in one component of a fluctuating environment is often strongly influenced by the previous component. We show that this environmental memory is especially common for mutants with high variance in fitness across tested environments, even if the components of the focal fluctuating environment are excluded from this variance. We employ a simple mathematical model and whole-genome sequencing to propose mechanisms underlying this effect, including lag time evolution and sensing mutations. Our results demonstrate that environmental fluctuations have large impacts on fitness and suggest that variance in static environments can explain these impacts.


Figures

Figure 1:
Figure 1:. Fitness assays test for non-additivity in mutants evolved from static and fluctuating environments.
A We evolved the same barcoded library in five static conditions and five fluctuating pairs of these static conditions. We then isolated 889 mutants from the evolution experiments and performed pooled fitness assays in all environments, plus five additional fluctuating environments. B-C After correcting for mean population fitness, we estimate a mutant’s fitness from the slope of its log frequency. D The null hypothesis of additive fitness in a fluctuating environment is represented by the average of the slopes in panels B-C. Non-additive fitness might result if transitions in the fluctuating environment alter fitness of a mutant. E Non-additivity can be visualized by plotting observed fitness in a fluctuating environment vs. the null hypothesis. Mutants with non-additive fitness will appear above or below the one-to-one line.
Figure 2:
Figure 2:. Non-additivity is common, but it masks even greater fitness changes.
A Plotting fitness of the mutant pool in three fluctuating environments against the null hypothesis of the average of their fitness in the static environments reveals many cases of non-additivity, or differences between these two quantities. We highlight particular cases in green, magenta, and blue. B Frequency trajectories (solid lines; mean of three replicates) show that the static null prediction (dashed lines; also calculated from replicate mean) is inaccurate, and that overall non-additivity masks the totality of fitness change, or environmental memory. C Frequency trajectories of non-additive mutants show reversals of the outcome expected based on static environment fitness. D Frequency trajectories of additive mutants also show reversals, even if the overall trajectory and fitness is similar to what was expected. (Note the finer scale in these plots compared to those in panel C.) E Non-additivity, or the difference between overall fluctuating fitness and the additive prediction, is plotted for all measurements in nine fluctuating environments (orange). Sampling from prediction uncertainty (Methods) shows that the measurement exceeds noise. F Memory, or the difference between fitness in fluctuating environment components and corresponding static environments, is greater in magnitude than non-additivity.
Figure 3:
Figure 3:. Fitness in one component of a fluctuating environment influences fitness in the other component.
A Plotting fitness across a pair of static environments indicates mutants that have higher fitness in the first environment (blue) and mutants that have higher fitness in the second environment (red). B-D Fitness of the pool is shown in three pairs of static environments. E Plotting the difference of fitness in one component of a fluctuating environment and fitness in the corresponding static environment shows memory, or how fitness changes in fluctuating environments. The y=-x line indicates mutants that change their fitness but are still additive. F-H The change in fitness in the two components of fluctuating environments is negatively correlated, indicating that mutants gain fitness in one component and lose fitness in the other. The presence of blue dots in the upper left quadrants and red dots in the lower right quadrants indicates that fitness gains often occur in the environment with lower static fitness and fitness losses often occur in the environment with higher static fitness, suggesting that in a fluctuating environment, fitness is influenced by the previous condition. I We define fitness difference between two static environments as the distance from the equal-fitness line. J-L Mutants with high mean fitness difference across all ten pairs are farther from the origin in these plots, meaning that they have more environmental memory.
Figure 4:
Figure 4:. Fitness reversals in fluctuating environments are common and recapitulated by a simple model of lag time evolution.
A Mean memory, or mean absolute difference between fitness in a static environment and fitness in the corresponding fluctuating component, correlates strongly with mean fitness difference across static environments. This nearly one-to-one correlation indicates that on average, mutants change their fitness in a fluctuating environment by an amount nearly equal to their fitness difference across static environments. Mean non-additivity, or mean difference between fluctuating fitness and average static fitness, is a lower bound of mean memory. B The frequency of fitness reversals in fluctuating environments is quantified by the fraction of the time that the other static environment fitness is a better predictor of fitness in half of a fluctuating environment, or 29% of overall cases. The top 10% of mutants by mean fitness difference more often reverse their fitness. C Fitness in one replicate of a static environment is better predicted by a replicate of another static environment than another replicate of the same static environment 2% of the time. The same is true for replicates of fluctuating environment components in 13% of cases, a noisier control because it contains half as many timepoints. D A simple model reproduces the correlation pattern shown in panel A. E The model reproduces the difference between mutants with high and low mean fitness difference shown in panel B. F The ancestor dominates growth in the model, where mutants’ fitness is determined by comparative lag (dis)advantages, which shift toward the mean of their distribution across static environments when the environment fluctuates.
Figure 5:
Figure 5:. Environment-sensing mutations are associated with higher fitness variance and memory.
A Three classes of mutants are plotted by mean fitness difference and mean memory (error bars are standard error of the mean). Diploids have moderate mean fitness variance and memory. Iron-sensing mutants have higher fitness variance and memory, while salt mutants do not. B Subdividing the pool of salt pump mutants into high and low copy number amplification reveals that more amplification leads to higher mean fitness variance and memory. A single SNP mutant was observed in the same set of genes as the copy number variants.

Similar articles

References

    1. Woods R., Schneider D., Winkworth C. L., Riley M. A. & Lenski R. E. Tests of parallel molecular evolution in a long-term experiment with Escherichia coli. PNAS 103, 9107–9112 (2006). - PMC - PubMed
    1. Tenaillon O. et al. The Molecular Diversity of Adaptive Convergence. Science 335, 457–461 (2012). - PubMed
    1. Venkataram S. et al. Development of a Comprehensive Genotype-to-Fitness Map of Adaptation-Driving Mutations in Yeast. Cell 166, 1585–1596.e22 (2016). - PMC - PubMed
    1. Good B. H., McDonald M. J., Barrick J. E., Lenski R. E. & Desai M. M. The dynamics of molecular evolution over 60,000 generations. Nature 551, 45–50 (2017). - PMC - PubMed
    1. Rudman S. M. et al. Direct observation of adaptive tracking on ecological time scales in Drosophila. Science 375, eabj7484 (2022). - PMC - PubMed

Publication types