[Preprint]. 2023 Sep 14:2023.09.13.557637.
doi: 10.1101/2023.09.13.557637.

Genetic tracing of market wildlife and viruses at the epicenter of the COVID-19 pandemic

Affiliations

Genetic tracing of market wildlife and viruses at the epicenter of the COVID-19 pandemic

Alexander Crits-Christoph et al. bioRxiv. .

Update in

  • Genetic tracing of market wildlife and viruses at the epicenter of the COVID-19 pandemic.
    Crits-Christoph A, Levy JI, Pekar JE, Goldstein SA, Singh R, Hensel Z, Gangavarapu K, Rogers MB, Moshiri N, Garry RF, Holmes EC, Koopmans MPG, Lemey P, Peacock TP, Popescu S, Rambaut A, Robertson DL, Suchard MA, Wertheim JO, Rasmussen AL, Andersen KG, Worobey M, Débarre F. Crits-Christoph A, et al. Cell. 2024 Sep 19;187(19):5468-5482.e11. doi: 10.1016/j.cell.2024.08.010. Cell. 2024. PMID: 39303692

Abstract

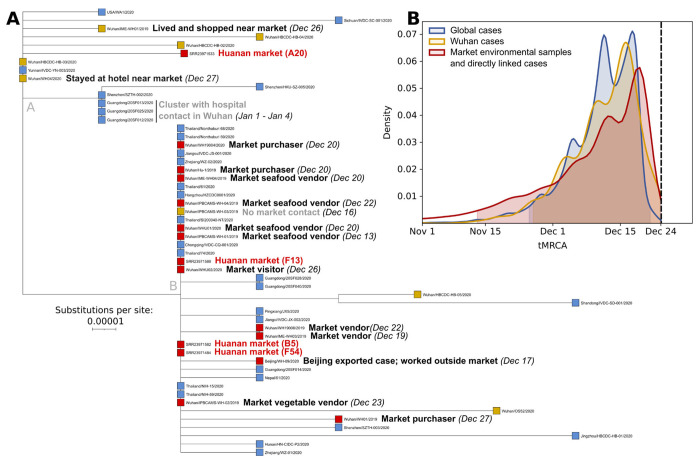
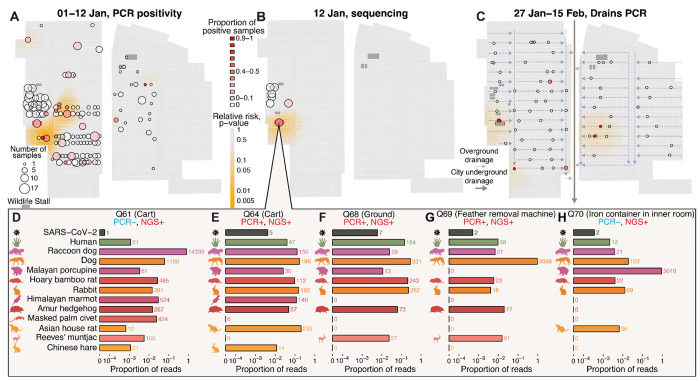
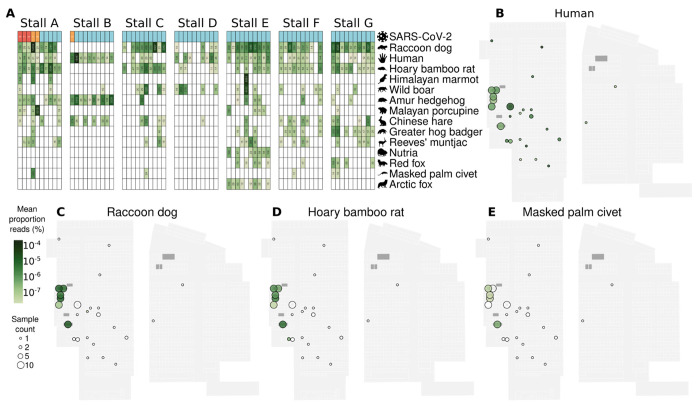
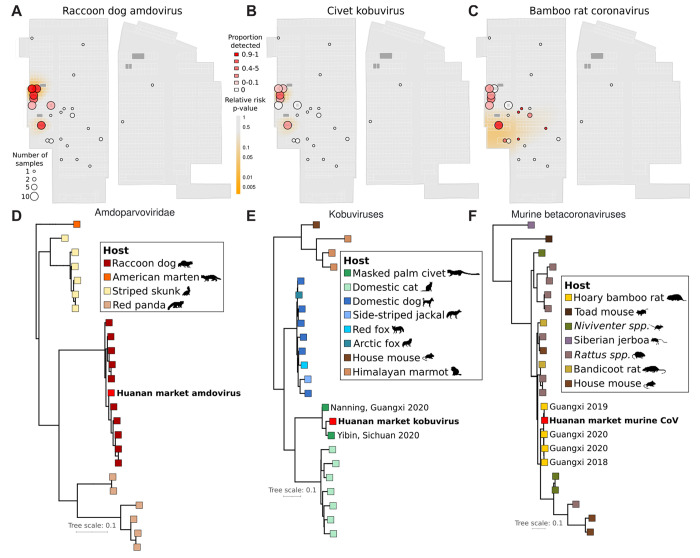
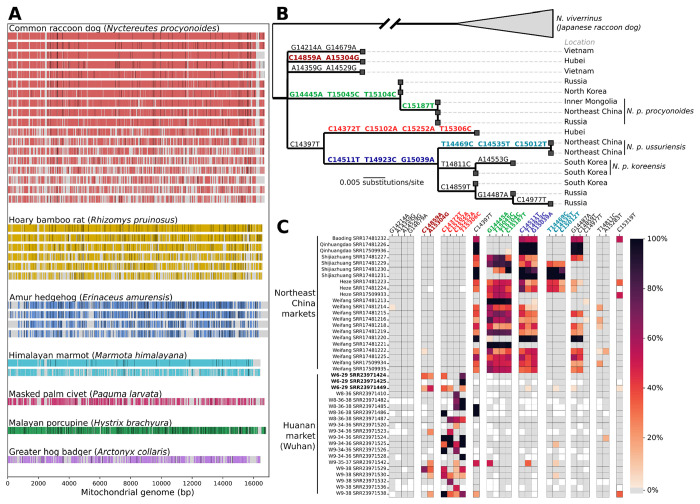
Zoonotic spillovers of viruses have occurred through the animal trade worldwide. The start of the COVID-19 pandemic was traced epidemiologically to the Huanan Wholesale Seafood Market, the site with the most reported wildlife vendors in the city of Wuhan, China. Here, we analyze publicly available qPCR and sequencing data from environmental samples collected in the Huanan market in early 2020. We demonstrate that the SARS-CoV-2 genetic diversity linked to this market is consistent with market emergence, and find increased SARS-CoV-2 positivity near and within a particular wildlife stall. We identify wildlife DNA in all SARS-CoV-2 positive samples from this stall. This includes species such as civets, bamboo rats, porcupines, hedgehogs, and one species, raccoon dogs, known to be capable of SARS-CoV-2 transmission. We also detect other animal viruses that infect raccoon dogs, civets, and bamboo rats. Combining metagenomic and phylogenetic approaches, we recover genotypes of market animals and compare them to those from other markets. This analysis provides the genetic basis for a short list of potential intermediate hosts of SARS-CoV-2 to prioritize for retrospective serological testing and viral sampling.


Conflict of interest statement

J.O.W. receives funding from the Centers for Disease Control and Prevention (CDC) through contracts to his institution unrelated to this research. M.A.S. receives contracts from the US Food & Drug Administration, US Department of Veterans Affairs and Janssen Research & Development, all outside the scope of this work. R.F.G. is a cofounder of Zalgen Labs, a biotechnology company developing countermeasures for emerging viruses. A.C-C. is an employee of Cultivarium, a nonprofit organization studying environmental microbes, unrelated to the scope of this work. M.W., A.L.R., J.E.P., A.R., M.A.S., E.C.H., S.A.G., J.O.W., and K.G.A. have received consulting fees and/or provided compensated expert testimony on SARS-CoV-2 and the COVID-19 pandemic. M.P.G.K. was involved in the WHO convened SARS-CoV-2 origins mission.

Figures

Figure 1:
Figure 1:. Phylogenetic analysis of SARS-CoV-2 from early COVID-19 cases and virus sequences obtained from the Huanan market.
(A) Phylogenetic tree of SARS-CoV-2 viral genomes collected before Jan 20, 2020. Tip colors correspond to different samples (red: market environmental samples and directly linked cases; yellow: Wuhan cases, with those indirectly linked to the Huanan market labeled; blue: all global cases). Symptom onset dates for cases are shown when known. The branch leading to A20 is slightly longer than other sequences with two substitutions from the root due to its slightly greater proportion (2.2%) of undetermined nucleotides. (B) tMRCA estimates for SARS-CoV-2 viral sequences from samples collected by February 14th 2020, obtained from globally collected viral samples (blue), samples obtained from Wuhan (yellow), and samples from the Huanan market or cases with direct market contact (red). The 95% highest posterior density (HPD) interval of each distribution is highlighted and the dashed line denotes the sampling date of the earliest genome (December 24th 2019).
Figure 2:
Figure 2:. The spatial distribution of SARS-CoV-2 in the Huanan market and animal DNA/RNA in SARS-CoV-2 positive samples from wildlife stall A.
(A) SARS-CoV-2 qPCR testing across all sampled stalls, with the proportion of positive qPCR results shown for samples collected on January 1st and 12th 2020. For A–C, the heatmaps represent the p-value surface distributions of a relative risk analysis, showing areas of significantly elevated positive test density. (B) Metatranscriptomic sequencing (mNGS)-based testing for SARS-CoV-2 in samples collected on January 12th 2020. (C) SARS-CoV-2 qPCR testing of water drains tested throughout the market. Arrows indicate the direction of reported drainage flows (Liu et al. 2023). (D–H) Number of SARS-CoV-2 sequence reads and mammalian mtDNA reads in samples that tested positive for SARS-CoV-2 from one wildlife stall. The number after each bar is the raw number of reads. Only mammalian species reported in at least 2 samples or with greater than 300 total reads are shown.
Figure 3:
Figure 3:. The spatial distribution of animal DNA/RNA in the Huanan market.
(A) The sequence read counts of the mammalian species with mtDNA detected in at least 3 samples across all wildlife stall samples sequenced on January 12th located in the western part of the market. Samples are grouped by wildlife stall, ordered by detection of SARS-CoV-2 (red:positive by qPCR and sequencing; orange: positive by sequencing only; blue: negative), and species are the ones we detected whose genus was reported as sold live in Wuhan markets by Xiao et al. (X. Xiao et al. 2021), ordered by abundance. (B-E) The spatial distribution of the mean proportions of mtDNA reads across sequenced samples collected in the market on January 1st and 12th for (B) humans (H. sapiens), (C) raccoon dogs (N. procyonoides), (D) hoary bamboo rat (R. pruinosus), (E) masked palm civet (P. larvata).
Figure 4:
Figure 4:. Animal viruses in the Huanan market.
(A–C) The spatial distribution of detection of three wildlife viruses detected in the Huanan market in sequenced samples collected in the market on January 1st and 12th. Bubbles correspond to stalls, and the bubble color represents the mean proportion of reads mapping to the viral genome from samples in that stall. The heatmap shown is a quantification of the p-value distribution for a relative risk analysis, showing spatial distribution of enriched positivity for each virus. (D–F) Maximum likelihood phylogenies of the market consensus sequence for each of the three viruses shown in (A–C). Each reference virus is colored by the species it was reported as isolated from.
Figure 5:
Figure 5:. Mitochondrial phylogenetics of potential intermediate host species of SARS-CoV-2 in the Huanan market.
(A) Coverage of wildlife mitochondrial genomes in Huanan market samples. Covered bases are colored, and consensus SNPs from the reference genome for each species are shown as black lines. (B) Cytochrome B phylogeny of raccoon dog reference sequences collected from mainland Asia. (C) Heatmap of raccoon dog cytB SNVs found in the Huanan market samples and samples collected from other markets to the north of Hubei province. The color of each square represents the read mapping frequency of that allele in the sample. SNVs are grouped by the branch of the reference tree they fall on, corresponding to the colors from (B). Samples from the wildlife stall positive for SARS-CoV-2 are in bold.

Similar articles

Cited by

References

    1. Bloom Jesse D. 2021. “Recovery of Deleted Deep Sequencing Data Sheds More Light on the Early Wuhan SARS-CoV-2 Epidemic.” Molecular Biology and Evolution 38 (12): 5211–24. - PMC - PubMed
    1. Bloom Jesse D. 2023. “Association between SARS-CoV-2 and Metagenomic Content of Samples from the Huanan Seafood Market.” Virus Evolution 9 (2): vead050. - PMC - PubMed
    1. Boklund Anette, Gortázar Christian, Pasquali Paolo, Roberts Helen, Nielsen Søren Saxmose, Stahl Karl, Stegeman Arjan, et al. 2021. “Monitoring of SARS-CoV-2 Infection in Mustelids.” EFSA Journal 19 (3). 10.2903/j.efsa.2021.6459. - DOI - PMC - PubMed
    1. Bosco-Lauth A. M., Hartwig A. E., Porter S. M., Gordy P. W., Nehring M., Byas A. D., VandeWoude S., Ragan I. K., Maison R. M., and Bowen R. A.. 2020. “Experimental Infection of Domestic Dogs and Cats with SARS-CoV-2: Pathogenesis, Transmission, and Response to Reexposure in Cats.” Proceedings of the National Academy of Sciences of the United States of America 117 (42). 10.1073/pnas.2013102117. - DOI - PMC - PubMed
    1. Bosco-Lauth Angela M., Walker Audrey, Guilbert Lauren, Porter Stephanie, Hartwig Airn, Emma McVicker, Bielefeldt-Ohmann Helle, and Bowen Richard A.. 2021. “Susceptibility of Livestock to SARS-CoV-2 Infection.” Emerging Microbes & Infections, November. 10.1080/22221751.2021.2003724. - DOI - PMC - PubMed

Publication types