[Preprint]. 2023 Oct 16:2023.09.13.557588.
doi: 10.1101/2023.09.13.557588.

Global impact of aberrant splicing on human gene expression levels

Affiliations

Global impact of aberrant splicing on human gene expression levels

Benjamin Fair et al. bioRxiv. .

Update in

Abstract

Alternative splicing (AS) is pervasive in human genes, yet the specific function of most AS events remains unknown. It is widely assumed that the primary function of AS is to diversify the proteome, however AS can also influence gene expression levels by producing transcripts rapidly degraded by nonsense-mediated decay (NMD). Currently, there are no precise estimates for how often the coupling of AS and NMD (AS-NMD) impacts gene expression levels because rapidly degraded NMD transcripts are challenging to capture. To better understand the impact of AS on gene expression levels, we analyzed population-scale genomic data in lymphoblastoid cell lines across eight molecular assays that capture gene regulation before, during, and after transcription and cytoplasmic decay. Sequencing nascent mRNA transcripts revealed frequent aberrant splicing of human introns, which results in remarkably high levels of mRNA transcripts subject to NMD. We estimate that ~15% of all protein-coding transcripts are degraded by NMD, and this estimate increases to nearly half of all transcripts for lowly-expressed genes with many introns. Leveraging genetic variation across cell lines, we find that GWAS trait-associated loci explained by AS are similarly likely to associate with NMD-induced expression level differences as with differences in protein isoform usage. Additionally, we used the splice-switching drug risdiplam to perturb AS at hundreds of genes, finding that ~3/4 of the splicing perturbations induce NMD. Thus, we conclude that AS-NMD substantially impacts the expression levels of most human genes. Our work further suggests that much of the molecular impact of AS is mediated by changes in protein expression levels rather than diversification of the proteome.


Figures
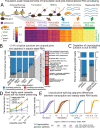
Figure 1:
Figure 1:. Genomic data captured before, during, and after transcription reveal an abundance of NMD isoforms.
(A) A subset of the population-scale datasets we analyzed, covering stages of mRNA biogenesis, from activation of enhancers/promoters (i.e. H3K27ac and H3K4me3 ChIP-seq), to steady-state RNA (polyA-RNA-seq). Gene expression correlation matrix relative to steady-state RNA samples shown as heatmap (B) Left: Fraction of splice junction reads in each RNA-seq sample that are in Gencode-annotated productive transcript structures (blue), versus unannotated or annotated unproductive transcript structures (gray). Dashed lines indicate median for each dataset. Right: For the 2.4% of splice junctions in naRNA-seq data that are not in annotated productive transcript structures, we checked for their unique presence in annotated unproductive transcript structures (e.g., transcripts tagged by Gencode as “retained_intron”), or if unannotated, we attempted to translate sequences surrounding the splice sites (STAR Methods). Stacked bar plot indicates the fraction of naRNA-seq splice junctions in each sub-category. (C) Similar to (B), comparing steady-state RNA from shRNA scramble control (n=6) and shRNA double knockdown (dKD, n=3) of SMG6 and SMG7 in HeLa cells. (D) Fraction of cassette exons that are symmetric (i.e. length divisible by three) as a function of their usage, estimated as percent spliced in (PSI). Error bars represent the 5–95% percentile range of values for LCL lines treated as replicates (circular markers, same dataset as (B)), and the full range of values for replicate shRNA knockdown experiments (triangular markers, same dataset as (C)). (E) Cumulative distribution of log fold differences in steady-state gene expression versus gene transcription (measured by H3K4me3 promoter activity, naRNA, H3K36me3, or 30m 4sU-labeled RNA), a proxy for degradation rate. Genes are grouped by quintiles based on percent of unproductive junction reads.
Figure 2:
Figure 2:. Unproductive mis-splicing accumulates across transcripts.
(A) Correlation between percent of unproductive junction reads in LeafCutter clusters versus length of the most used productive intron in the cluster. Spearman correlation coefficient of 0.19 (p-value of 1.3×10−243). Correlation presented as cumulative distribution of percent unproductive splice junctions, for increasing groups of intron length. (B) Percent unproductive splice junctions for each gene that are attributed to the most common (Rank 1) unproductive junction, the second most common unproductive junction, etc… (C) Model of unproductive splicing compounding across multi-intronic transcripts. A low unproductive rate at many independently spliced introns produces a high rate of unproductive molecules at the transcript level. (D) Nanopore long-read sequencing quantifies the percent of full-length reads that are targeted by NMD, defined as containing at least one unproductive junction, as a function of the number of splice junctions in the read. Vertical dashed line marks 8 splice junctions, corresponding to a typical full-length human transcript. Total RNA isolated from shRNA-mediated double knockdown (dKD) of NMD factors SMG6 and SMG7 or shRNA scramble control in HeLa cells. naRNA data from K562 cells. Multiple points of the same color indicate replicate experiments. Blue and orange shaded area represents the binomial expectation when assuming 1.5–2.5% and 0.2–0.7% of unproductive junction reads at each independent junction.
Figure 3:
Figure 3:. Genetic variants that alter expression post-transcriptionally are enriched in splice-altering variants that are predicted to induce NMD.
(A) Approach for identifying mechanisms of gene regulation, using data from the CCHCR1 locus as an illustrative example. Genetic variants that associate with chromatin peak height, RNA expression, splicing, etc… (molecular QTLs, or molQTL) are identified (boxplots). Multi-trait colocalization compares alignment of molQTL signals (scatter plots) to identify molQTLs that likely share a causal SNP. (B) Effect size (beta) of H3K27ac hQTLs at promoter is correlated with eQTL effect sizes. eQTL effect sizes estimated in each RNA-seq dataset relative to lead hQTL SNP. Correlation summarized with Spearman’s rho coefficient and significance test. (C) Tally of eGenes by their colocalizing molQTLs. 831 eGenes colocalize with an hQTL (*, H3K27ac, H3K4me1, H3K4me3, or H3K36me3). 518 eGenes colocalize with other molQTLs (** indicates eGenes that do not colocalize with any hQTL), suggesting post-transcriptional regulation, some of which colocalize with an sQTL, or alternative polyadenylation (apaQTL). (D) Example eQTL for the TTC38 gene functioning through AS-NMD caused by inclusion of a poison exon (red). H3K27ac ChIP-seq and RNA-seq coverage grouped by genotype of the lead eQTL SNP. Pink inset region shows effect on splicing of poison exon, depicted in detail as sashimi plots with relative usage (intronic PSI) of splice junctions as arcs. (E) eQTL QQ-plot shows inflation of eQTL signal among various groups of SNPs (lead SNPs for p-sQTLs and u-sQTLs within the host-gene, H3K27ac QTLs within 100kb of test gene, or random test SNPs). (F) (Top row) Effect size of p-sQTLs (all sQTL introns in LeafCutter cluster are productive splice junctions) versus the effect on host gene expression (eQTL beta). (Bottom row) Effect size of u-sQTL (sQTLs which significantly influence at least one unproductive splice junction) versus effect on host gene expression. Similar to (B), effects assessed in each RNA-seq dataset relative to the top sQTL SNP, using the unproductive splice junction for u-sQTLs. (G) eQTLs consistent with regulation by transcription (eQTL/hQTLs, purple) in discovery dataset in LCLs were compared to eQTLs consistent with AS-NMD (eQTL/u-sQTLs, red). Left: Each eQTL (SNP:gene pair, rows) assessed for effects in GTEx tissues (columns). Right: Cumulative distribution for number of tissues with significant effects. P value corresponds to a two-sided Mann-Whitney test.
Figure 4:
Figure 4:. Splicing-mediated NMD contributes to complex trait biology.
(A) QQ-plot of multiple sclerosis GWAS signal, grouped by categories of SNPs. p-sQTLs that impact the balance of protein coding isoforms and u-sQTLs that impact usage of unproductive splice junctions are similarly inflated for GWAS signals. (B) Fraction of GWAS loci that colocalize with various sets of molecular QTLs (molQTLs) in each of 45 blood or immune-related traits. Number of loci for which colocalization was attempted is indicated at the top of each column. “Other combinations” includes loci that colocalize with alternative polyadenylation QTLs, or hQTLs and sQTLs, or other combinations which may include sQTLs and other molQTLs, and are difficult to interpret mechanistically. (C) Histogram of usage of unique sQTL junctions that colocalize with a GWAS signal, grouped by sQTL type. Intronic PSI (junction read count divided by most abundant junction in LeafCutter cluster) for each junction was summarized as the median from steady-state RNA samples which are homozygous for the PSI-increasing allele. (D) Effect size (beta) of sQTLs and eQTLs for distinct u-sQTLs that colocalize with a GWAS signal. Correlation summarized with Spearman’s rho coefficient and significance test.
Figure 5:
Figure 5:. Risdiplam-induced splicing alterations mediate expression changes at hundreds of genes.
(A) Overview of risdiplam-based approach to assess pervasiveness of NMD after splicing perturbations. LCLs treated with 8 doses of risdiplam. Splicing changes at cryptic exons assessed for NMD-potential, and gene expression changes were estimated. (B) Genome-wide mean splicing dose-dependent changes at various classes of 5’ss in naRNA and steady-state RNA. Bootstrapped 95% confidence intervals shaded around the mean activation level across n introns in each group. (C) Left: Dose-dependent splicing response (left) at a risdiplam-targeted exon in MYB. Right: Dose-dependent expression response of MYB. (D) Predicted translation result of 305 risdiplam-induced exons. Exons expected to induce NMD versus those that maintain transcript stability are red and blue, respectively. Annotated and unannotated exons are dark and light colors, respectively. (E) Empirically measured effect of host gene expression as measured in steady-state RNA and naRNA in the presence of risdiplam at 3.16μM. Each point is an induced exon/host-gene, colored the same as in (D). (F) Cumulative distribution of gene length for genes with predicted NMD-induced exons, a similarly sized set of expression-matched genes, all genes, or a set of gene targets for FDA-approved small molecules. (G) Conventional small molecule drug targets are disproportionately skewed for particular classes of ‘druggable’ genes (e.g. G-protein-coupled receptors, GPCRs) that operate at the level of protein binding. Risdiplam-induced NMD targets are more representative of all genes. Disease genes with therapeutic potential by down-regulation (OMIM dominant negative genes) are similarly distributed across categories of previously ‘druggable’ genes.

Similar articles

References

    1. Barbosa-Morais N.L., Irimia M., Pan Q., Xiong H.Y., Gueroussov S., Lee L.J., Slobodeniuc V., Kutter C., Watt S., Colak R., et al. (2012). The Evolutionary Landscape of Alternative Splicing in Vertebrate Species. Science 338, 1587–1593. 10.1126/science.1230612. - DOI - PubMed
    1. Merkin J., Russell C., Chen P., and Burge C.B. (2012). Evolutionary dynamics of gene and isoform regulation in Mammalian tissues. Science 338, 1593–1599. 10.1126/science.1228186. - DOI - PMC - PubMed
    1. Mudge J.M., Frankish A., Fernandez-Banet J., Alioto T., Derrien T., Howald C., Reymond A., Guigo R., Hubbard T., and Harrow J. (2011). The Origins, Evolution, and Functional Potential of Alternative Splicing in Vertebrates. Mol. Biol. Evol. 28, 2949–2959. 10.1093/molbev/msr127. - DOI - PMC - PubMed
    1. Bénitère F., Necsulea A., and Duret L. (2022). Random genetic drift sets an upper limit on mRNA splicing accuracy in metazoans (Evolutionary Biology) 10.1101/2022.12.09.519597. - DOI - PMC - PubMed
    1. Saudemont B., Popa A., Parmley J.L., Rocher V., Blugeon C., Necsulea A., Meyer E., and Duret L. (2017). The fitness cost of mis-splicing is the main determinant of alternative splicing patterns. Genome Biol. 18, 208. 10.1186/s13059-017-1344-6. - DOI - PMC - PubMed

Publication types