. 2023 Apr 28;7(5):100180.
doi: 10.1016/j.shj.2023.100180. eCollection 2023 Sep.

Early Detection of Risk of Neo-Sinus Blood Stasis Post-Transcatheter Aortic Valve Replacement Using Personalized Hemodynamic Analysis

Affiliations

Early Detection of Risk of Neo-Sinus Blood Stasis Post-Transcatheter Aortic Valve Replacement Using Personalized Hemodynamic Analysis

Seyedvahid Khodaei et al. Struct Heart. .

Abstract

Background: Despite the demonstrated benefits of transcatheter aortic valve replacement (TAVR), subclinical leaflet thrombosis and hypoattenuated leaflet thickening are commonly seen as initial indications of decreased valve durability and augmented risk of transient ischemic attack.

Methods: We developed a multiscale patient-specific computational framework to quantify metrics of global circulatory function, metrics of global cardiac function, and local cardiac fluid dynamics of the aortic root and coronary arteries.

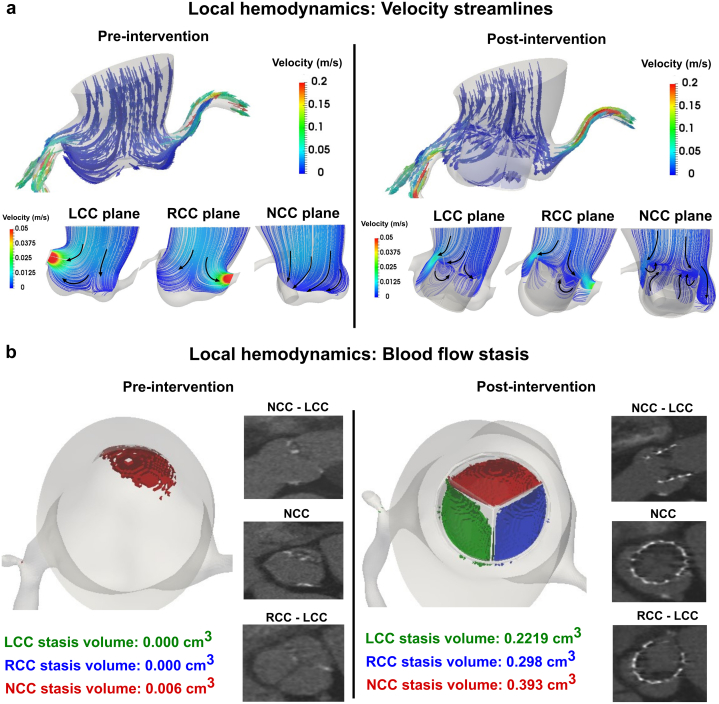
Results: Based on our findings, TAVR might be associated with a high risk of blood stagnation in the neo-sinus region due to the lack of sufficient blood flow washout during the diastole phase (e.g., maximum blood stasis volume increased by 13, 8, and 2.7 fold in the left coronary cusp, right coronary cusp, and noncoronary cusp, respectively [N = 26]). Moreover, in some patients, TAVR might not be associated with left ventricle load relief (e.g., left ventricle load reduced only by 1.2 % [N = 26]) and diastolic coronary flow improvement (e.g., maximum coronary flow reduced by 4.94%, 15.05%, and 23.59% in the left anterior descending, left circumflex coronary artery, and right coronary artery, respectively, [N = 26]).

Conclusions: The transvalvular pressure gradient amelioration after TAVR might not translate into adequate sinus blood washout, optimal coronary flow, and reduced cardiac stress. Noninvasive personalized computational modeling can facilitate the determination of the most effective revascularization strategy pre-TAVR and monitor leaflet thrombosis and coronary plaque progression post-TAVR.

Keywords: Cardiac fluid dynamics; Coronary hemodynamics; Global hemodynamics; Patient-specific lumped parameter model; Transcatheter aortic valve replacement; Valve thrombosis local fluid dynamics.


Conflict of interest statement

The authors report no conflict of interest.

Figures

Figure 1
Figure 1
(a) Schematic of computational domain. This model incorporates the following sub-models. (1) ascending aorta and aortic root, (2) left ventricle, (3) left anterior descending coronary artery, (4) left circumflex coronary artery, and (5) right coronary artery. Abbreviations are the same as in Supplemental Table 1; (b) Sample results of local and global hemodynamic outputs produced by non-invasive computational framework.
Figure 2
Figure 2
Local hemodynamics at baseline and post-TAVR in patient #21. (a) Blood flow vortical structure in the sinus and neo-sinus in the central plane of each leaflet during diastole in pre- and post-TAVR states; (b) Blood stasis volume per leaflet neo-sinus at peak diastole and CT-based evidence of hypoattenuated leaflet thickening on the leaflets. In patient #21, the disturbed vortical structure due to the malpositioning of prosthetic valve and its interaction with the coronary ostium inflow as well as anatomical alterations of aortic root impede the proper flow washout with significant increase of blood stasis volume post-TAVR. Abbreviations: CT, computed tomography; LCC, left coronary cusp; NCC, noncoronary cusp; RCC, right coronary cusp; TAVR, transcatheter aortic valve replacement.
Figure 3
Figure 3
Global hemodynamics at baseline and post-TAVR in patient #21. (a) LV workload, LV and ascending aorta pressures; (b) Changes in computed coronary flowrate for LAD, LCX, and RCA branches pre- and post-TAVR. Abbreviations: LV, left ventricle; TAVR, transcatheter aortic valve replacement.
Figure 4
Figure 4
Local hemodynamics at baseline and post-TAVR (N = 26). (a) LCC neo-sinus stasis volume; (b) RCC neo-sinus stasis volume; (c) NCC neo-sinus stasis volume; (d) Total neo-sinus stasis volume; (e) Distributions of calcium volume per leaflet and blood stasis volume per leaflet pre- and post-TAVR. Abbreviations: LCC, left coronary cusp; NCC, noncoronary cusp; RCC, right coronary cusp; TAVR, transcatheter aortic valve replacement.
Figure 5
Figure 5
Local hemodynamics at baseline and post-TAVR (N = 26). (a) LAD peak diastolic flow; (b) LAD peak systolic flow; (c) LCX peak diastolic flow; (d) LCX peak systolic flow; (e) RCA peak diastolic flow; (f) RCA peak systolic flow. Abbreviation: TAVR, transcatheter aortic valve replacement.
Figure 6
Figure 6
Global hemodynamics at baseline and post-TAVR (N = 26). (a) LV workload; (b) Aortic valve mean pressure gradient; (c) Ejection fraction; (d) Box plots comparing LV workload and clinical parameters pre- and post-TAVR. Abbreviations: LV, left ventricle; TAVR, transcatheter aortic valve replacement.
Figure 7
Figure 7
Correlation analysis between calcium volume of the leaflets and hemodynamic parameters (local and global) (N = 26). (a) Scatter plot of NCC calcium volume vs. LCC blood stasis volume (post-TAVR); (b) Scatter plot of NCC calcium volume vs. commissural misalignment (post-TAVR); (c) Scatter plot of NCC calcium volume vs. RCC blood stasis volume (pre-TAVR); (d) Scatter plot of total calcium volume vs. coronary resistance (pre-TAVR); (e) Scatter plot of total calcium volume vs. NCC blood stasis volume (pre-TAVR); (f) Scatter plot of total calcium volume vs. total blood stasis volume (pre-TAVR); (g) Scatter plot of RCC calcium volume vs. LV load (pre-TAVR); (h) Scatter plot of RCC calcium volume vs. LV load (post-TAVR); (i) Box plots comparing blood stasis volume changes after TAVR per leaflet for all patients. Abbreviations: LCC, left coronary cusp; LV, left ventricle; NCC, noncoronary cusp; RCC, right coronary cusp; TAVR, transcatheter aortic valve replacement.
Figure 8
Figure 8
TAVR and the challenge of reducing the risk of leaflet thrombosis and coronary plaque progression over time.

Similar articles

Cited by

References

    1. Abdul-Jawad Altisent O., Ferreira-Gonzalez I., Marsal J.R., et al. Neurological damage after transcatheter aortic valve implantation compared with surgical aortic valve replacement in intermediate risk patients. Clin Res Cardiol. 2016;105:508–517. - PubMed
    1. Athappan G., Gajulapalli R.D., Sengodan P., et al. Influence of transcatheter aortic valve replacement strategy and valve design on stroke after transcatheter aortic valve replacement: a meta-analysis and systematic review of literature. J Am Coll Cardiol. 2014;63:2101–2110. - PubMed
    1. Arora S., Ramm C.J., Misenheimer J.A., Vavalle J.P. Early transcatheter valve prosthesis degeneration and future ramifications. Cardiovasc Diagn Ther. 2017;7:1–3. - PMC - PubMed
    1. Bogyi M., Schernthaner R.E., Loewe C., et al. Subclinical leaflet thrombosis after transcatheter aortic valve replacement. JACC Cardiovasc Interv. 2021;14:2643–2656. - PubMed
    1. Karády J., Apor A., Nagy A.I., et al. Quantification of hypo-attenuated leaflet thickening after transcatheter aortic valve implantation: clinical relevance of hypo-attenuated leaflet thickening volume. Eur Heart J Cardiovasc Imaging. 2020;21:1395–1404. - PubMed

LinkOut - more resources