. 2023 Sep 4:10:1265429.
doi: 10.3389/fmolb.2023.1265429. eCollection 2023.

Evolutionary conservation of Zinc-Activated Channel (ZAC) functionality in mammals: a range of mammalian ZACs assemble into cell surface-expressed functional receptors

Affiliations

Evolutionary conservation of Zinc-Activated Channel (ZAC) functionality in mammals: a range of mammalian ZACs assemble into cell surface-expressed functional receptors

Anders A Jensen. Front Mol Biosci. .

Abstract

In contrast to the other pentameric ligand-gated ion channels in the Cys-loop receptor superfamily, the ZACN gene encoding for the Zinc-Activated Channel (ZAC) is exclusively found in the mammalian genome. Human ZAC assembles into homomeric cation-selective channels gated by Zn2+, Cu2+ and H+, but the function of the receptor in human physiology is presently poorly understood. In this study, the degree of evolutionary conservation of a functional ZAC in mammals was probed by investigating the abilities of a selection of ZACs from 10 other mammalian species than human to be expressed at the protein level and assemble into cell surface-expressed functional receptors in mammalian cells and in Xenopus oocytes. In an enzyme-linked immunosorbent assay, transient transfections of tsA201 cells with cDNAs of hemagglutinin (HA)-epitope-tagged versions of these 10 ZACs resulted in robust total expression and cell surface expression levels of all proteins. Moreover, injection of cRNAs for 6 of these ZACs in oocytes resulted in the formation of functional receptors in two-electrode voltage-clamp recordings. The ZACs exhibited robust current amplitudes in response to Zn2+ (10 mM) and H+ (pH 4.0), and the concentration-response relationships displayed by Zn2+ at these channels were largely comparable to that at human ZAC. In conclusion, the findings suggest that the functionality of ZAC at the molecular level may be conserved throughout mammalian species, and that the channel thus may govern physiological functions in mammals, including humans.

Keywords: Zinc-Activated Channel (ZAC); evolutionary conservation; mammalian; pentameric ligand-gated ion channel (pLGIC); proton; two-electrode voltage-clamp electrophysiology (TEVC); zinc.


Conflict of interest statement

The author declares that the research was conducted in the absence of any commercial or financial relationships that could be construed as a potential conflict of interest.

Figures

FIGURE 1
FIGURE 1
Alignment of the amino acid sequences of 11 ZACs from different mammalian species: hsZAC, cjZAC, clZAC, fcZAC, ecZAC, btZAC, ssZAC, mmZAC, odZAC, hgZAC, and tmZAC. The sequence alignment was performed using the web-based Clustal Omega program. The signal peptides in the ZAC proteins are given in red font, and the HA-epitope insertion points in the proteins are indicated (in red). The ten β-sheets (β1-10) in the extracellular domains and the four α-helices (M1-4) in the transmembrane domains of the proteins are indicated. The amino acid residues that are completely conserved in all 11 ZACs are highlighted in light blue. The positions of the four candidate protonation residues conserved in the six H+-gated ZACs (hsZAC, cjZAC, clZAC, btZAC, hgZAC and tmZAC) but not in ecZAC are indicated with green squares below the alignments.
FIGURE 2
FIGURE 2
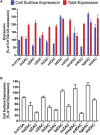
Expression properties displayed by 11 HA-tagged ZACs in tsA201 cells in an ELISA. (A). Cell surface expression and total expression levels of hsZAC, cjZAC, clZAC, fcZAC, ecZAC, btZAC, ssZAC, mmZAC, HA-odZAC, hgZAC, and tmZAC. Data are given as mean ± S.E.M. values in % of the cell surface expression in HA-tagged 5-HT3A-transfected cells (a line marker indicates the 100% level). (B). Ratios between cell surface expression and total expression levels (CS-Exp/Total-Exp ratios) for all 11 ZACs. Data are given as mean ± S.E.M. in % of the total expression level of the respective receptors. (A, B). Data are based on a total of three experiments (n = 3) performed in triplicate.
FIGURE 3
FIGURE 3
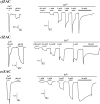
Functional properties displayed by cjZAC (top panel), clZAC (middle panel) and ecZAC (bottom panel) in Xenopus oocytes in two-electrode voltage-clamp recordings. Left: Representative traces for the current responses evoked by Zn2+ (10 mM) and H+ (pH 4.0) in oocytes expressing the receptors. Right: Representative traces for the current responses evoked by various Zn2+ concentrations in oocytes expressing the receptors. The averaged concentration-response relationships for the receptors are given in Figure 5, and averaged pharmacological data extracted from these experiments are given in Table 2.
FIGURE 4
FIGURE 4
Functional properties displayed by btZAC (top panel), hgZAC (middle panel) and tmZAC (bottom panel) in Xenopus oocytes in two-electrode voltage-clamp recordings. Left: Representative traces for the current responses evoked by Zn2+ (10 mM) and H+ (pH 4.0) in oocytes expressing the receptors. Right: Representative traces for the current responses evoked by various Zn2+ concentrations in oocytes expressing the receptors. For btZAC, the last current response in the Zn2+ concentration-response trace is from another btZAC-expressing oocyte than that for the other current responses (indicated by “\\“). The averaged concentration-response relationships for the receptors are given in Figure 5, and averaged pharmacological data extracted from these experiments are given in Table 2.
FIGURE 5
FIGURE 5
Concentration-response relationships exhibited by Zn2+ at hsZAC, cjZAC, clZAC, ecZAC, btZAC, hgZAC and tmZAC in Xenopus oocytes in two-electrode voltage-clamp recordings. Data are given as mean ± S.E.M. values in % normalized to the fitted Imax for the specific receptor and are based on five to eight independent experiments (the specific n values for the receptors are given in Table 2). The averaged pharmacological data extracted from these experiments are given in Table 2.

Similar articles

Cited by

References

    1. Alexander S. P., Mathie A., Peters J. A., Veale E. L., Striessnig J., Kelly E., et al. (2021). The concise guide to pharmacology 2019/20: ion channels. Br. J. Pharmacol. 178 (1), S142–S228. 10.1111/bph.14749 - DOI - PMC - PubMed
    1. Almagro Armenteros J. J., Tsirigos K. D., Sønderby C. K., Petersen T. N., Winther O., Brunak S., et al. (2019). SignalP 5.0 improves signal peptide predictions using deep neural networks. Nat. Biotechnol. 37, 420–423. 10.1038/s41587-019-0036-z - DOI - PubMed
    1. Belelli D., Hogenkamp D., Gee K. W., Lambert J. J. (2020). Realising the therapeutic potential of neuroactive steroid modulators of the GABAA receptor. Neurobiol. Stress. 12, 100207. 10.1016/j.ynstr.2019.100207 - DOI - PMC - PubMed
    1. Bloomenthal A. B., Goldwater E., Pritchett D. B., Harrison N. L. (1994). Biphasic modulation of the strychnine-sensitive glycine receptor by Zn2+ . Mol. Pharmacol. 46, 1156–1159. - PubMed
    1. Boyd G. W., Doward A. I., Kirkness E. F., Millar N. S., Connolly C. N. (2003). Cell surface expression of 5-hydroxytryptamine type 3 receptors is controlled by an endoplasmic reticulum retention signal. J. Biol. Chem. 278 (30), 27681–27687. 10.1074/jbc.M304938200 - DOI - PubMed

LinkOut - more resources