

Identification of endoplasmic reticulum stress-related biomarkers of diabetes nephropathy based on bioinformatics and machine learning
- PMID: 37745718
- PMCID: PMC10513048
- DOI: 10.3389/fendo.2023.1206154
Identification of endoplasmic reticulum stress-related biomarkers of diabetes nephropathy based on bioinformatics and machine learning
Abstract
Backgrounds: Diabetes nephropathy (DN) is a growing public health concern worldwide. Renal dysfunction impairment in DN is intimately linked to ER stress and its related signaling pathways. Nonetheless, the underlying mechanism and biomarkers for this function of ER stress in the DN remain unknown.
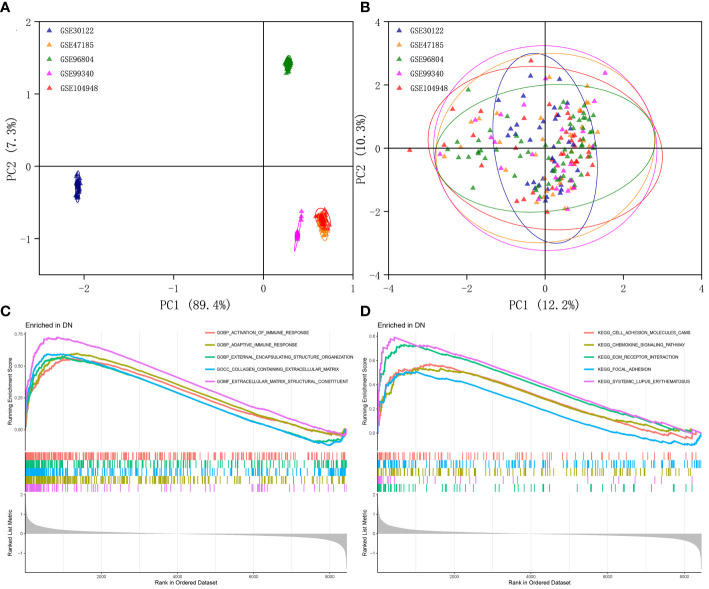
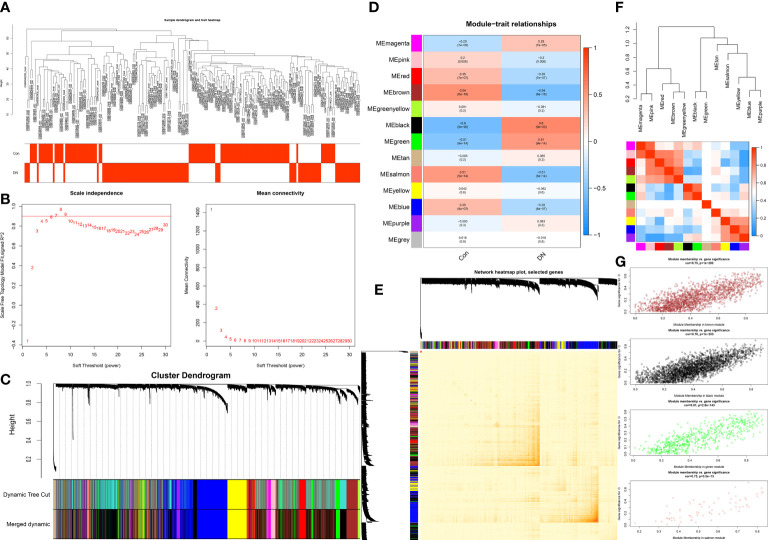
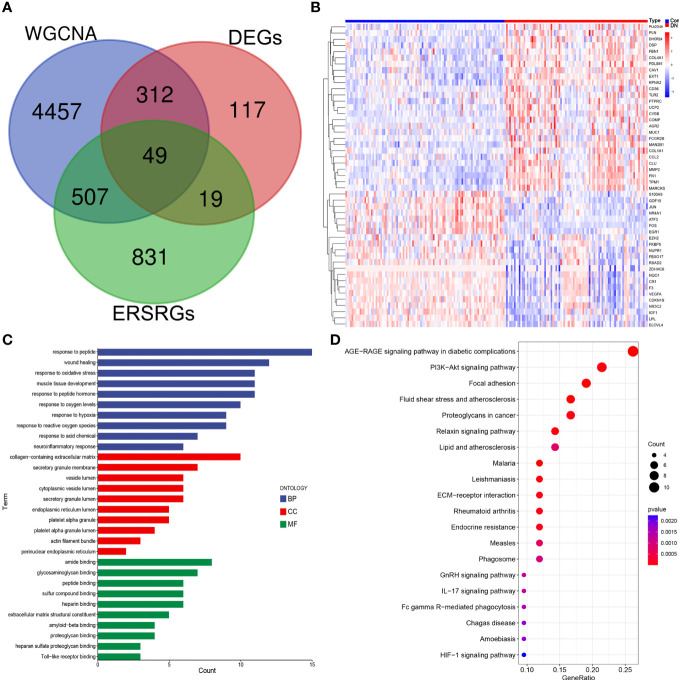
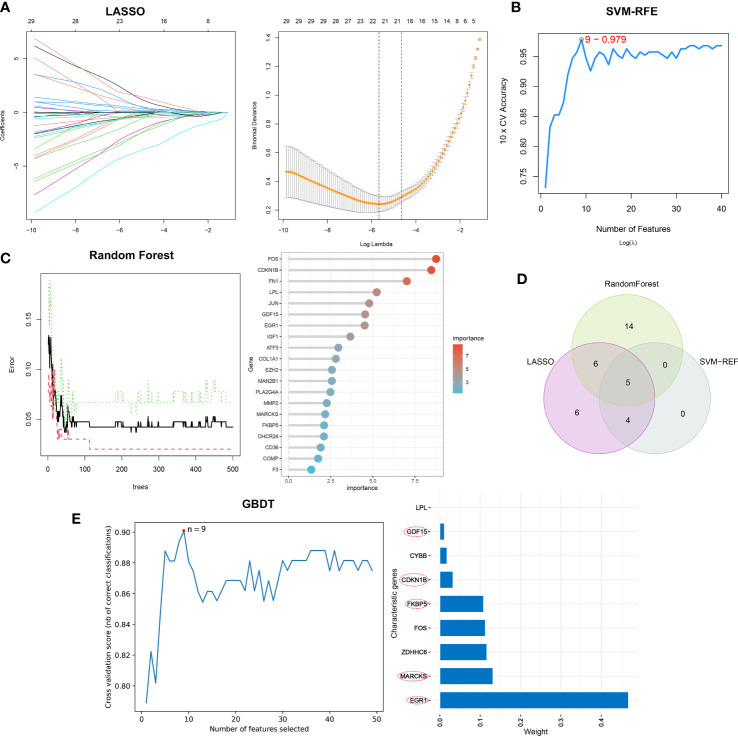
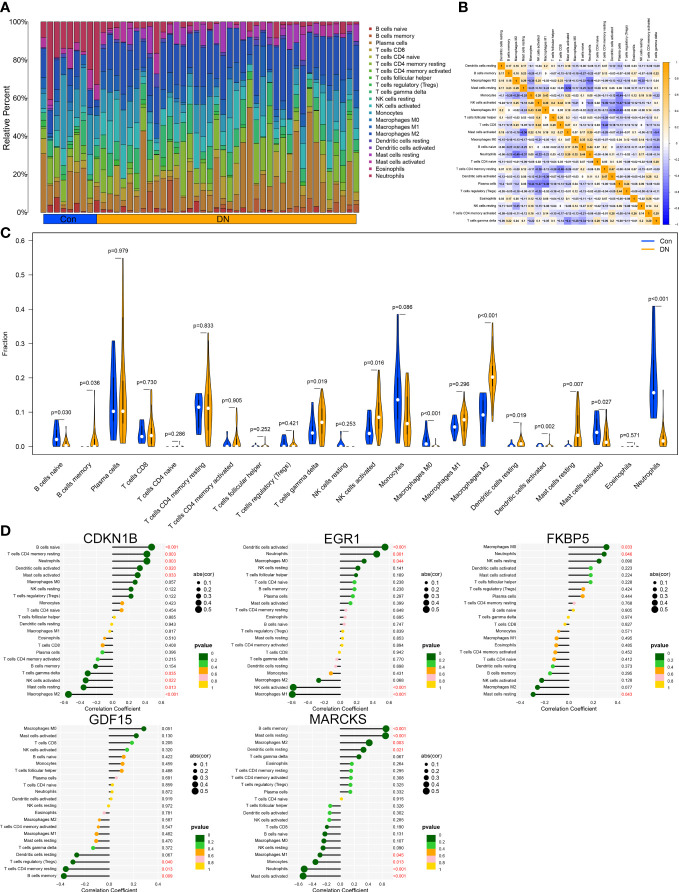
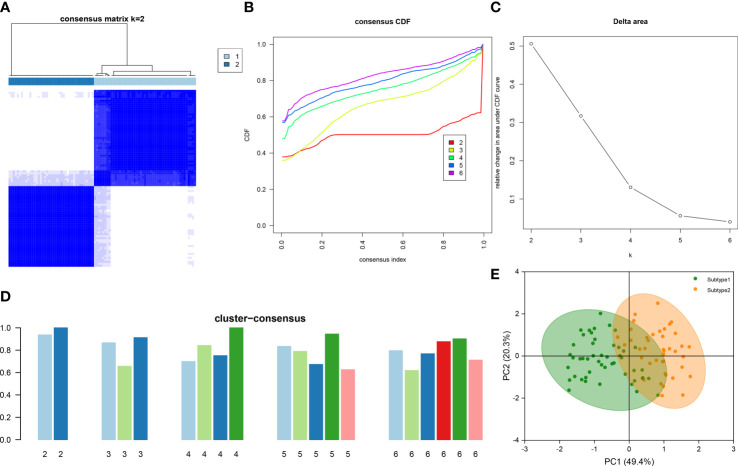
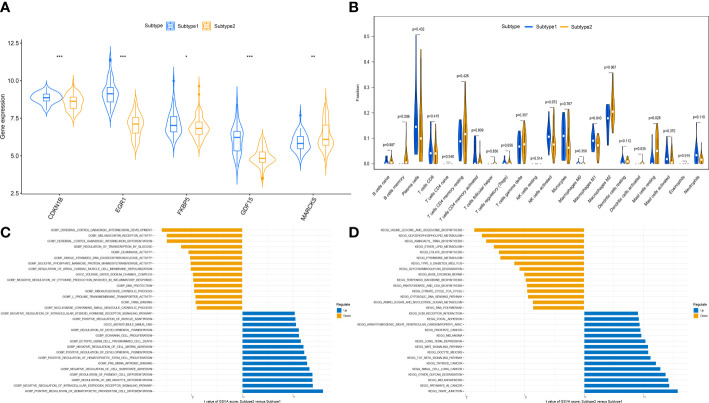
Methods: Microarray datasets were retrieved from the Gene Expression Omnibus (GEO) database, and ER stress-related genes (ERSRGs) were downloaded from the MSigDB and GeneCards database. We identified hub ERSRGs for DN progression by intersecting ERSRGs with differentially expressed genes and significant genes in WGCNA, followed by a functional analysis. After analyzing hub ERSRGs with three machine learning techniques and taking the intersection, we did external validation as well as developed a DN diagnostic model based on the characteristic genes. Immune infiltration was performed using CIBERSORT. Moreover, patients with DN were then categorized using a consensus clustering approach. Eventually, the candidate ERSRGs-specific small-molecule compounds were defined by CMap.
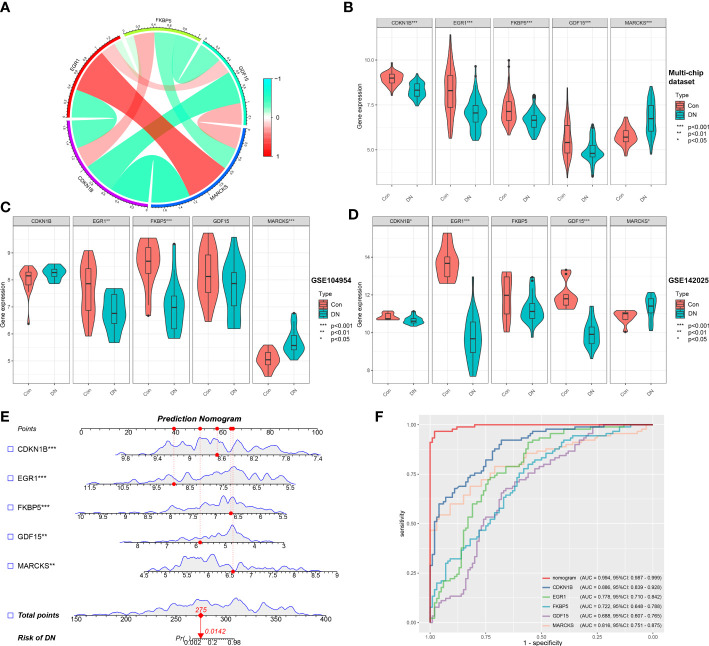
Results: Several biological pathways driving pathological injury of DN and disordered levels of immune infiltration were revealed in the DN microarray datasets and strongly related to deregulated ERSRGs by bioinformatics multi-chip integration. Moreover, CDKN1B, EGR1, FKBP5, GDF15, and MARCKS were identified as ER stress signature genes associated with DN by machine learning algorithms, demonstrating their potential as DN biomarkers.
Conclusions: Our research sheds fresh light on the function of ER stress in DN pathophysiology and the development of early diagnostic and ER stress-related treatment targets in patients with DN.
Keywords: WGCNA (weighted gene co-expression network analysis); diabetic nephropathy; endoplasmic reticulum stress; immune cell infiltration; machine learning; molecular subtypes.
Copyright © 2023 Su, Peng, Wang, Xie, Zhou, Chen, Shi, Guo, Zheng, Guo, Dong, Zhang and Liu.
Conflict of interest statement
The authors declare that the research was conducted in the absence of any commercial or financial relationships that could be construed as a potential conflict of interest.
Figures
Similar articles
-
Identification of immune-associated biomarkers of diabetes nephropathy tubulointerstitial injury based on machine learning: a bioinformatics multi-chip integrated analysis.BioData Min. 2024 Jul 1;17(1):20. doi: 10.1186/s13040-024-00369-x. BioData Min. 2024. PMID: 38951833 Free PMC article.
-
Identification of mitochondria-related genes as diagnostic biomarkers for diabetic nephropathy and their correlation with immune infiltration: New insights from bioinformatics analysis.Int Immunopharmacol. 2024 Dec 5;142(Pt A):113114. doi: 10.1016/j.intimp.2024.113114. Epub 2024 Sep 12. Int Immunopharmacol. 2024. PMID: 39265357
-
Integrating bioinformatics and machine learning to identify glomerular injury genes and predict drug targets in diabetic nephropathy.Sci Rep. 2025 May 15;15(1):16868. doi: 10.1038/s41598-025-01628-5. Sci Rep. 2025. PMID: 40374840 Free PMC article.
-
Utilizing machine learning algorithms to identify biomarkers associated with diabetic nephropathy: A review.Medicine (Baltimore). 2024 Feb 23;103(8):e37235. doi: 10.1097/MD.0000000000037235. Medicine (Baltimore). 2024. PMID: 38394492 Free PMC article. Review.
-
Network pharmacology-based identification of miRNA expression of Astragalus membranaceus in the treatment of diabetic nephropathy.Medicine (Baltimore). 2022 Feb 4;101(5):e28747. doi: 10.1097/MD.0000000000028747. Medicine (Baltimore). 2022. PMID: 35119030 Free PMC article.
Cited by
-
Identification of Lipotoxicity-Related Biomarkers in Diabetic Nephropathy Based on Bioinformatic Analysis.J Diabetes Res. 2024 May 14;2024:5550812. doi: 10.1155/2024/5550812. eCollection 2024. J Diabetes Res. 2024. PMID: 38774257 Free PMC article.
-
SKP alleviates the ferroptosis in diabetic kidney disease through suppression of HIF-1α/HO-1 pathway based on network pharmacology analysis and experimental validation.Chin Med. 2024 Feb 25;19(1):31. doi: 10.1186/s13020-024-00901-5. Chin Med. 2024. PMID: 38403669 Free PMC article.
-
Identification of potential biomarkers for lung cancer using integrated bioinformatics and machine learning approaches.PLoS One. 2025 Feb 27;20(2):e0317296. doi: 10.1371/journal.pone.0317296. eCollection 2025. PLoS One. 2025. PMID: 40014586 Free PMC article.
-
Identification and experimental validation of mitochondrial and endoplasmic reticulum stress related gene in diabetic nephropathy.Sci Rep. 2025 Aug 7;15(1):28980. doi: 10.1038/s41598-025-11097-5. Sci Rep. 2025. PMID: 40775242 Free PMC article.
-
Using Bioinformatics and Machine Learning to Predict the Genetic Characteristics of Ferroptosis-Cuproptosis-Related Genes Associated with Sleep Deprivation.Nat Sci Sleep. 2024 Sep 24;16:1497-1513. doi: 10.2147/NSS.S473022. eCollection 2024. Nat Sci Sleep. 2024. PMID: 39347483 Free PMC article.
References
Publication types
MeSH terms
Substances
LinkOut - more resources
Full Text Sources
Medical
Miscellaneous