

A framework for future national pediatric pandemic respiratory disease severity triage: The HHS pediatric COVID-19 data challenge
- PMID: 37745933
- PMCID: PMC10514686
- DOI: 10.1017/cts.2023.549
A framework for future national pediatric pandemic respiratory disease severity triage: The HHS pediatric COVID-19 data challenge
Abstract
Introduction: With persistent incidence, incomplete vaccination rates, confounding respiratory illnesses, and few therapeutic interventions available, COVID-19 continues to be a burden on the pediatric population. During a surge, it is difficult for hospitals to direct limited healthcare resources effectively. While the overwhelming majority of pediatric infections are mild, there have been life-threatening exceptions that illuminated the need to proactively identify pediatric patients at risk of severe COVID-19 and other respiratory infectious diseases. However, a nationwide capability for developing validated computational tools to identify pediatric patients at risk using real-world data does not exist.
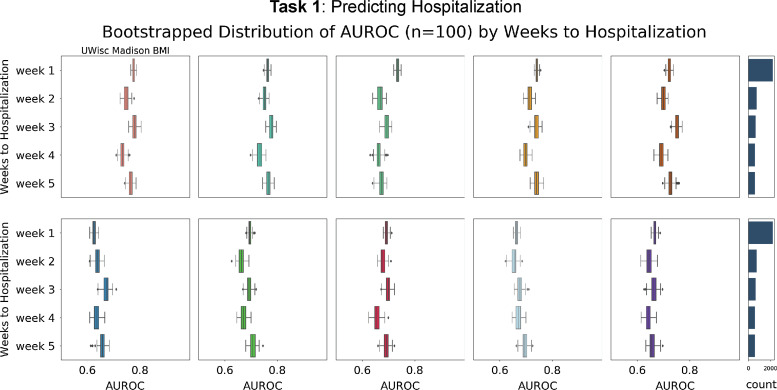
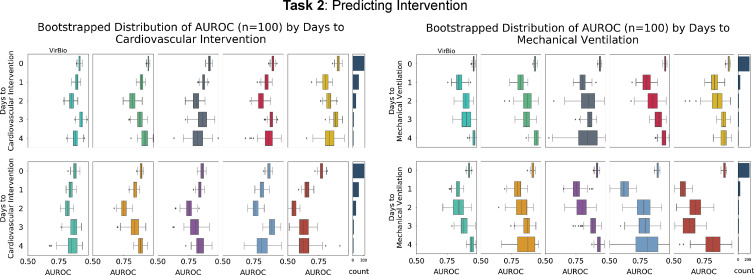
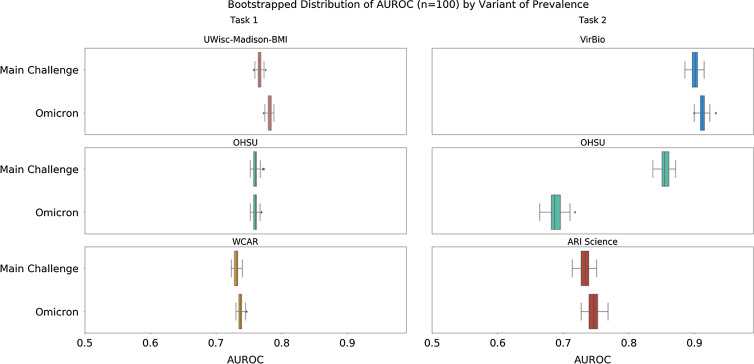
Methods: HHS ASPR BARDA sought, through the power of competition in a challenge, to create computational models to address two clinically important questions using the National COVID Cohort Collaborative: (1) Of pediatric patients who test positive for COVID-19 in an outpatient setting, who are at risk for hospitalization? (2) Of pediatric patients who test positive for COVID-19 and are hospitalized, who are at risk for needing mechanical ventilation or cardiovascular interventions?
Results: This challenge was the first, multi-agency, coordinated computational challenge carried out by the federal government as a response to a public health emergency. Fifty-five computational models were evaluated across both tasks and two winners and three honorable mentions were selected.
Conclusion: This challenge serves as a framework for how the government, research communities, and large data repositories can be brought together to source solutions when resources are strapped during a pandemic.
Keywords: COVID-19; Pediatrics; community challenges; evaluation; machine learning.
© The Author(s) 2023.
Conflict of interest statement
The views expressed are solely those of the authors and do not necessarily represent those of the U.S. Department of Health and Human Services. Timothy Bergquist, Tellen Bennett, and Richard Moffitt disclosed that this work was performed by Sage Bionetworks and its subcontractors under a grant with the National Institute of Health (U24TR002306). Additional funding for Timothy Bergquist was provided through the Bill and Melinda Gates Foundation (INV- 018455). Marie Wax and Hui-Hsing Wong disclose that they are government support contractors employed by Aveshka Inc. and Tunnell Government Services Inc. respectively, which receives funds from the U.S. government under contract to provide technical and programmatic support for HHS-BARDA. Joy Alamgir discloses that he is a founder and a shareholder of ARIScience. Tellen Bennett has received funding from the National Institutes of Health – NCATS, Eunice Kennedy Shriver NICHD, and National Heart, Lung and Blood Institute (NHLBI).
Figures
References
-
- Kristie E.N. Seroprevalence of Infection-Induced SARS-CoV-2 Antibodies — United States, September 2021–February 2022. https://www.cdc.gov/mmwr/volumes/71/wr/mm7117e3.htm. Accessed April 29, 2022. - PMC - PubMed
-
- Children and COVID-19: State-Level Data Report. American Academy of Pediatrics. https://www.aap.org/en/pages/2019-novel-coronavirus-covid-19-infections/.... Accessed December 29, 2022.
-
- Delahoy MJ, Ujamaa D, Taylor CA, et al. Comparison of influenza and COVID-19-associated hospitalizations among children < 18 years old in the United States-FluSurv-NET (October-April 2017-2021) and COVID-NET (October 2020-September 2021). Clin Infect Dis: An Offic Pub Infect Dis Soc Am 2023; 76(3): e450–e459. - PMC - PubMed
Grants and funding
LinkOut - more resources
Full Text Sources