. 2023 Sep 7:14:1075344.
doi: 10.3389/fpls.2023.1075344. eCollection 2023.

Invasive alien plants are phylogenetically distinct from other alien species across spatial and taxonomic scales in China

Affiliations

Invasive alien plants are phylogenetically distinct from other alien species across spatial and taxonomic scales in China

Achyut Kumar Banerjee et al. Front Plant Sci. .

Abstract

Introduction: Phylogenetic relatedness is one of the important factors in the community assembly process. Here, we aimed to understand the large-scale phylogenetic relationship between alien plant species at different stages of the invasion process and how these relationships change in response to the environmental filtering process at multiple spatial scales and different phylogenetic extents.

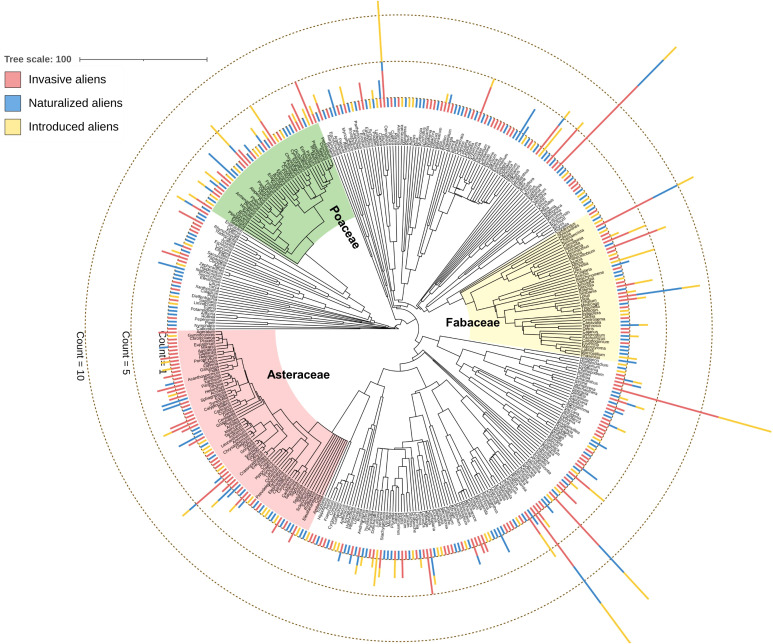
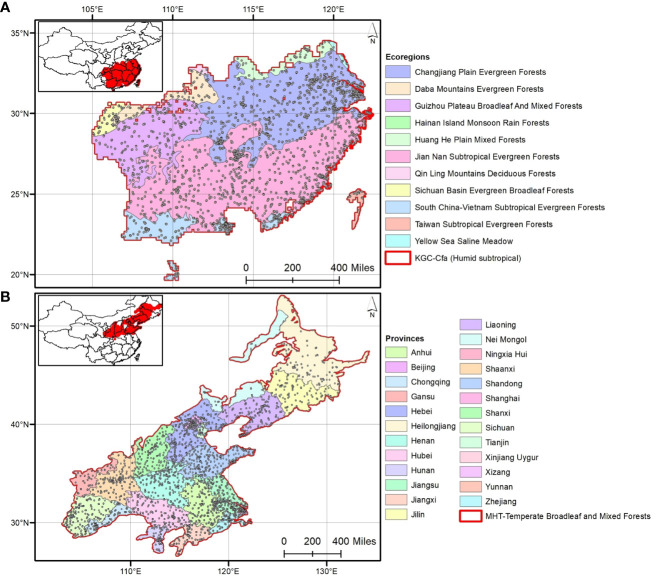
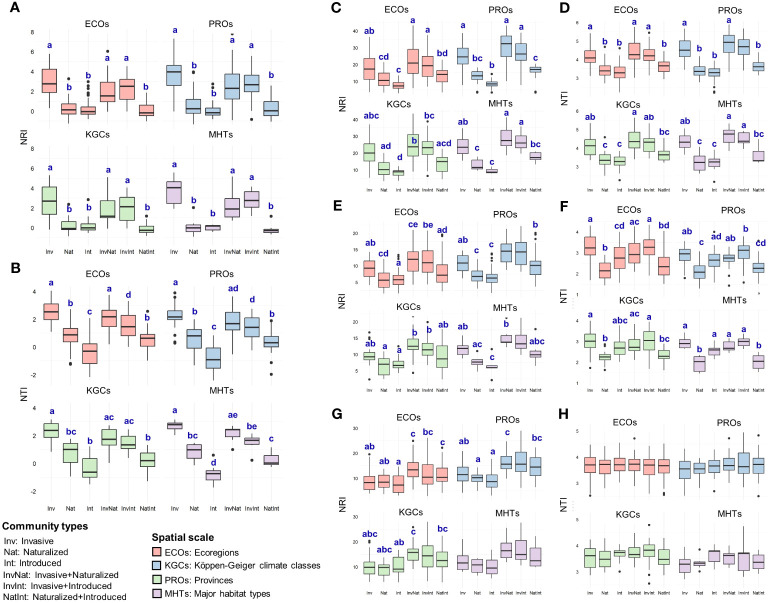
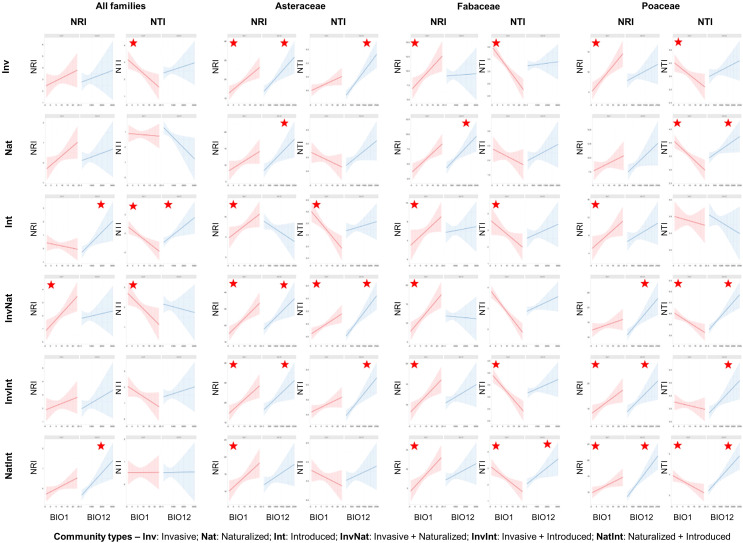
Methods: We identified the alien species in three invasion stages, namely invasive, naturalized, and introduced, in China. The occurrence records of the species were used to quantify two abundance-based phylogenetic metrics [the net relatedness index (NRI) and the nearest taxon index (NTI)] from a highly resolved phylogenetic tree. The metrics were compared between the three categories of alien species. Generalized linear models were used to test the effect of climate on the phylogenetic pattern. All analyses were conducted at four spatial scales and for three major angiosperm families.

Results: We observed significantly higher NRI and NTI values at finer spatial scales, indicating the formation of more clustered assemblages of phylogenetically closely related species in response to the environmental filtering process. Positive NTI values for the invasive and naturalized aliens suggested that the presence of a close relative in the community may help the successful naturalization and invasion of the introduced alien species. In the two-dimensional phylogenetic space, the invasive species communities significantly differed from the naturalized and introduced species, indicating that established alien species need to be phylogenetically different to become invasive. Positive phylogenetic measures for the invasive aliens across the spatial scales suggested that the presence of invasive aliens could facilitate the establishment of other invasive species. Phylogenetic relatedness was more influenced by temperature than precipitation, especially at a finer spatial scale. With decreased temperature, the invasive species showed a more clustered assemblage, indicating conservatism of their phylogenetic niche. The phylogenetic pattern was different at the family level, although there was a consistent tendency across families to form more clustered assemblages.

Discussion: Overall, our study showed that the community assemblage became more clustered with the progression of the invasion process. The phylogenetic measures varied at spatial and taxonomic scales, thereby highlighting the importance of assessing phylogenetic patterns at different gradients of the community assembly process.

Keywords: biological invasion; community assembly; invasion process; invasional meltdown; phylogenetic niche conservatism; phylogenetic structure; phylogeny.


Conflict of interest statement

The authors declare that the research was conducted in the absence of any commercial or financial relationships that could be construed as a potential conflict of interest.

Figures

Figure 1
Figure 1
Genus-level phylogenetic tree of the 397 angiosperm genera of 706 alien angiosperm species considered in this study. The stacked bars at the tip of the genus names indicate the number of species of three alien species categories (see Supplementary Data 1 for the number of species belonging to the three alien species categories). The clades of three major families analyzed separately in this study are indicated.
Figure 2
Figure 2
The four spatial scales considered in this study to analyze phylogenetic relationships: (A) out of 16 Köppen-Geiger climate classes (KGCs), the humid subtropical KGC is shown that contains 11 out of 47 ecoregions; (B) out of seven major habitat types (MHTs), the temperate broadleaf and mixed forests is shown distributing across 25 out of 34 provinces in China. The selected KGC and MHT are marked in red.
Figure 3
Figure 3
Phylogenetic position and anomalies of six community types – (A) The scatter plots showing the position of the six community types at four spatial scales in the two-dimensional phylogenetic spaces constructed from the net relatedness index (NRI) and nearest taxon index (NTI); (B) the bar plots showing the NRI and NTI anomalies for six community types at species- and family-level (Ast, Asteraceae; Fab, Fabaceae; Poa, Poaceae); at four spatial scales (ECOs, Ecoregions; KGCs, Köppen-Geiger climate classes; PROs, Provinces; MHTs, Major habitat types).
Figure 4
Figure 4
Comparative assessment of the net relatedness index (NRI) and nearest taxon index (NTI) between six community types at – (A, B) species level and (C-H) family level [(C, D) Asteraceae; (E, F): Fabaceae; (G, H) Poaceae], at four spatial scales (ECOs, Ecoregions; PROs, Provinces; KGCs, Köppen-Geiger climate classes; MHTs, Major habitat types) separately. Different letters on the box plots indicate significant differences (at p<0.05 level) between the community types. The box plots without letters on top indicate no significant differences between the community types. The statistical estimates (F-values, t-statistics, degrees of freedom, and actual p-values) are given in Supplementary Data 5.
Figure 5
Figure 5
Scatterplots of regression analysis outputs showing the influence of two bioclimatic variables (annual mean temperature: BIO1 and annual precipitation: BIO12) on the two phylogenetic measures: net relatedness index (NRI) and nearest taxon index (NTI). The regression analyses were conducted for six community types, at species- and family levels, and at four spatial scales (the outputs of the finest spatial scale, i.e., the Ecoregion scale, are shown here). The red stars indicate significant relationships at p<0.05 level. The statistical estimates of all regression models (t statistics, degrees of freedom, and actual p-values) are provided in Supplementary Data 6.
Figure 6
Figure 6
Scatterplots showing correlations of the phylogenetic measures [net relatedness index (NRI) and nearest taxon index (NTI)] between the communities with alien species of three invasion categories occurring alone at the finest spatial scale, i.e., the Ecoregion scale. The correlation analyses were conducted at the species level (top row) and family level (bottom rows). At the family level, correlations of the NRI and NTI values between the communities are presented in separate plots. The rho and p-values are mentioned, and the red stars indicate significant correlations at p<0.05. The statistical estimates (rho values, actual p-values, and sample sizes) of the correlations of the phylogenetic measures between all six community types at four spatial scales are provided in Supplementary Data 7.

Similar articles

References

    1. Axmacher J. C., Sang W. (2013). Plant invasions in China – challenges and chances. PloS One 8, e64173. doi: 10.1371/journal.pone.0064173 - DOI - PMC - PubMed
    1. Brown J. L. (2014). SDMtoolbox: a python-based GIS toolkit for landscape genetic, biogeographic and species distribution model analyses. Methods Ecol. Evol. 5, 694–700. doi: 10.1111/2041-210X.12200 - DOI - PMC - PubMed
    1. Carvallo G. O., Teillier S., Castro S. A., Figueroa J. A. (2014). The phylogenetic properties of native- and exotic-dominated plant communities. Austral Ecol. 39, 304–312. doi: 10.1111/aec.12079 - DOI
    1. Chamberlain S., Szöcs E. (2013). taxize: taxonomic search and retrieval in R [version 2; peer review: 3 approved]. F1000Research 2, 191. doi: 10.12688/f1000research.2-191.v1 - DOI - PMC - PubMed
    1. Cooper N., Freckleton R. P., Jetz W. (2011). Phylogenetic conservatism of environmental niches in mammals. Proc. R. Soc. B.: Biol. Sci. 278, 2384–2391. doi: 10.1098/rspb.2010.2207 - DOI - PMC - PubMed