. 2023 Sep 8:14:1192151.
doi: 10.3389/fpls.2023.1192151. eCollection 2023.

Study on the effect of magnesium on leaf metabolites, growth and quality of tea tree

Affiliations

Study on the effect of magnesium on leaf metabolites, growth and quality of tea tree

Ying Zhang et al. Front Plant Sci. .

Abstract

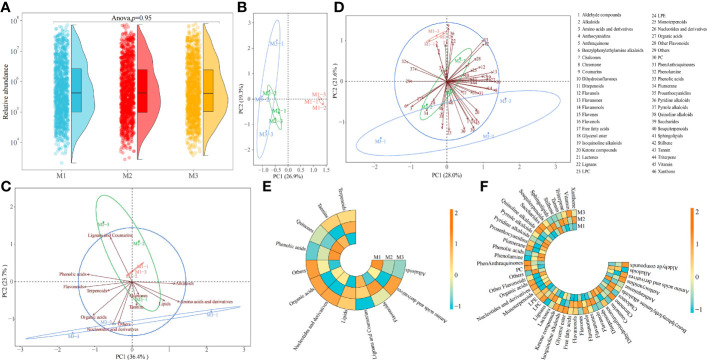
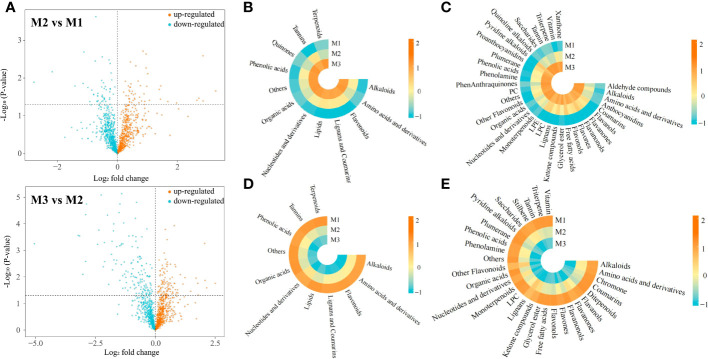
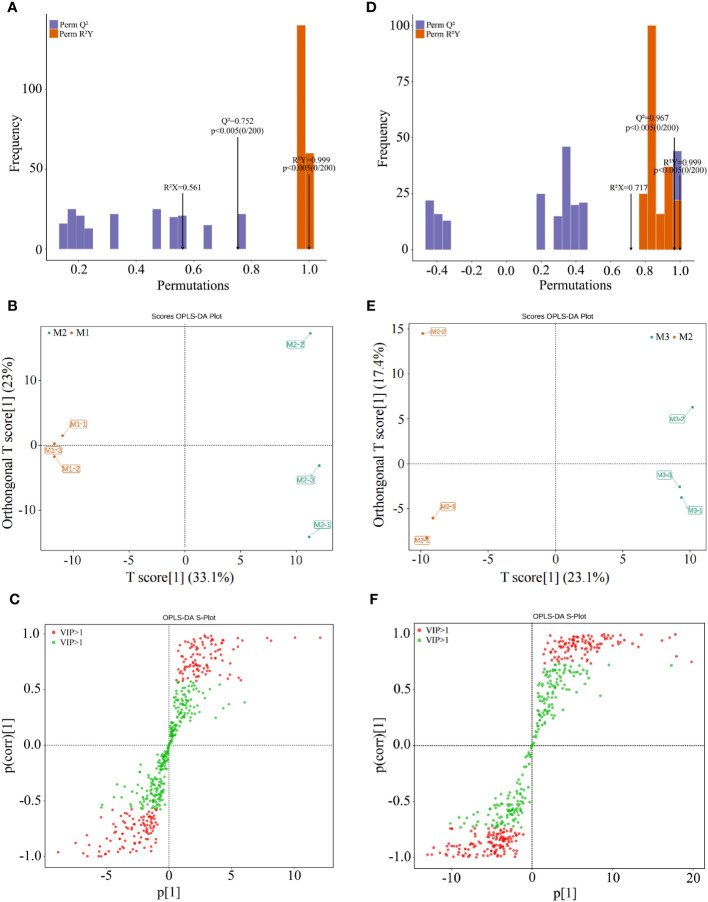
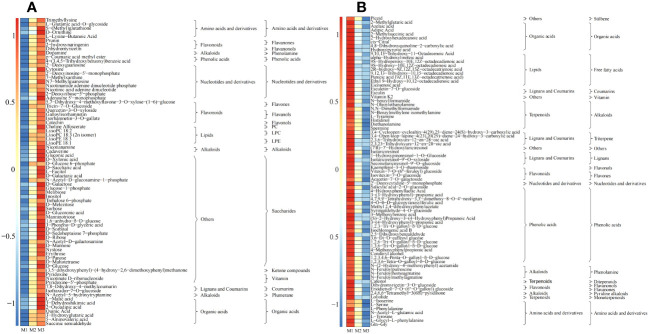
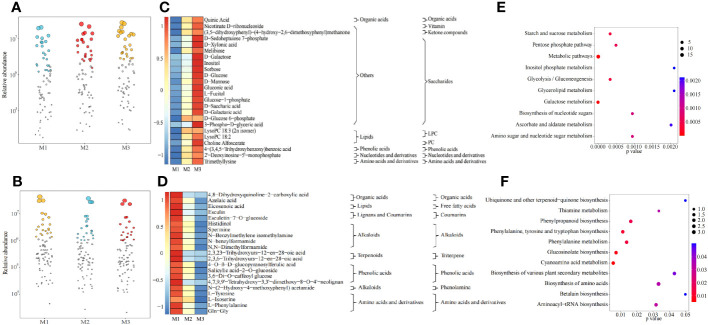
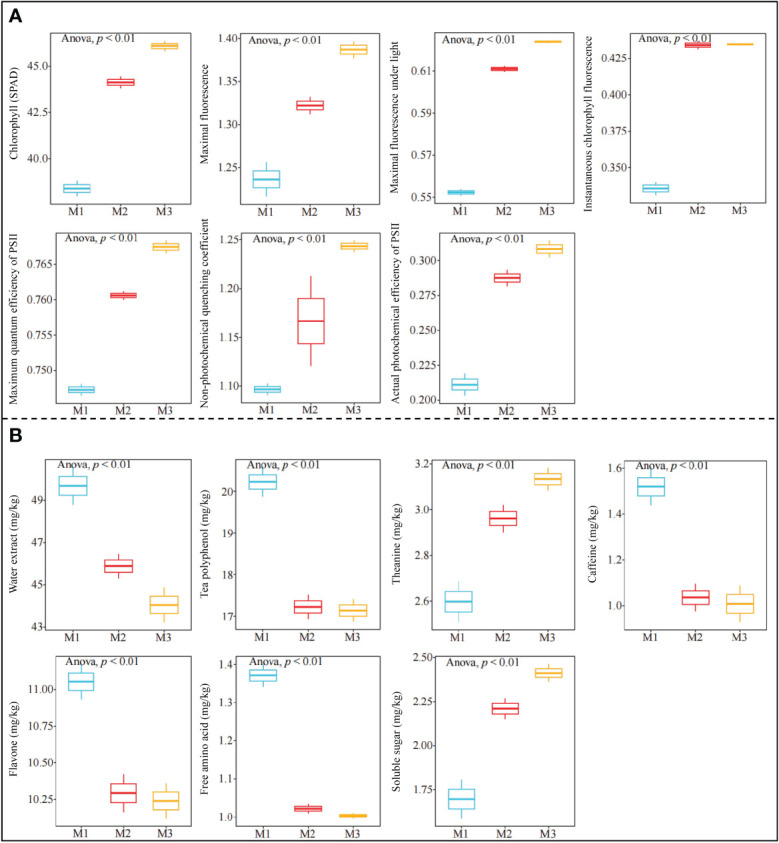
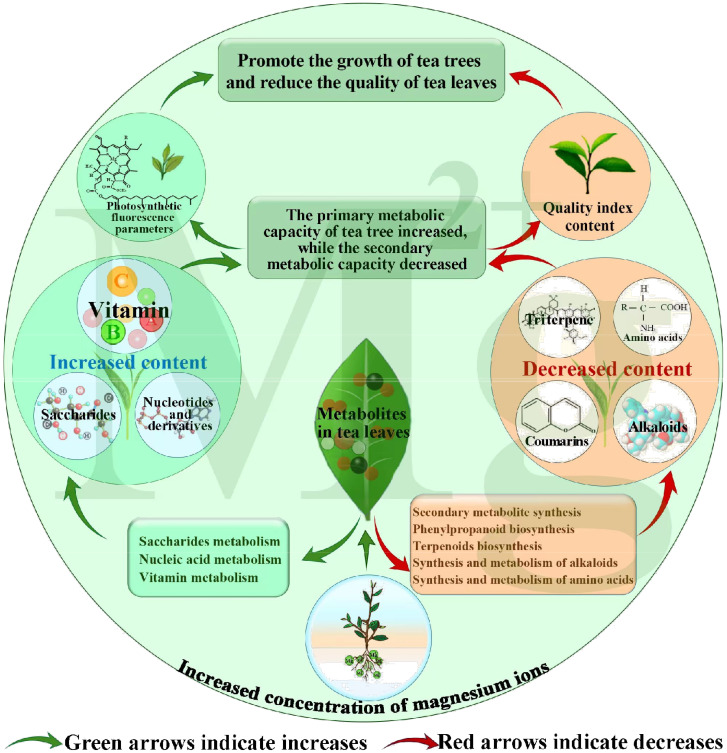
Magnesium (Mg) is one of the essential elements for the growth of tea trees. In this study, we investigated changes in metabolites, photosynthetic fluorescence parameters and quality indexes of tea leaves under different concentrations of magnesium treatment, and the results showed that there were no significant differences in the quantity and total content of metabolites in tea leaves under different Mg concentrations. The results of volcano map analysis showed that the content of 235 metabolites in tea leaves showed an increasing trend and the content of 243 metabolites showed a decreasing trend with the increase of Mg concentration. The results of the combined analysis of the OPLS-DA model and bubble map showed that 45 characteristic metabolites were screened at different concentrations of Mg. Among these, the content of 24 characteristic metabolites showed an increasing trend and 21 characteristic metabolites showed a decreasing trend with the increase of Mg concentrations. The results of KEEG pathway enrichment showed that 24 characteristic metabolites with a upward trend were significantly enriched in saccharides metabolism, nucleic acid metabolism and vitamin metabolism, while the 21 characteristic metabolites with a downward trend were enriched in the synthesis of plant secondary metabolites, phenylpropanoid biosynthesis, biosynthesis of terpenoids, synthesis and metabolism of alkaloids, and synthesis and metabolism of amino acids. It can be inferred that Mg regulation was beneficial to enhance the photosynthetic capacity of tea trees, improve the accumulation and metabolism of carbohydrate substances in tea trees, and thus promoted the growth of tea trees, but was not conducive to the synthesis of secondary metabolites and amino acids related to tea quality. The results of photosynthetic fluorescence parameters and quality indexes of the tea tree confirmed the conclusion predicted by metabolomics. This study provided a reference for regulating of the growth and quality of tea trees with Mg fertilizer in tea plantations.

Keywords: magnesium; metabolomics; photosynthesis; quality; tea tree.


Conflict of interest statement

The authors declare that the research was conducted in the absence of any commercial or financial relationships that could be construed as a potential conflict of interest.

Figures

Figure 1
Figure 1
Metabolomic analysis of tea leaves under different Mg concentrations M1: Control; M2: The Mg concentration is 0.4 mmol/L; M3: The Mg concentration is 0.8 mmol/L; (A) Analysis of total metabolites content in tea leaves; (B) PCA analysis of metabolites in tea leaves; (C) PCA analysis of primary classification of metabolites in tea leaves; (D) PCA analysis of secondary classification of metabolites in tea leaves; (E) Heat map analysis of metabolites content in tea leaves in primary classification; (F) Heat map analysis of metabolites content in tea leaves in secondary classification.
Figure 2
Figure 2
Comparative analysis of metabolites in tea leaves under different Mg concentrations M1: Control; M2: The Mg concentration is 0.4 mmol/L; M3: The Mg concentration is 0.8 mmol/L; (A) Volcanic map analysis of metabolites in tea leaves under different Mg concentrations; (B) Heat map of primary classification of metabolites with increased content under different Mg concentrations; (C) Heat map of secondary classification of metabolites with increased content under with different Mg concentrations; (D) Heat map of primary classification of metabolites with decreased content under different Mg concentrations; (E) Heat map of secondary classification of metabolites with decreased content under different Mg concentrations.
Figure 3
Figure 3
OPLS-DA model screening of key metabolites in tea leaves treated with different Mg concentrations M1: Control; M2: The Mg concentration is 0.4 mmol/L; M3: The Mg concentration is 0.8 mmol/L; (A) The OPLS-DA model for the fitting degree test of M2 and M1; (B) The OPLS-DA model for analysis of metabolites of M2 and M1; (C) The OPLS-DA loading diagram for metabolites of M2 and M1; (D) The OPLS-DA model for the fitting degree test of M3 and M2; (E) The OPLS-DA model for analysis of metabolites of M3 and M2; (F) The OPLS-DA loading diagram for metabolites of M3 and M2.
Figure 4
Figure 4
Content analysis of key metabolites screened by the OPLS-DA model M1: Control; M2: The Mg concentration is 0.4 mmol/L; M3: The Mg concentration is 0.8 mmol/L; (A) Heat map analysis of key metabolites with increased content under different Mg concentrations; (B) Heat map analysis of key metabolites with decreased content under different Mg concentrations.
Figure 5
Figure 5
Characteristic metabolites screening from key metabolites M1: Control; M2: The Mg concentration is 0.4 mmol/L; M3: The Mg concentration is 0.8 mmol/L; (A) Bubble characteristics of key metabolites with increased content under different Mg concentrations; (B) Bubble characteristics of key metabolites with decreased content under different Mg concentrations; (C) Heat map analysis of characteristic metabolites with increased content under different Mg concentrations; (D) Heat map analysis of characteristic metabolites with decreased content under different Mg concentrations; (E) KEEG pathway analysis of 24 characteristic metabolites with increased content; (F) KEEG pathway analysis of 21 characteristic metabolites with decreased content.
Figure 6
Figure 6
Effects of different Mg concentrations on growth and quality indexes of tea tree M1: Control; M2: The Mg concentration is 0.4 mmol/L; M3: The Mg concentration is 0.8 mmol/L; (A) Analysis of photosynthetic fluorescence parameters of tea tree under Mg regulation; (B) Analysis of tea quality index under Mg regulation.
Figure 7
Figure 7
Mechanism of changes in metabolites of tea leaves under Mg regulation.

Similar articles

Cited by

References

    1. Ahmad M. A., Deng X., Adeel M., Rizwan M., Shakoor N., Yang Y., et al. . (2022). Influence of calcium and magnesium elimination on plant biomass and secondary metabolites of Stevia rebaudiana Bertoni. Biotechnol. Appl. Bioc 69 (5), 2008–2016. doi: 10.1002/bab.2263 - DOI - PubMed
    1. Anand V., Kashyap M., Samadhiya K., Ghosh A., KIran B. (2019). Salinity driven stress to enhance lipid production in Scenedesmus vacuolatus: a biodiesel trigger? Biomass Bioenerg 127, 105252. doi: 10.1016/j.biombioe.2019.05.021 - DOI
    1. Esteves E., Kadyampakeni D. M., Zambon F., Ferrarezi R. S., Maltais-Landry G. (2022). Magnesium fertilization has a greater impact on soil and leaf nutrient concentrations than nitrogen or calcium fertilization in Florida orange production. Nutr. Cycl Agroecosys 122 (1), 73–87. doi: 10.1007/s10705-021-10182-1 - DOI
    1. General Administration of Quality Supervision, Inspection and Quarantine of the People's Republic of China (2013. a). “GBT8312-2013 Tea-Determination of caffeine content,” in Method using high-performance liquid chromatography (Beijing: China Standards Press; ), 1–5.
    1. General Administration of Quality Supervision, Inspection and Quarantine of the People's Republic of China (2013. b). GBT8314-2013 Tea-Determination of free amino acids content (Beijing: China Standards Press; ), 1–5.

LinkOut - more resources