

Expanding the Biological Role of Lipo-Chitooligosaccharides and Chitooligosaccharides in Laccaria bicolor Growth and Development
- PMID: 37746234
- PMCID: PMC10512320
- DOI: 10.3389/ffunb.2022.808578
Expanding the Biological Role of Lipo-Chitooligosaccharides and Chitooligosaccharides in Laccaria bicolor Growth and Development
Abstract
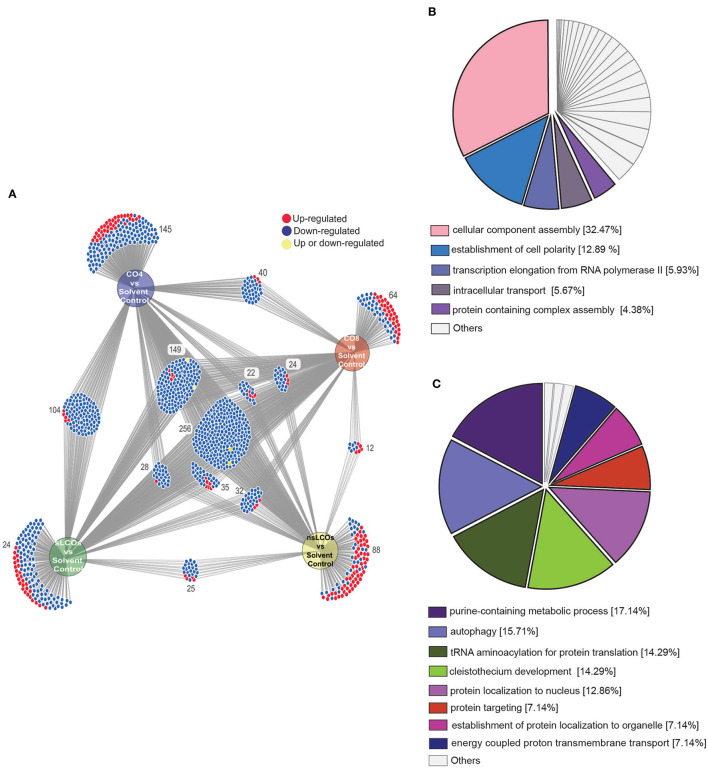
The role of lipo-chitooligosaccharides (LCOs) as signaling molecules that mediate the establishment of symbiotic relationships between fungi and plants is being redefined. New evidence suggests that the production of these molecular signals may be more of a common trait in fungi than what was previously thought. LCOs affect different aspects of growth and development in fungi. For the ectomycorrhizal forming fungi, Laccaria bicolor, the production and effects of LCOs have always been studied with a symbiotic plant partner; however, there is still no scientific evidence describing the effects that these molecules have on this organism. Here, we explored the physiological, molecular, and metabolomic changes in L. bicolor when grown in the presence of exogenous sulfated and non-sulfated LCOs, as well as the chitooligomers, chitotetraose (CO4), and chitooctaose (CO8). Physiological data from 21 days post-induction showed reduced fungal growth in response to CO and LCO treatments compared to solvent controls. The underlying molecular changes were interrogated by proteomics, which revealed substantial alterations to biological processes related to growth and development. Moreover, metabolite data showed that LCOs and COs caused a downregulation of organic acids, sugars, and fatty acids. At the same time, exposure to LCOs resulted in the overproduction of lactic acid in L. bicolor. Altogether, these results suggest that these signals might be fungistatic compounds and contribute to current research efforts investigating the emerging impacts of these molecules on fungal growth and development.
Keywords: Laccaria bicolor; chitooligosaccharides; lipo-chitooligosaccharides; polarized growth; proteomics.
Copyright © 2022 Villalobos Solis, Engle, Spangler, Cottaz, Fort, Maeda, Ané, Tschaplinski, Labbé, Hettich, Abraham and Rush.
Conflict of interest statement
This study received funding from the Genomic Science Program, US Department of Energy (DOE), Office of Science, Biological and Environmental Research, as part of the Plant Microbe Interfaces Scientific Focus Areas at the Oak Ridge National Laboratory (ORNL). ORNL is managed by UT-Battelle LLC for DOE under contract DE-AC05-00OR22725. This work was also supported by the NSF award # 1546742 as well as USDA Hatch #WIS03041 to JMA. Lastly, partial financial support from the LABEX ARCANE and CBH-EUR-GS (ANR-17-561 EURE-0003), Glyco@Alps (ANR-15-IDEX-02), and PolyNat Carnot Institut (ANR-16-CARN562 0025-01) for SF and SC. The funder was not involved in the study design, collection, analysis, interpretation of data, the writing of this article, or the decision to submit it for publication. The remaining authors declare that the research was conducted in the absence of any commercial or financial relationships that could be construed as a potential conflict of interest.
Figures


Similar articles
-
Lipo-Chitooligosaccharides Induce Specialized Fungal Metabolite Profiles That Modulate Bacterial Growth.mSystems. 2022 Dec 20;7(6):e0105222. doi: 10.1128/msystems.01052-22. Epub 2022 Dec 1. mSystems. 2022. PMID: 36453934 Free PMC article.
-
Lipo-chitooligosaccharides as regulatory signals of fungal growth and development.Nat Commun. 2020 Aug 4;11(1):3897. doi: 10.1038/s41467-020-17615-5. Nat Commun. 2020. PMID: 32753587 Free PMC article.
-
Deciphering the Chitin Code in Plant Symbiosis, Defense, and Microbial Networks.Annu Rev Microbiol. 2021 Oct 8;75:583-607. doi: 10.1146/annurev-micro-051921-114809. Annu Rev Microbiol. 2021. PMID: 34623896 Review.
-
Distinct genetic basis for root responses to lipo-chitooligosaccharide signal molecules from different microbial origins.J Exp Bot. 2021 May 4;72(10):3821-3834. doi: 10.1093/jxb/erab096. J Exp Bot. 2021. PMID: 33675231
-
A gap in the recognition of two mycorrhizal factors: new insights into two LysM-type mycorrhizal receptors.Front Plant Sci. 2024 Sep 20;15:1418699. doi: 10.3389/fpls.2024.1418699. eCollection 2024. Front Plant Sci. 2024. PMID: 39372858 Free PMC article. Review.
Cited by
-
Predicting receptor-ligand pairing preferences in plant-microbe interfaces via molecular dynamics and machine learning.Comput Struct Biotechnol J. 2025 Jun 18;27:2782-2795. doi: 10.1016/j.csbj.2025.06.029. eCollection 2025. Comput Struct Biotechnol J. 2025. PMID: 40677241 Free PMC article.
-
A soybean cyst nematode suppresses microbial plant symbionts using a lipochitooligosaccharide-hydrolysing enzyme.Nat Microbiol. 2024 Aug;9(8):1993-2005. doi: 10.1038/s41564-024-01727-5. Epub 2024 Jun 17. Nat Microbiol. 2024. PMID: 38886584
-
Lipo-Chitooligosaccharides Induce Specialized Fungal Metabolite Profiles That Modulate Bacterial Growth.mSystems. 2022 Dec 20;7(6):e0105222. doi: 10.1128/msystems.01052-22. Epub 2022 Dec 1. mSystems. 2022. PMID: 36453934 Free PMC article.
-
Diverse bacterial consortia: key drivers of rhizosoil fertility modulating microbiome functions, plant physiology, nutrition, and soybean grain yield.Environ Microbiome. 2024 Jul 19;19(1):50. doi: 10.1186/s40793-024-00595-0. Environ Microbiome. 2024. PMID: 39030648 Free PMC article.
-
Exploring the role of plant lysin motif receptor-like kinases in regulating plant-microbe interactions in the bioenergy crop Populus.Comput Struct Biotechnol J. 2022 Dec 31;21:1122-1139. doi: 10.1016/j.csbj.2022.12.052. eCollection 2023. Comput Struct Biotechnol J. 2022. PMID: 36789259 Free PMC article.
References
-
- Alexopoulos C. J., Mims C. W., Blackwell M. (1996). Introductory Mycology. Hoboken, NJ: John Wiley and Sons.
LinkOut - more resources
Full Text Sources
Miscellaneous