

Correlating physicochemical and biological properties to define critical quality attributes of a rAAV vaccine candidate
- PMID: 37746246
- PMCID: PMC10512015
- DOI: 10.1016/j.omtm.2023.06.004
Correlating physicochemical and biological properties to define critical quality attributes of a rAAV vaccine candidate
Abstract
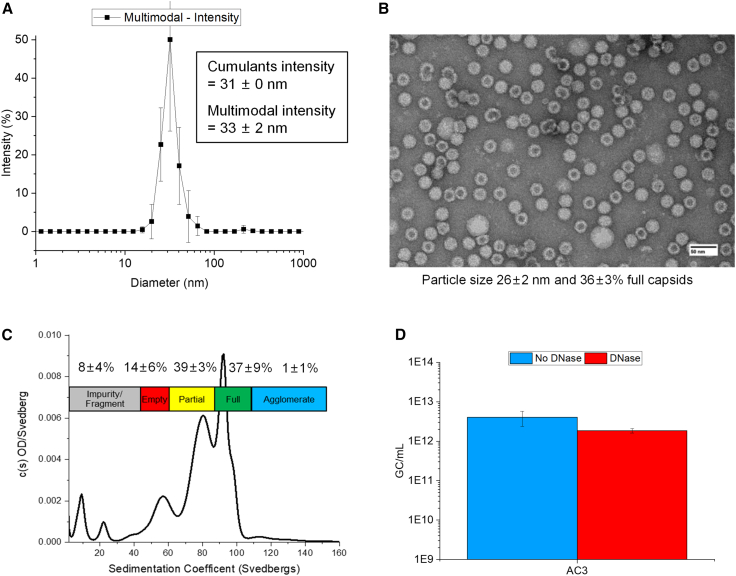
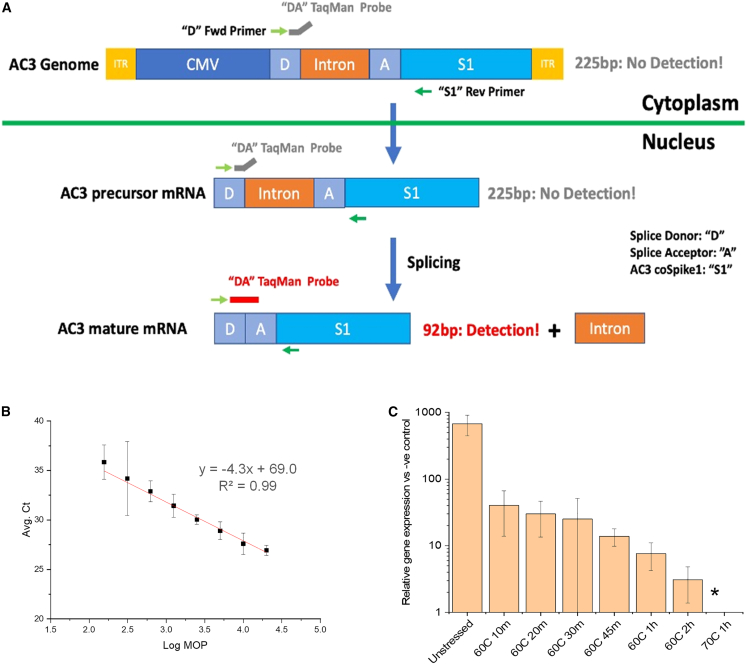
Recombinant adeno-associated viruses (rAAVs) are a preferred vector system in clinical gene transfer. A fundamental challenge to formulate and deliver rAAVs as stable and efficacious vaccines is to elucidate interrelationships between the vector's physicochemical properties and biological potency. To this end, we evaluated an rAAV-based coronavirus disease 2019 (COVID-19) vaccine candidate that encodes the Spike antigen (AC3) and is produced by a commercially viable process. First, state-of-the-art analytical techniques were employed to determine key structural attributes of AC3, including primary and higher-order structures, particle size, empty/full capsid ratios, aggregates, and multi-step thermal degradation pathway analysis. Next, several quantitative potency measures for AC3 were implemented, and data were correlated with the physicochemical analyses on thermally stressed and control samples. Results demonstrate links between decreasing AC3 physical stability profiles, in vitro transduction efficiency in a cell-based assay, and, importantly, in vivo immunogenicity in a mouse model. These findings are discussed in the general context of future development of rAAV-based vaccine candidates as well as specifically for the rAAV vaccine application under study.
Keywords: COVID-19; adeno-associated virus; analytical characterization; biological properties; formulation; immunogenicity; physicochemical properties; stability; transduction efficiency; vaccine.
© 2023 The Author(s).
Conflict of interest statement
L.H.V. is an inventor on AAVCOVID and AAV vaccine patent applications and a founder and employee of ciendias bio, a vaccine biotechnology company. N.Z. is an inventor on AAVCOVID and AAV vaccine patent applications.
Figures


Similar articles
-
Characterization of Recombinant Adeno-Associated Viruses (rAAVs) for Gene Therapy Using Orthogonal Techniques.Pharmaceutics. 2021 Apr 20;13(4):586. doi: 10.3390/pharmaceutics13040586. Pharmaceutics. 2021. PMID: 33923984 Free PMC article.
-
Analytical methods for process and product characterization of recombinant adeno-associated virus-based gene therapies.Mol Ther Methods Clin Dev. 2021 Feb 17;20:740-754. doi: 10.1016/j.omtm.2021.02.010. eCollection 2021 Mar 12. Mol Ther Methods Clin Dev. 2021. PMID: 33738328 Free PMC article. Review.
-
Mechanistic modeling explains the production dynamics of recombinant adeno-associated virus with the baculovirus expression vector system.Mol Ther Methods Clin Dev. 2023 Jun 2;30:122-146. doi: 10.1016/j.omtm.2023.05.019. eCollection 2023 Sep 14. Mol Ther Methods Clin Dev. 2023. PMID: 37746245 Free PMC article.
-
Evaluation of a rapid multi-attribute combinatorial high-throughput UV-Vis/DLS/SLS analytical platform for rAAV quantification and characterization.Mol Ther Methods Clin Dev. 2024 Jul 15;32(3):101298. doi: 10.1016/j.omtm.2024.101298. eCollection 2024 Sep 12. Mol Ther Methods Clin Dev. 2024. PMID: 39170800 Free PMC article.
-
The ice age - A review on formulation of Adeno-associated virus therapeutics.Eur J Pharm Biopharm. 2023 Sep;190:1-23. doi: 10.1016/j.ejpb.2023.07.002. Epub 2023 Jul 7. Eur J Pharm Biopharm. 2023. PMID: 37423416 Review.
Cited by
-
In-Depth Comparison of Adeno-Associated Virus Containing Fractions after CsCl Ultracentrifugation Gradient Separation.Viruses. 2024 Jul 31;16(8):1235. doi: 10.3390/v16081235. Viruses. 2024. PMID: 39205208 Free PMC article.
-
Quality assessment strategy development and analytical method selection of GMP grade biological drugs for gene and cell therapy.BBA Adv. 2025 Feb 19;7:100151. doi: 10.1016/j.bbadva.2025.100151. eCollection 2025. BBA Adv. 2025. PMID: 40094061 Free PMC article. Review.
-
Unfolding of viral protein 1 N-termini facilitates genome ejection from recombinant adeno-associated virus serotype 8.Mol Ther Methods Clin Dev. 2025 Apr 24;33(2):101480. doi: 10.1016/j.omtm.2025.101480. eCollection 2025 Jun 12. Mol Ther Methods Clin Dev. 2025. PMID: 40469751 Free PMC article.
References
-
- WHO Timeline: WHO's COVID-19 response. 2022. https://www.who.int/emergencies/diseases/novel-coronavirus-2019/interact...
-
- U.S. GAO. Operation Warp Speed: Accelerated COVID-19 Vaccine Development Status and Efforts to Address Manufacturing Challenges. 2021. https://www.gao.gov/products/gao-21-319
-
- Nasreen S., Chung H., He S., Brown K.A., Gubbay J.B., Buchan S.A., Fell D.B., Austin P.C., Schwartz K.L., Sundaram M.E., et al. Canadian Immunization Research Network CIRN Provincial Collaborative Network PCN Investigators Effectiveness of COVID-19 vaccines against symptomatic SARS-CoV-2 infection and severe outcomes with variants of concern in Ontario. Nat. Microbiol. 2022;7:379–385. doi: 10.1038/s41564-021-01053-0. - DOI - PubMed
LinkOut - more resources
Full Text Sources
