. 2023 Dec;91(12):1616-1635.
doi: 10.1002/prot.26593. Epub 2023 Sep 25.

Tertiary structure assessment at CASP15

Affiliations

Tertiary structure assessment at CASP15

Adam J Simpkin et al. Proteins. 2023 Dec.

Abstract

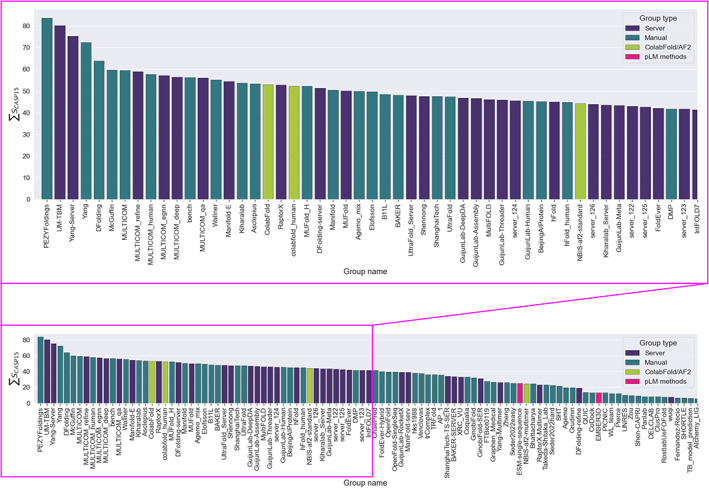
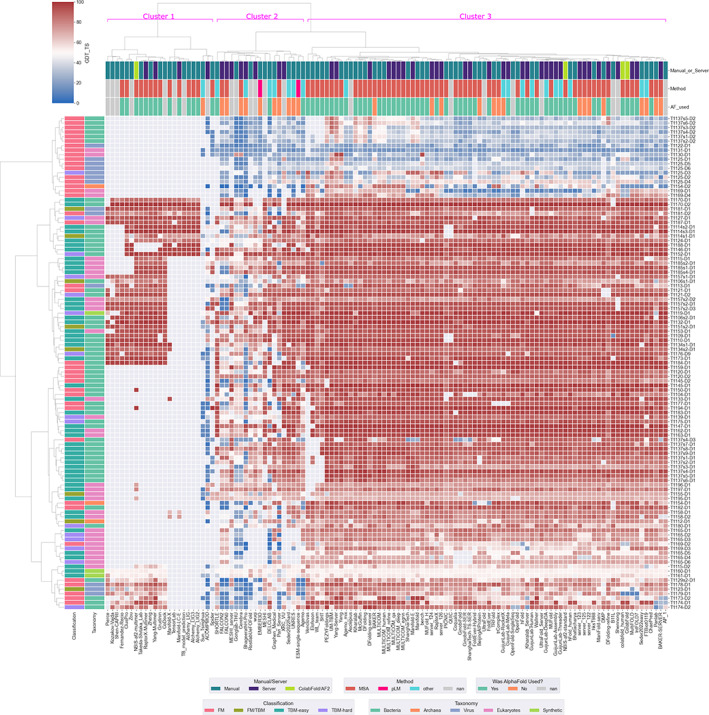
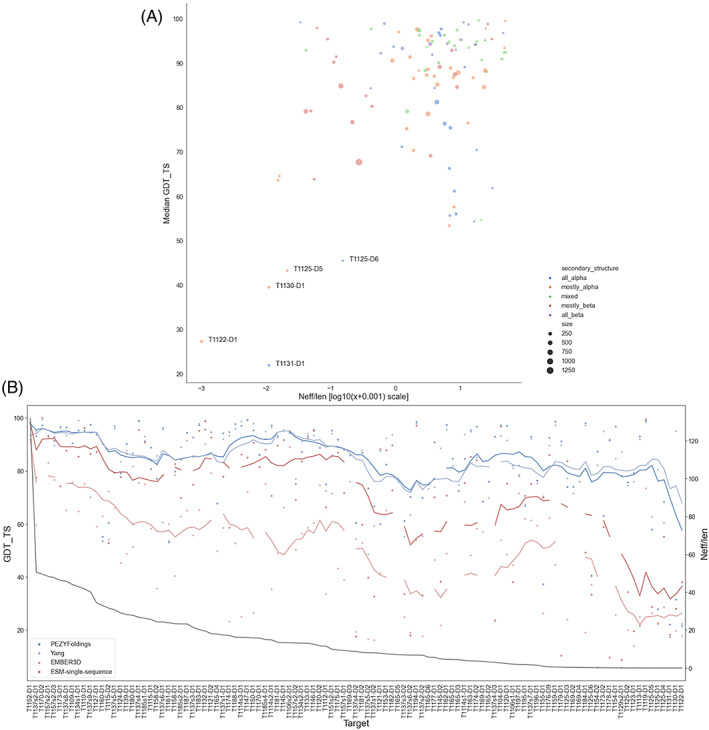
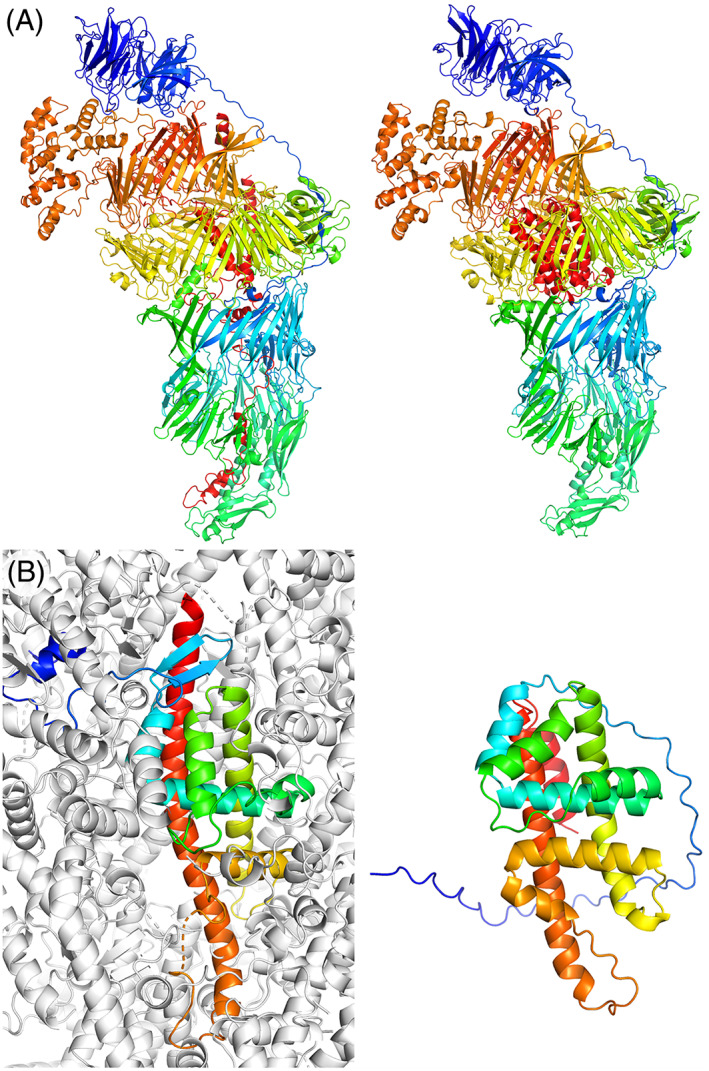
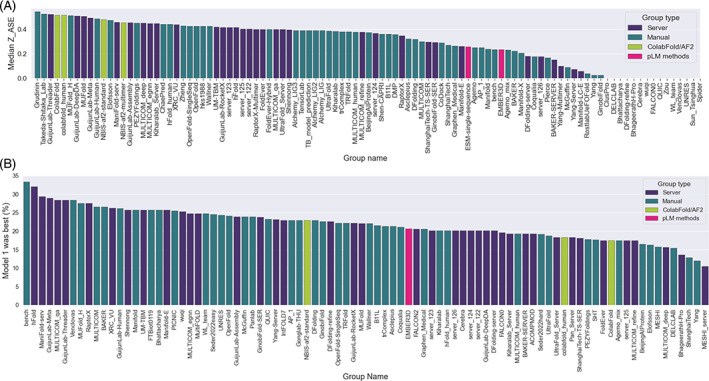
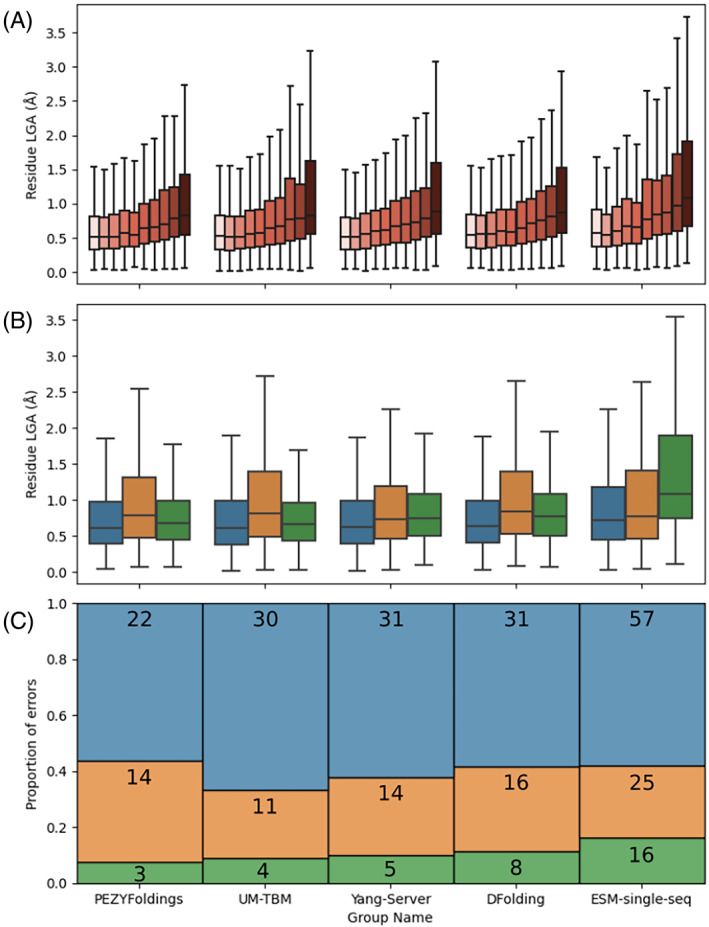
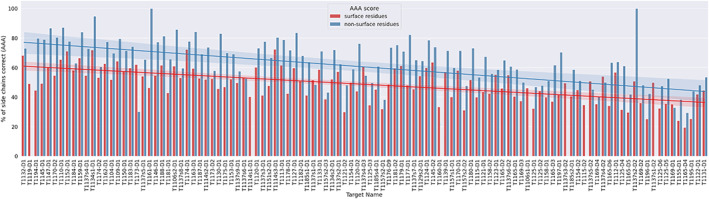
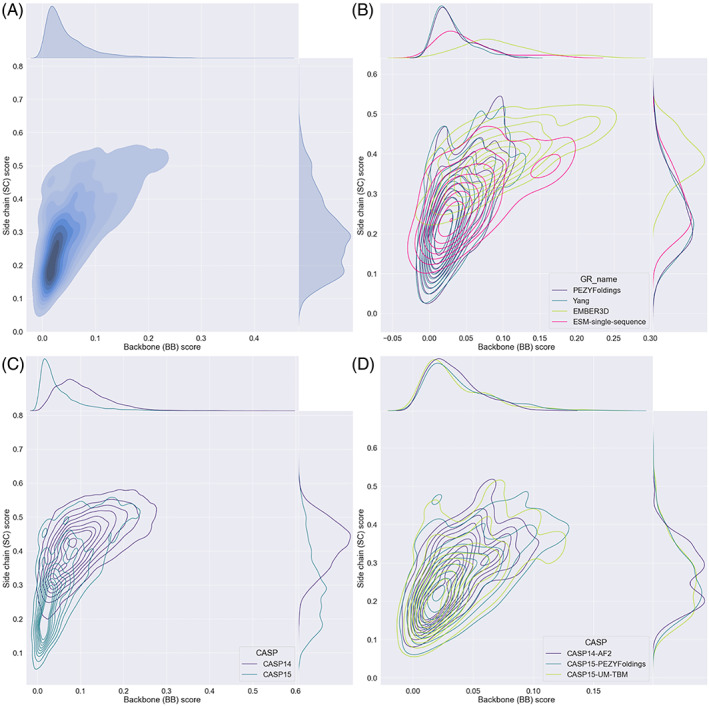
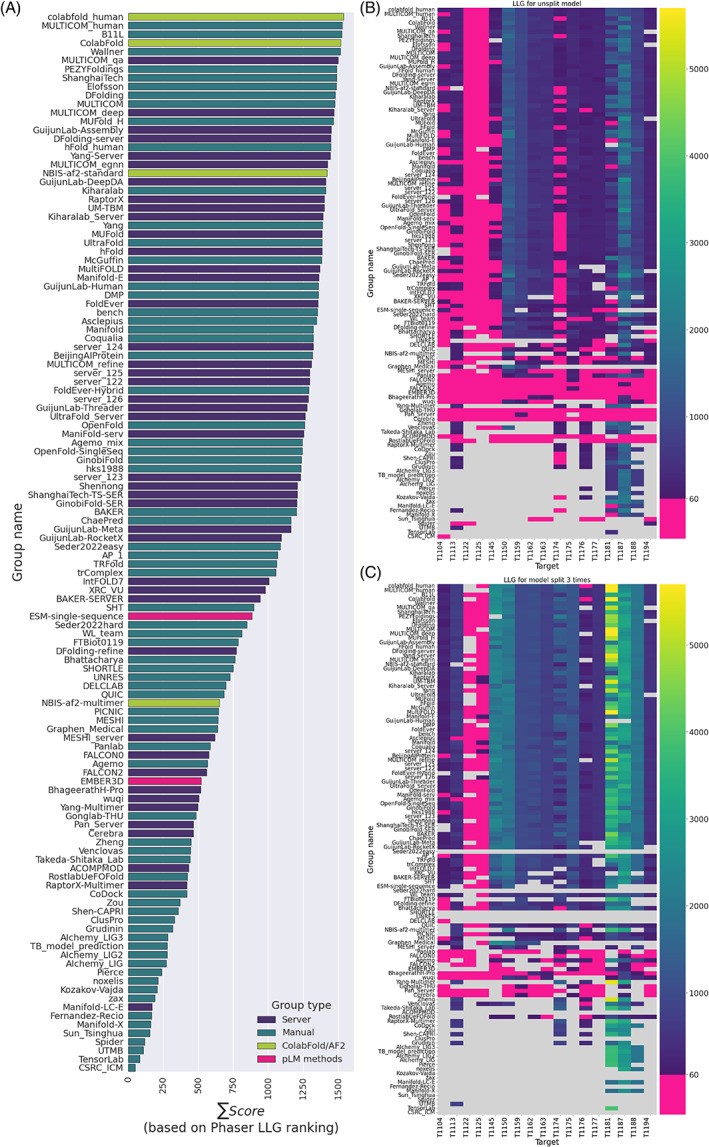
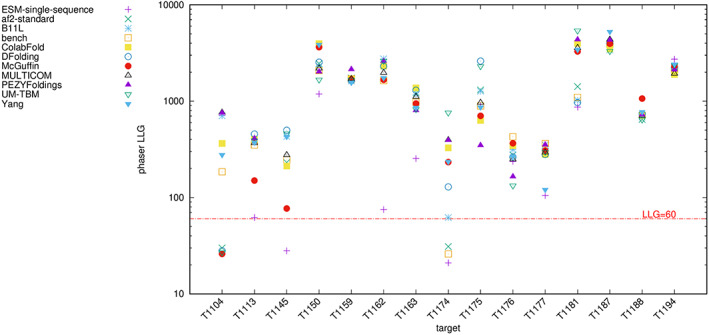
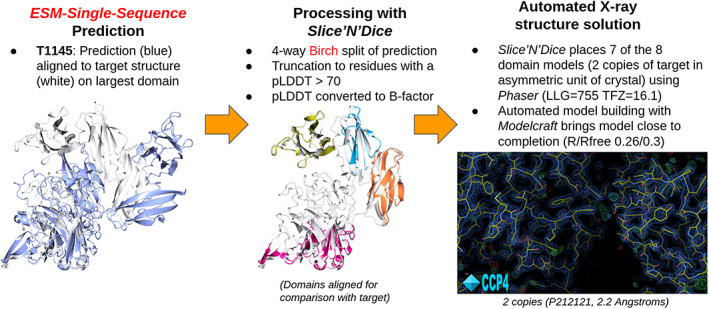
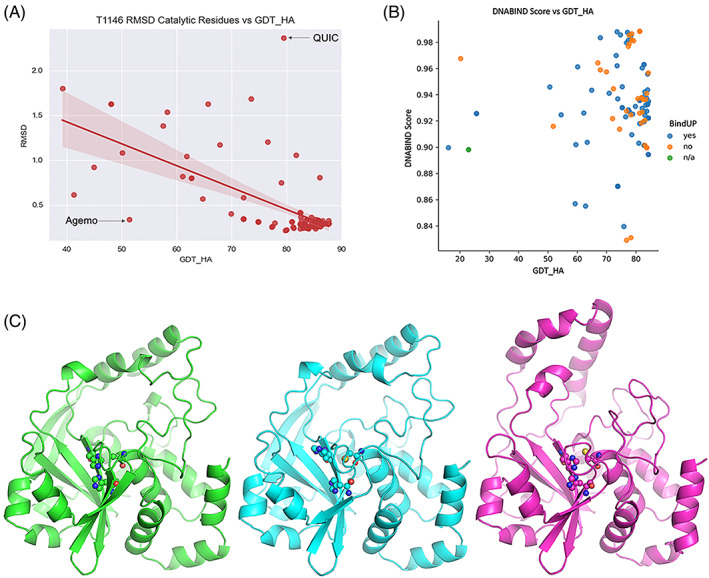
The results of tertiary structure assessment at CASP15 are reported. For the first time, recognizing the outstanding performance of AlphaFold 2 (AF2) at CASP14, all single-chain predictions were assessed together, irrespective of whether a template was available. At CASP15, there was no single stand-out group, with most of the best-scoring groups-led by PEZYFoldings, UM-TBM, and Yang Server-employing AF2 in one way or another. Many top groups paid special attention to generating deep Multiple Sequence Alignments (MSAs) and testing variant MSAs, thereby allowing them to successfully address some of the hardest targets. Such difficult targets, as well as lacking templates, were typically proteins with few homologues. Local divergence between prediction and target correlated with localization at crystal lattice or chain interfaces, and with regions exhibiting high B-factor factors in crystal structure targets, and should not necessarily be considered as representing error in the prediction. However, analysis of exposed and buried side chain accuracy showed room for improvement even in the latter. Nevertheless, a majority of groups produced high-quality predictions for most targets, which are valuable for experimental structure determination, functional analysis, and many other tasks across biology. These include those applying methods similar to those used to generate major resources such as the AlphaFold Protein Structure Database and the ESM Metagenomic atlas: the confidence estimates of the former were also notably accurate.

Keywords: CASP15; machine learning; molecular replacement; protein modelling; protein structure prediction; structural bioinformatics.


Figures

FIGURE 1
FIGURE 1
Cumulative group ranking on 109 CASP15 evaluation units. Groups are color‐coded indigo for server, that is, a purely automated modeling protocol, and teal for manual where human intervention is allowed. Pure AF2 comparison runs based on the original DeepMind protocol or its ColabFold version are shown in green. Pink is used for the two groups employing exclusively protein Language Model methods.
FIGURE 2
FIGURE 2
Ward's clustering applied to GDT_TS values (red good, blue bad, gray no submission) achieved by the 118 evaluated groups on the 109 Evaluation Units (EUs) that were considered. EUs are additionally annotated on the left with color codings relating to classification (TBM_easy, TBM_hard, FM/TBM, or FM) and taxonomy of the original target sequence (Bacteria, Archaea, Virus, Eukaryote, Synthetic). Groups are annotated on the top according to whether they were Server (indigo) or Human (blue), by broad category of method and according to if AF2 was used by a group. Note that the submitted Abstracts from some groups did not always allow confident inference of these aspects (gray labels). Three clusters of groups discussed in the text are indicated in magenta.
FIGURE 3
FIGURE 3
Analysis of performance versus Neff/length and other characteristics (A) Scatter plot of GDT_TS versus the log10 of target Neff/length + 0.001 for the top 10 groups. The scatter points are colored by secondary structure and the size of the points correspond to the size of the target. (B) Plot of GDT_TS versus target for the top performing MSA‐based methods (PEZYFoldings: Dark blue, Yang: Light blue) and the pLM methods (ESM‐single‐sequence: Dark red, EMBER3D: Light red). The lines represent a moving average for each method calculated across a 10 target window. The targets are ordered by Neff/length descending from left to right with Neff/len indicated on the right‐hand y‐axis.
FIGURE 4
FIGURE 4
Examples of the best predictions produced for different targets. In each case, the experimental structure is shown on the left and the prediction on the right, each colored from blue to red from the N‐ to the C‐terminus. (A) T1169, at 2735 residues, is modeled with impressive overall accuracy by the Yang‐server group, with the exception of the C‐terminal 200 residues. (B) the T1122 crystal structure with only 25% solvent content has a tightly packed lattice producing abundant contacts between one subunit and its neighbors (symmetry mates are shown in gray), likely contributing to the poor quality of the best prediction (from the QUIC group).
FIGURE 5
FIGURE 5
Group self‐assessment of results (A) groups ranked by median Z_ASE. (B) Groups ranked by how often Model 1 was the best model (expressed as a percentage). This ranking excludes groups which attempted less than half of the targets.
FIGURE 6
FIGURE 6
Factors affecting local accuracy analyzed using the results of selected MSA‐ and pLM‐based approaches. Only high‐quality (GDT_TS > 80) model_1 submissions are considered. (A) Residue LGA error tends to correlate with normalized B‐factor: for each method, residue LGA error increases from low (light color) to high (dark color) bins of normalized B‐factors. (B) Distribution of LGA error values across residues observed neighboring a crystal lattice interface (orange), a chain interface (green), or neither (blue). (C) Error regions (defined in Materials and Methods) are classified according to their presence at a crystal lattice interface (orange), at a chain interface (green) or neither (blue).
FIGURE 7
FIGURE 7
Per‐target comparison of the mean SCWRL4 AAA sidechain score for surface residues (red) and non‐surface residues (blue) for the model with the highest GDT_HA for each target. Residues were defined as surface residues if their solvent accessibility was ≥20% as given by the Shrake–Rupley algorithm. A line of best fit is shown for both the surface and the non‐surface residues in corresponding colors. The targets are ordered in descending order by the GDT_HA value of the top model.
FIGURE 8
FIGURE 8
Contour plots illustrating the relationship between backbone and side chain dihedral scores (see Materials and Methods), calculated across whole models. Each contour plot is supplemented by a plot on the right illustrating the distribution of side chain scores, and one above showing the main chain score distribution. (A) Shows all groups, all models in CASP15 illustrating how a good (low) backbone (BB) score is necessary but not sufficient for a good (low) side chain (SC) score. (B) Shows a comparison between the models produced by two of the best MSA‐based methods—PEZYFoldings and Yang, and two pLM methods—EMBER3D and ESM‐single‐sequence. (C) Shows a comparison between all groups, all models in CASP14 (indigo) and CASP15 (teal). (D) Shows a comparison between AF2 in CASP14 and the two top performing methods in CASP15 (PEZYFoldings and UM‐TBM).
FIGURE 9
FIGURE 9
(A) Groups ranked by the cumulative LLG‐derived ranking score described in Materials and Methods. (B,C) A comparison between the LLG scores for an ideally placed model (B) before splitting and (C) after splitting three times using the Birch algorithm in Slice'N'Dice. Pink indicates LLG scores below 60, the success threshold in MR. The blue to yellow gradient (see the coloring map next to the graph) depicts the LLG scores greater than 60 with yellow indicating the largest LLG values. Gray denotes instances where groups did not submit models for a target or where Phaser failed to produce a solution. Groups are ordered the same in all three panels.
FIGURE 10
FIGURE 10
LLG values from full MR tests for unsplit model_1 predictions for 11 selected groups, modified to remove residues with pLDDT < 70, and placed by Phaser. T1122 and T11225 are not shown since no search model produced a solution.
FIGURE 11
FIGURE 11
Using Slice'N'Dice to automatically split the ESM‐single‐sequence predicted model_1 for T1145 into four domains (different colors; also retaining only residues with pLDDT > 70) and perform MR using Phaser. Phaser places seven of the eight domain models and further completion is achieved using the Modelcraft model building application.
FIGURE 12
FIGURE 12
Function prediction based on submitted models. (A) Global accuracy and the accuracy of functional features are only weakly correlated, as exemplified here by the RMSD on catalytic residues versus GDT_HA for T1146. (B) DNABIND probability score against Global accuracy. The coloring of the data points indicates BindUP results: blue—positive, orange—negative, green—could not be processed. (C) The T1146 catalytic triad (sticks) and overall fold (cartoon) in the experimental structure (green) and two outliers; cyan—highly accurate fold, wrong conformation of one catalytic His (Model 1 for the QUIC group); magenta—fold prediction less accurate, but catalytic site well‐modeled (Model 1 for the Agemo group).

References

    1. Moult J, Pedersen JT, Judson R, Fidelis K. A large‐scale experiment to assess protein structure prediction methods. Proteins. 1995;23(3):ii‐v. - PubMed
    1. Kryshtafovych A, Schwede T, Topf M, Fidelis K, Moult J. Critical assessment of methods of protein structure prediction (CASP): round XIV. Proteins. 2021;89(12):1607‐1617. - PMC - PubMed
    1. Burley SK, Bhikadiya C, Bi C, et al. RCSB protein data Bank: powerful new tools for exploring 3D structures of biological macromolecules for basic and applied research and education in fundamental biology, biomedicine, biotechnology, bioengineering and energy sciences. Nucleic Acids Res. 2021;49(D1):D437‐D451. - PMC - PubMed
    1. Defay T, Cohen FE. Evaluation of current techniques for ab initio protein structure prediction. Proteins. 1995;23(3):431‐445. - PubMed
    1. Leman JK, Weitzner BD, Lewis SM, et al. Macromolecular modeling and design in Rosetta: recent methods and frameworks. Nat Methods. 2020;17(7):665‐680. - PMC - PubMed

Publication types