. 2024 Feb;44(2):272-283.
doi: 10.1177/0271678X231203475. Epub 2023 Sep 25.

The effect of hypercapnia on the directional sensitivity of dynamic cerebral autoregulation and the influence of age and sex

Affiliations

The effect of hypercapnia on the directional sensitivity of dynamic cerebral autoregulation and the influence of age and sex

Ronney B Panerai et al. J Cereb Blood Flow Metab. 2024 Feb.

Abstract

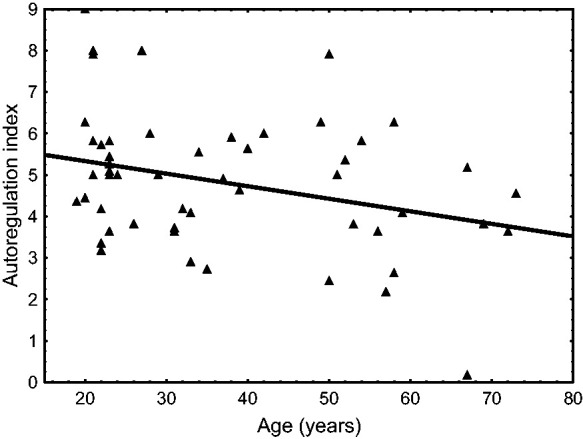
The cerebral circulation responds differently to increases in mean arterial pressure (MAP), compared to reductions in MAP. We tested the hypothesis that this directional sensitivity is reduced by hypercapnia. Retrospective analysis of 104 healthy subjects (46 male (44%), age range 19-74 years), with five minute recordings of middle cerebral blood velocity (MCAv, transcranial Doppler), non-invasive MAP (Finometer) and end-tidal CO2 (capnography) at rest, during both poikilocapnia and hypercapnia (5% CO2 breathing in air) produced MCAv step responses allowing estimation of the classical Autoregulation Index (ARIORIG), and corresponding values for both positive (ARI+D) and negative (ARI-D) changes in MAP. Hypercapnia led to marked reductions in ARIORIG, ARI+D and ARI-D (p < 0.0001, all cases). Females had a lower value of ARIORIG compared to males (p = 0.030) at poikilocapnia (4.44 ± 1.74 vs 4.74 ± 1.48) and hypercapnia (2.44 ± 1.93 vs 3.33 ± 1.61). The strength of directional sensitivity (ARI+D-ARI-D) was not influenced by hypercapnia (p = 0.46), sex (p = 0.76) or age (p = 0.61). During poikilocapnia, ARI+D decreased with age in females (p = 0.027), but not in males. Directional sensitivity was not affected by hypercapnia, suggesting that its origins are more likely to be inherent to the mechanics of vascular smooth muscle than to myogenic pathways.

Keywords: Cerebral blood flow; age; cerebral autoregulation; hypercapnia; sex.


Conflict of interest statement

Declaration of conflicting interestsThe author(s) declared no potential conflicts of interest with respect to the research, authorship, and/or publication of this article.

Figures

Figure 1.
Figure 1.
Representative recordings and MCAv step responses from a 52 year old female subject during poikilocapnia (left column plots) and hypercapnia (right column plots). (a,b) middle cerebral artery velocity (MCAv, continuous line) and model predicted output (symbols); (c,d) mean arterial blood pressure (MAP); (e,f) integrated positive derivative of MAP; (g,h) integrated negative derivative of MAP; (i,j) End-tidal CO2; (k,l) normalised MCAv step responses for MAP+D (continuous line) and MAP-D (dashed line). The poikilocapnia and hypercapnia, model fittings had Rmod of 0.363 and 0.934, respectively. Corresponding values of ARI+D/ARI-D were 4.46/3.27 and 0.00/0.64, whilst the NMSE were 0.034/0.024 and 0.093/0.159, respectively.
Figure 2.
Figure 2.
Population average MCAv step responses during poikilocapnia (a,c,e) and hypercapnia (b,d,f) for male (continuous line) and female (dashed line) subjects. (a,b) classical step responses for the mean arterial blood pressure (MAP) input; (c,d) step responses for the integrated positive derivative of MAP; (e,f) step responses for the integrated negative derivative of MAP. The error bars correspond to the largest ± 1 SE at the point of occurrence. Note the different amplitude scale for (f).
Figure 3.
Figure 3.
Difference of autoregulation index between the integrated positive (Deriv+) and negative (Deriv−) mean arterial blood pressure (MAP) inputs for the ARMA model of the middle cerebral artery velocity response during spontaneous fluctuations in BP for male (n = 46, continuous line) and female (n = 58, dashed line) subjects. The error bars correspond to the 95% confidence limits.
Figure 4.
Figure 4.
Autoregulation index as a function of age during poikilocapnia in female subjects (n = 53). The symbols and continuous regression line (p = 0.027) correspond to estimates from the integrated positive derivative input to the ARMA model of cerebral blood velocity in the middle cerebral artery. The dashed regression line (p = 0.060) correspond to estimates from the integrated negative derivative input. Corresponding linear regressions for male subjects had p-values of 0.21 and 0.93, respectively.

References

    1. Claassen JAHR, Thijssen DHJ, Panerai RBet al.. Regulation of cerebral blood flow in humans: physiology and clinical implications of autoregulation. Physiol Rev 2021; 101: 1487–1559. - PMC - PubMed
    1. Brassard P, Ferland-Dutil H, Smirl JDet al.. Evidence for hysteresis in the cerebral pressure-flow relationship in healthy men. Am J Physiol Heart Circ Physiol 2017; 312: H701–H704. - PubMed
    1. Labrecque L, Smirl JD, Tzeng YCet al.. Point/counterpoint: we should take the direction of blood pressure change into consideration for dynamic cerebral autoregulation quantification. J Cereb Blood Flow Metab 2022; 42: 2351–2353. - PMC - PubMed
    1. Numan T, Bain AR, Hoiland RLet al.. Static autoregulation in humans: a review and reanalysis. Med Eng Phys 2014; 36: 1487–1495. - PubMed
    1. Tzeng YC, Willie CK, Atkinson Get al.. Cerebrovascular regulation during transient hypotension and hypertension in humans. Hypertension 2010; 56: 268–273. - PubMed

Publication types

LinkOut - more resources