. 2023 Sep 25;80(10):302.
doi: 10.1007/s00018-023-04962-x.

Metabolic and cell cycle shift induced by the deletion of Dnm1l attenuates the dissolution of pluripotency in mouse embryonic stem cells

Affiliations

Metabolic and cell cycle shift induced by the deletion of Dnm1l attenuates the dissolution of pluripotency in mouse embryonic stem cells

Bong Jong Seo et al. Cell Mol Life Sci. .

Abstract

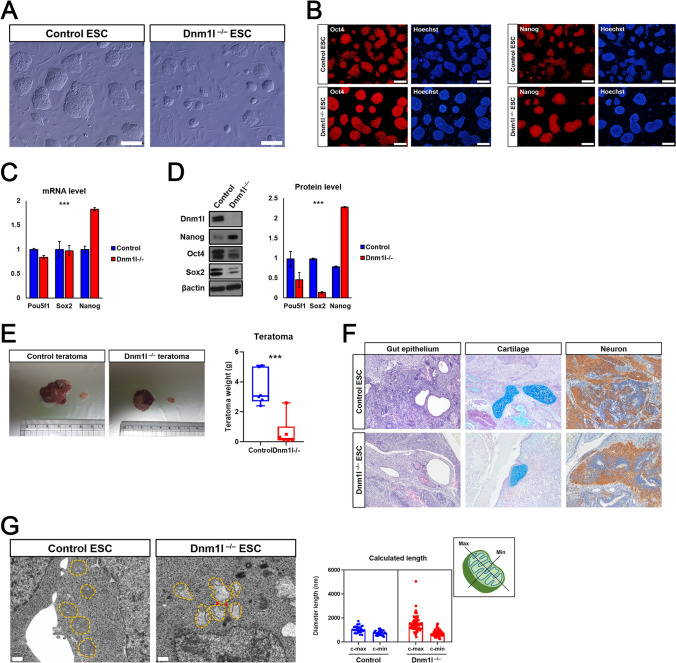
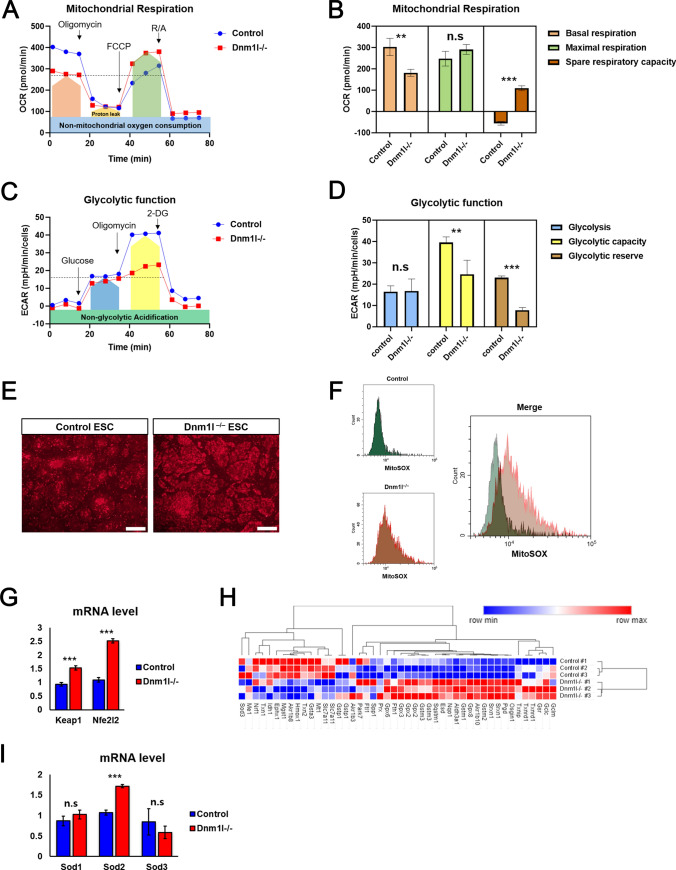
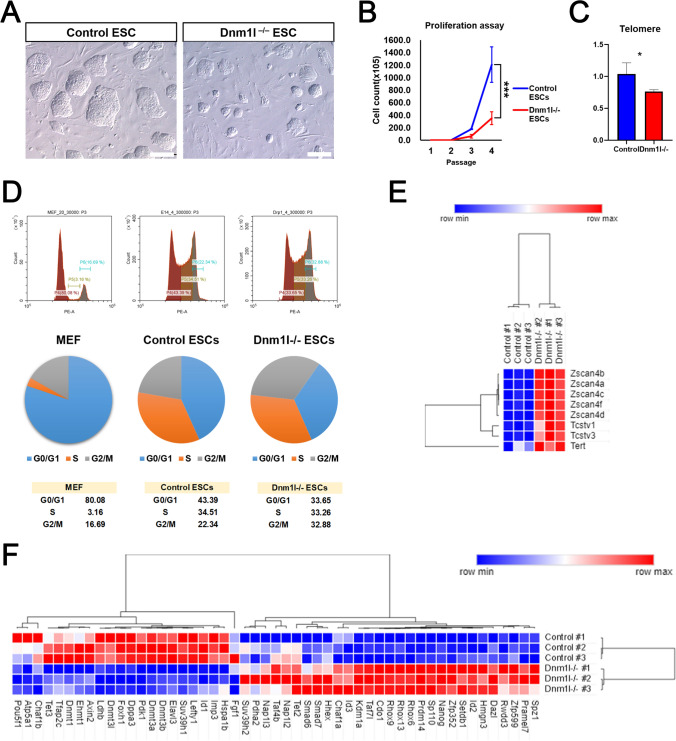
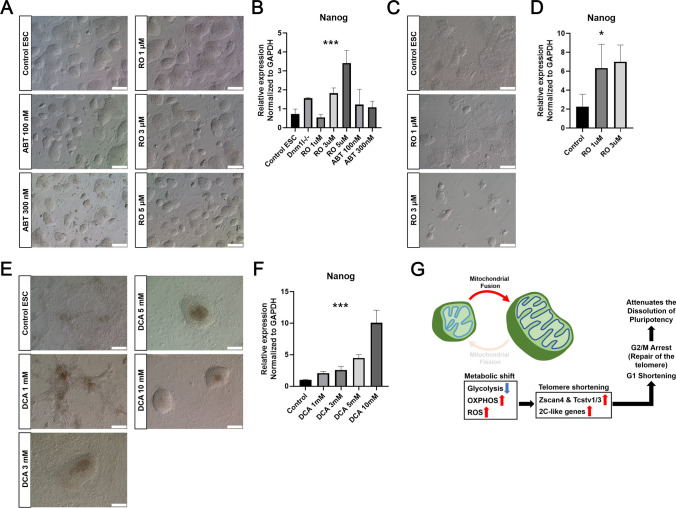
Mitochondria are versatile organelles that continuously change their morphology via fission and fusion. However, the detailed functions of mitochondrial dynamics-related genes in pluripotent stem cells remain largely unclear. Here, we aimed to determine the effects on energy metabolism and differentiation ability of mouse embryonic stem cells (ESCs) following deletion of the mitochondrial fission-related gene Dnml1. Resultant Dnm1l-/- ESCs maintained major pluripotency characteristics. However, Dnm1l-/- ESCs showed several phenotypic changes, including the inhibition of differentiation ability (dissolution of pluripotency). Notably, Dnm1l-/- ESCs maintained the expression of the pluripotency marker Oct4 and undifferentiated colony types upon differentiation induction. RNA sequencing analysis revealed that the most frequently differentially expressed genes were enriched in the glutathione metabolic pathway. Our data suggested that differentiation inhibition of Dnm1l-/- ESCs was primarily due to metabolic shift from glycolysis to OXPHOS, G2/M phase retardation, and high level of Nanog and 2-cell-specific gene expression.

Keywords: Cellular metabolism; Dynamin 1 like (Dnm1l); Embryonic stem cells (ESCs); Mitochondrial fission; Pluripotency.


Conflict of interest statement

The authors declare that they have no conflicts of interest.

Figures

Fig. 1
Fig. 1
Generation and characterization of Dnm1l−/− embryonic stem cells (ESCs). A Bright field images of control and Dnm1l−/− ESCs. B Immunocytochemical analysis of the pluripotency markers, NANOG (top) and OCT4 (bottom) in control and Dnm1l−/− embryonic stem cells (ESCs). Scale bars: 200 µm. C Real time-polymerase chain reaction (PCR) analysis of core pluripotent genes, including Pou5f1 (Oct4), Sox2, and Nanog, in control and Dnm1l−/− ESCs. Data are presented as the mean ± SEM of the values from three independent experiments. D Western blot analysis of core pluripotent and Dnm1l proteins in control and Dnm1l−/− ESCs. Data are presented as the mean ± SEM of values from three independent experiments. E, F Teratoma formation and analysis of in vivo differentiation potential. E Teratoma formation in control and Dnm1l−/− ESCs. Control ESC-derived teratomas were larger than Dnm1l−/− ESC-derived teratomas. An unpaired t test: ***p < 0.001. F Control and Dnm1l−/− ESC-derived teratomas were histologically stained with hematoxylin/eosin (Gut epithelium, Endoderm, arrowed), alcian blue (Cartilage, Mesoderm, arrowed), anti-tuj1 antibody (Neuron, Ectoderm), which represents the in vivo differentiation potential of three germ layers. G Enlarged TEM images of control and Dnm1l−/− ESC lines focused on the mitochondria (yellow dot lines). Most mitochondria in Dnml1−/− ESCs were elongated owing to fission failure (red arrows). Scale bars: 0.5 µm. Calculated length of mitochondrial max/min values, using the ImageJ software, in control and Dnm1l−/− ESC lines. Criteria used for analyzing mitochondrial maximal (Max) or minimal (Min) length of all ESC lines
Fig. 2
Fig. 2
Metabolic analysis of control and Dnm1l−/− embryonic stem cells (ESCs). A Measurement of oxygen consumption rate (OCR) in control and Dnm1l−/− ESCs. B Measurement of basal respiration, maximal respiration, spare respiratory capacity in control and Dnm1l−/− ESCs. Oligomycin; an ATP synthase inhibitor, p-trifluoromethoxyphenylhydrazone (FCCP); an uncoupling agent that collapses the proton gradient, R/A (rotenone/antimycin); a complex I inhibitor/a complex III inhibitor. C Measurement of extracellular acidification rate (ECAR) in control and Dnm1l−/− ESCs. D Measurement of glycolysis, glycolytic capacity, glycolytic reserve in control and Dnm1l−/− ESCs. 2-DG (2-deoxy-glucose); a glucose analog, inhibiting glycolysis through competitive binding to glucose hexokinase. E Representative image of control and Dnm1l−/− ESC lines observed using mitoSOX. F Flow cytometry analysis of the proportion of control and Dnm1l−/− ESCs stained with mitoSOX. G Real time-polymerase chain reaction (PCR) analysis of ROS-related genes, including Keap1 and Nfe2l2 (Nrf2), in control and Dnm1l−/− ESCs. An unpaired t test: ***p < 0.001. Data are presented as the mean ± SEM of values from three independent experiments. H Heatmap of Nrf2 target gene expression patterns in control and Dnm1l−/− ESCs. I Real time-PCR analysis of superoxide dismutase 1, 2 (mitochondria-specific), and 3 in control and Dnm1l−/− ESCs. An unpaired t test: ***p < 0.001, n.s not significant. Data are presented as the mean ± SEM of values from three independent experiments
Fig. 3
Fig. 3
Cell cycle analysis of control and Dnm1l−/− embryonic stem cells (ESCs). A Representative image of control and Dnm1l−/− ESC lines observed after 3 days of cell expansion. Scale bars: 200 µm. B Proliferation assay of control and Dnm1l−/− ESCs. An unpaired t test: ***p < 0.001. Data are presented as the mean ± SEM of values from three independent experiments. C Relative quantification of telomere length was performed on control and Dnm1l−/− ESC samples in triplicate using real time-polymerase chain reaction (PCR) via amplification of telomeres relative to the amount of nDNA. An unpaired t test: *p < 0.05. Data are presented as the mean ± SEM of values from three independent experiments. D Flow cytometry analysis of the proportion of control and Dnm1l−/− ESCs, and fibroblasts (control) stained with propidium iodide (PI; top), and their pie charts (middle). Ratio information of each pie chart (bottom). E Heatmap of expression patterns of genes related to telomere elongation in control and Dnm1l−/− ESCs. F Heatmap of 2-cell-like cell genes expression patterns in control and Dnm1l−/− ESCs
Fig. 4
Fig. 4
Dnm1l deficiency in mouse embryonic stem cells (ESCs) decreases the population of differentiated cells under stimulation of exit from pluripotency. A Immunocytochemical analysis of the Oct4 protein in control and Dnm1l−/− ESCs after 14 days of spontaneous differentiation. Scale bars: 200 µm. B Real time-polymerase chain reaction (PCR) analysis of Nanog in control and Dnm1l−/− ESCs at day 14 of spontaneous differentiation. An unpaired t test: **p < 0.01. Data are presented as the mean ± SEM of values from three independent experiments. C Representative image of control and Dnm1l−/− ESC lines observed after 14 days of spontaneous differentiation (left) and alkaline phosphatase staining (right). Scale bars: 500 µm. D The amount of alpha-ketoglutarate in control and Dnm1l−/− ESCs. An unpaired t test: **p < 0.01. Data are presented as the mean ± SEM of values from three independent experiments. E Representative image of control and Dnm1l−/− ESC lines observed after 3 days of cell expansion on a gelatin-coated dish in 2iL and L conditions. Scale bars: 100 µm. F Real time-PCR analysis of Nanog in control and Dnm1l−/− ESCs at day 3 of 2iL and L condition culture. An unpaired t test: ***p < 0.001, n.s not significant. Data are presented as the mean ± SEM of values from three independent experiments
Fig. 5
Fig. 5
Chemical-induced G2/M retardation attenuates the dissolution of pluripotency in mouse embryonic stem cells (ESCs). A Representative image of control ESCs observed after 3 days of cell expansion in mESC medium with RO-3306 (1, 3, and 5 µM) or ABT-751 (100 and 300 mM). Scale bars: 200 µm. B Real time-polymerase chain reaction (PCR) analysis for Nanog expression in control ESCs, Dnm1l−/− ESCs, and control ESCs treated with RO-3306 or ABT-751 for 3 days. One-way analysis of variance (ANOVA) t test: ***p < 0.001. Data are presented as the mean ± SEM of values from three independent experiments. C Representative image of control ESCs observed after 7 days of spontaneous differentiation in differentiation condition w/ or w/o RO-3306. Scale bars: 200 µm. D Real time-PCR analysis of Nanog in control and ESCs at day 7 of spontaneous differentiation in differentiation condition w/ or w/o RO-3306. One-way ANOVA t test: *p < 0.05. Data are presented as the mean ± SEM of values from three independent experiments. E Representative image of control ESCs observed after 7 days of spontaneous differentiation in differentiation condition w/ or w/o (dichloroacetate) DCA. Scale bars: 100 µm. F Real time-PCR analysis of Nanog in control and ESCs at day 7 of spontaneous differentiation in differentiation conditions w/ or w/o DCA. One-way ANOVA t test: ***p < 0.001. Data are presented as the mean ± SEM of values from three independent experiments. G Schematic illustration of the proposed model of Dnm1l deficiency-induced attenuation of the dissolution of pluripotency. Dnm1l deficiency in embryonic stem cells (ESCs) led to G2/M phase retardation, high levels of Nanog and 2-cell-specific gene expression, and metabolic shift from glycolysis to OXPHOS, which were the main causes of attenuation of the dissolution of pluripotency
Fig. 6
Fig. 6
RNA sequencing analysis of control and Dnm1l−/− embryonic stem cells (ESCs). A Principal component analysis of control and Dnm1l−/− ESCs. B Volcano plot analysis of control and Dnm1l−/− ESCs. C Clustergrammer analysis of control and Dnm1l−/− ESCs. D Gene ontology and pathway analyses of differentially expressed genes (DEGs) upregulated between control and Dnm1l−/− ESCs (red; glutathione related term)

References

    1. Baek SH, Park SJ, Jeong JI, et al. Inhibition of Drp1 ameliorates synaptic depression, Aβ deposition, and cognitive impairment in an Alzheimer's disease model. J Neurosci. 2017;37:5099–5110. doi: 10.1523/JNEUROSCI.2385-16.2017. - DOI - PMC - PubMed
    1. Boroviak T, Loos R, Bertone P, et al. The ability of inner-cell-mass cells to self-renew as embryonic stem cells is acquired following epiblast specification. Nat Cell Biol. 2014;16:513–525. doi: 10.1038/ncb2965. - DOI - PMC - PubMed
    1. Brand MD. The sites and topology of mitochondrial superoxide production. Exp Gerontol. 2010;45:466–472. doi: 10.1016/j.exger.2010.01.003. - DOI - PMC - PubMed
    1. Chan DC. Fusion and fission: interlinked processes critical for mitochondrial health. Annu Rev Genet. 2012;46:265–287. doi: 10.1146/annurev-genet-110410-132529. - DOI - PubMed
    1. Chang DT, Honick AS, Reynolds IJ. Mitochondrial trafficking to synapses in cultured primary cortical neurons. J Neurosci. 2006;26:7035–7045. doi: 10.1523/JNEUROSCI.1012-06.2006. - DOI - PMC - PubMed