. 2023 Sep 25;21(9):e3002150.
doi: 10.1371/journal.pbio.3002150. eCollection 2023 Sep.

ADAR-mediated regulation of PQM-1 expression in neurons impacts gene expression throughout C. elegans and regulates survival from hypoxia

Affiliations

ADAR-mediated regulation of PQM-1 expression in neurons impacts gene expression throughout C. elegans and regulates survival from hypoxia

Ananya Mahapatra et al. PLoS Biol. .

Abstract

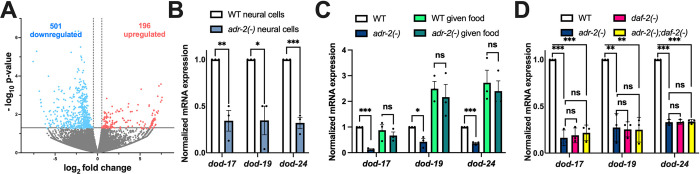
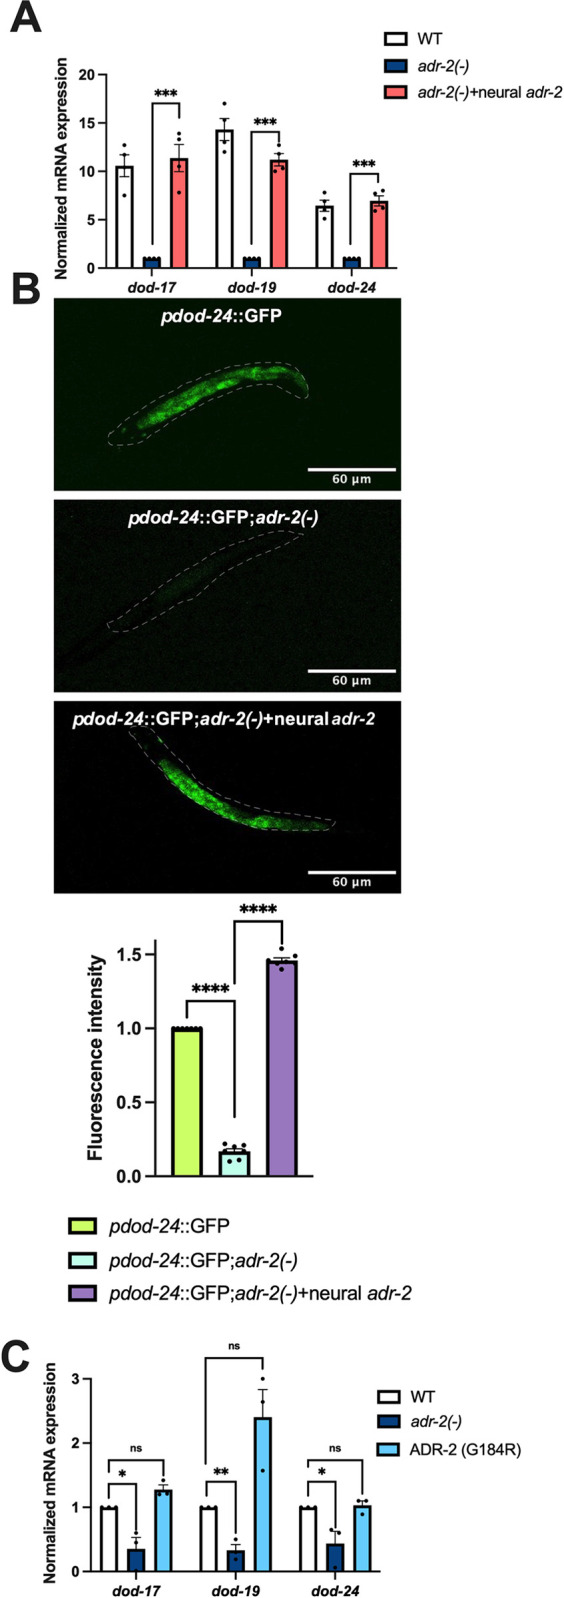
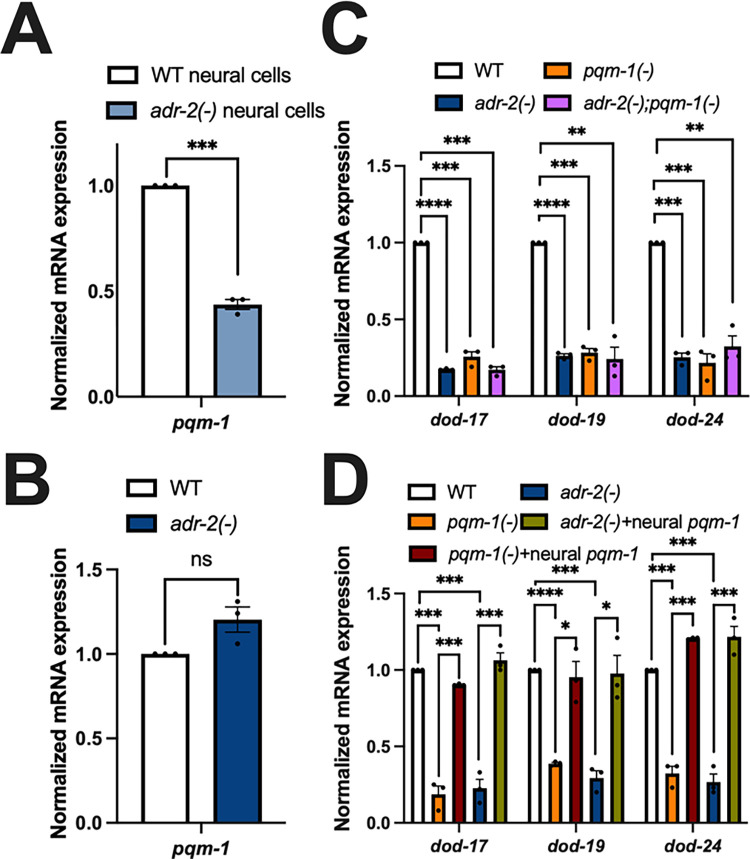
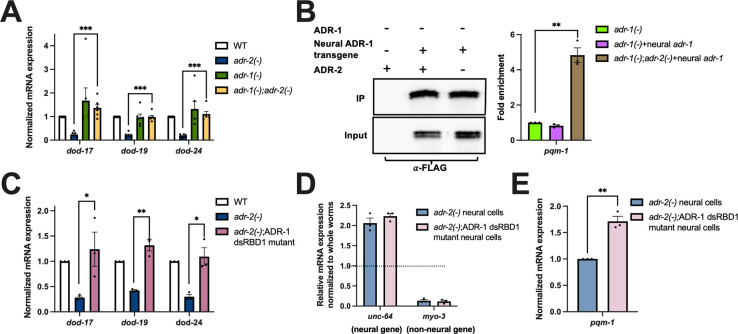
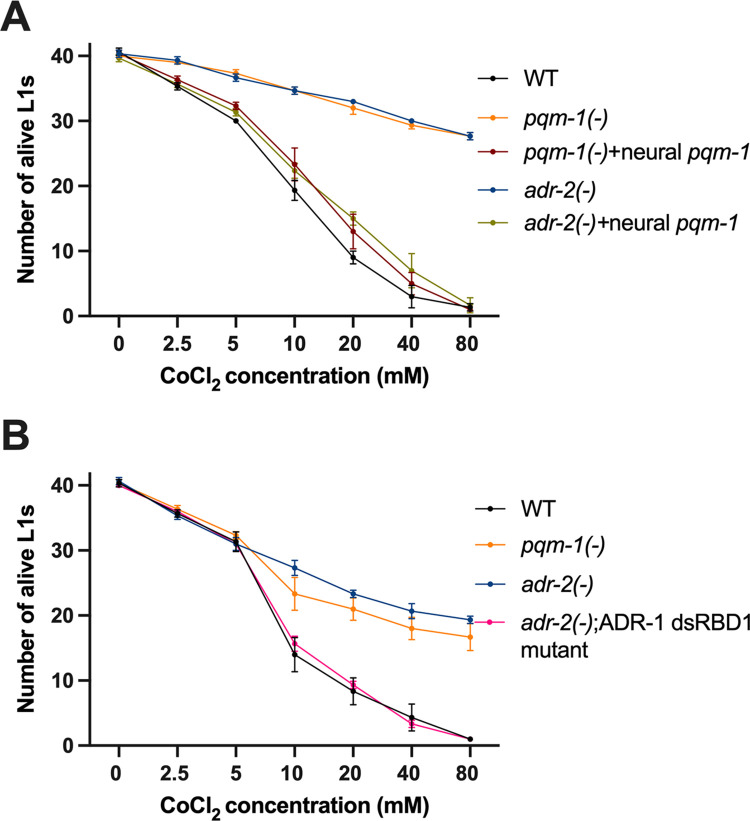
The ability to alter gene expression programs in response to changes in environmental conditions is central to the ability of an organism to thrive. For most organisms, the nervous system serves as the master regulator in communicating information about the animal's surroundings to other tissues. The information relay centers on signaling pathways that cue transcription factors in a given cell type to execute a specific gene expression program, but also provide a means to signal between tissues. The transcription factor PQM-1 is an important mediator of the insulin signaling pathway contributing to longevity and the stress response as well as impacting survival from hypoxia. Herein, we reveal a novel mechanism for regulating PQM-1 expression specifically in neural cells of larval animals. Our studies reveal that the RNA-binding protein (RBP), ADR-1, binds to pqm-1 mRNA in neural cells. This binding is regulated by the presence of a second RBP, ADR-2, which when absent leads to reduced expression of both pqm-1 and downstream PQM-1 activated genes. Interestingly, we find that neural pqm-1 expression is sufficient to impact gene expression throughout the animal and affect survival from hypoxia, phenotypes that we also observe in adr mutant animals. Together, these studies reveal an important posttranscriptional gene regulatory mechanism in Caenorhabditis elegans that allows the nervous system to sense and respond to environmental conditions to promote organismal survival from hypoxia.


Conflict of interest statement

The authors have declared that no competing interests exist.

Figures

Fig 1
Fig 1. L1 animals lacking adr-2 have decreased expression of genes regulated by insulin signaling.
(A) Volcano plot depicting gene expression in adr-2(-) neural cells compared to WT neural cells. Dots represent individual genes that are up-regulated (red; 186, p < 0.05, log2fold > 0.5), down-regulated (blue; 502, p < 0.05, log2fold < -0.5), or not significantly different (gray, p ≥ 0.05) between 3 biological replicates of WT and adr-2(-) neural cells. (B–D) Expression of the indicated genes was determined relative to expression of the housekeeping gene gpd-3. Values were then normalized to WT neural cells (B) or WT L1 animals hatched in the absence of food (C, D) and the mean of 3 biological replicates was plotted. Error bars represent SEM. Statistical significance was calculated using multiple unpaired t tests followed by Holm–Šídák multiple comparisons correction. *p < 0.05, **p < 0.005, ***p < 0.0005, ns indicates not significant (p > 0.05). For D, the indicated genotypes are of strains HAH30, HAH31, HAH32, and HAH33. All individual data and statistics are included in S1 Data under Supporting information. SEM, standard error of the mean; WT, wild type.
Fig 2
Fig 2. Neural ADR-2 regulates insulin signaling cell non-autonomously in an editing-independent manner.
(A, C) Gene expression of L1-arrested animals measured by qPCR. Expression of the indicated genes was determined relative to expression of the housekeeping gene gpd-3. Values were then normalized to WT and the mean of 3 (C) or 4 (A) biological replicates was plotted. Error bars represent SEM. Statistical significance was calculated using multiple unpaired t tests followed by Holm–Šídák multiple comparisons correction. ***p < 0.0005, ns indicates not significant (p > 0.05). For A, the indicated genotypes are of strains HAH23, HAH40, and HAH41. For C, the indicated genotypes are of strains N2, BB20, and HAH22. (B) A representative image of 1 L1 animal of the indicated genotypes. The dashed line represents the outline of the whole worm. For all the strains, the images are representative of 7 samples imaged in 2 biological replicates. The bar graphs below the images represent the summary of fluorescence intensity quantification using FIJI software for all the animals imaged. Data from 7 animals are plotted where each dot represents 1 animal. The values were normalized to pdod-24::GFP. Statistical significance was determined using an ordinary one-way ANOVA test. ****p < 0.0001. All individual data and statistics are included in S2 Data. SEM, standard error of the mean; WT, wild type.
Fig 3
Fig 3. Neural PQM-1 activity is sufficient to rescue expression of PQM-1 activated genes in adr-2(-) animals.
(A–D) Gene expression of (A) neural cells and (B–D) L1-arrested animals measured by qPCR. Expression of indicated genes was determined relative to expression of the housekeeping gene gpd-3. Values were then normalized to WT and the mean of 3 biological replicates was plotted. Error bars represent SEM. Statistical significance was calculated using multiple unpaired t tests followed by Holm–Šídák multiple comparisons correction. **p < 0.005, ***p < 0.0005, ****p < 0.000001, ns indicates not significant (p > 0.05). For A and B, the indicated genotypes are of strains HAH45 and HAH46. For C, the indicated genotypes are of strains HAH35, HAH37, HAH38, and HAH39. For D, the indicated genotypes are of strains HAH24, HAH41, HAH42, HAH43, and HAH44. All individual data and statistics are included in S3 Data under Supporting information. SEM, standard error of the mean; WT, wild type.
Fig 4
Fig 4. Neural ADR-1 binding of pqm-1 affects expression of PQM-1 activated genes.
(A, C, E) Gene expression of (A, C) L1-arrested animals and (E) neural cells measured by qPCR. Expression of the indicated genes was determined relative to expression of the housekeeping gene gpd-3. Values were then normalized to WT L1 animals (A, C) or adr-2(-) neural cells (E) and the mean of (A) six (C, E) 3 biological replicates was plotted. Error bars represent SEM. Statistical significance was calculated using multiple unpaired t tests followed by Holm–Šídák multiple comparisons correction. *p < 0.05, **p < 0.005, ***p < 0.0005. For A, the indicated genotypes are of strains N2, BB19, BB20, and BB21. For C, the indicated genotypes are of strains HAH48, HAH49, and HAH50. (B) Western blot depicting immunoprecipitation of neural ADR-1 from the indicated strains. Bar graph represents the fold enrichment of pqm-1 cDNA in the IP samples relative to the amount of pqm-1 cDNA in the input lysate for each strain. The IP/input values are obtained for each strain and then normalized to the IP/input value for the negative control (adr-1(-)). The mean of 3 biological replicates was plotted. Error bars represent SEM. Statistical significance was calculated by multiple unpaired t tests followed by Holm–Šídák multiple comparisons correction. **p < 0.005. (D) Gene expression of neural unc-64 and nonneural myo-3 measured by qPCR. Expression was determined relative to gpd-3 and values were normalized to nonneural cells. All individual data and statistics are included in S4 Data under Supporting information. cDNA, complementary DNA; SEM, standard error of the mean; WT, wild type.
Fig 5
Fig 5. Survival of hatched L1 animals after CoCl2 exposure.
(A, B) Survival of transgenic (A) and non-transgenic (B) hatched L1 animals under hypoxic conditions induced by CoCl2 exposure. Data plotted is average of 3 biological replicates. Error bars represent SEM. All individual data and statistics are included in S5 Data under Supporting information. SEM, standard error of the mean; WT, wild type.

Update of

Similar articles

Cited by

References

    1. Rashid S, Wong C, Roy R. Developmental plasticity and the response to nutrient stress in Caenorhabditis elegans. Dev Biol. 2021;475:265–76. Epub 2021/02/08. doi: 10.1016/j.ydbio.2021.01.015 . - DOI - PubMed
    1. Padilla PA, Nystul TG, Zager RA, Johnson AC, Roth MB. Dephosphorylation of cell cycle-regulated proteins correlates with anoxia-induced suspended animation in Caenorhabditis elegans. Mol Biol Cell. 2002;13(5):1473–1483. doi: 10.1091/mbc.01-12-0594 ; PubMed Central PMCID: PMC111120. - DOI - PMC - PubMed
    1. Baugh LR. To grow or not to grow: nutritional control of development during Caenorhabditis elegans L1 arrest. Genetics. 2013;194(3):539–55. Epub 2013/07/05. doi: 10.1534/genetics.113.150847 ; PubMed Central PMCID: PMC3697962. - DOI - PMC - PubMed
    1. Mata-Cabana A, Perez-Nieto C, Olmedo M. Nutritional control of postembryonic development progression and arrest in Caenorhabditis elegans. Adv Genet. 2021;107:33–87. Epub 2021/03/02. doi: 10.1016/bs.adgen.2020.11.002 . - DOI - PubMed
    1. Allen E, Ren J, Zhang Y, Alcedo J. Sensory systems: their impact on C. elegans survival. Neuroscience. 2015;296:15–25. Epub 2014/07/06. doi: 10.1016/j.neuroscience.2014.06.054 ; PubMed Central PMCID: PMC4282626. - DOI - PMC - PubMed

Substances