Meta-Analysis
. 2023 Sep 25;18(9):e0291972.
doi: 10.1371/journal.pone.0291972. eCollection 2023.

CD44-SNA1 integrated cytopathology for delineation of high grade dysplastic and neoplastic oral lesions

Affiliations
Meta-Analysis

CD44-SNA1 integrated cytopathology for delineation of high grade dysplastic and neoplastic oral lesions

Sumsum P Sunny et al. PLoS One. .

Abstract

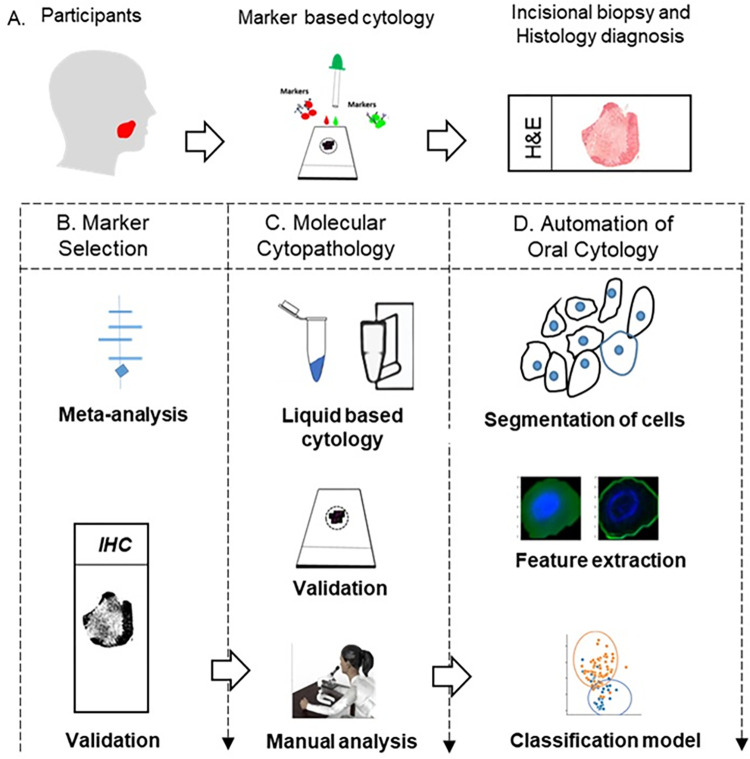
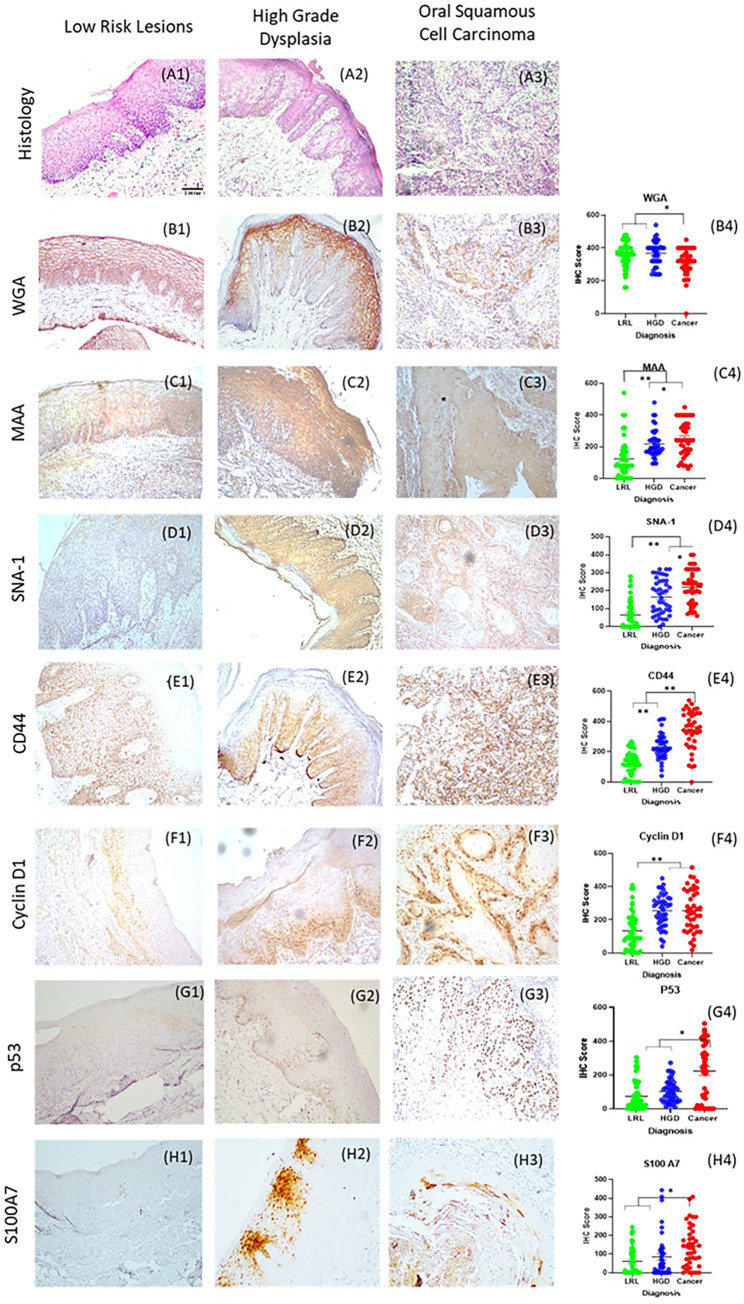
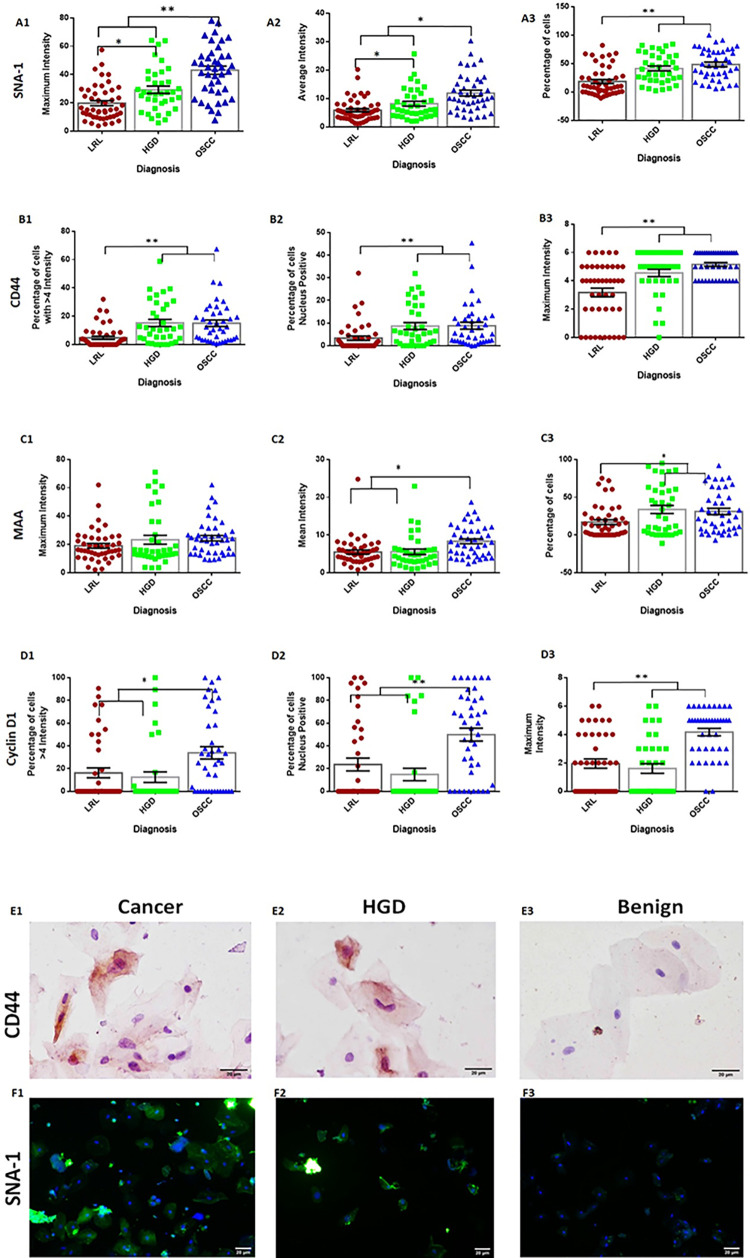
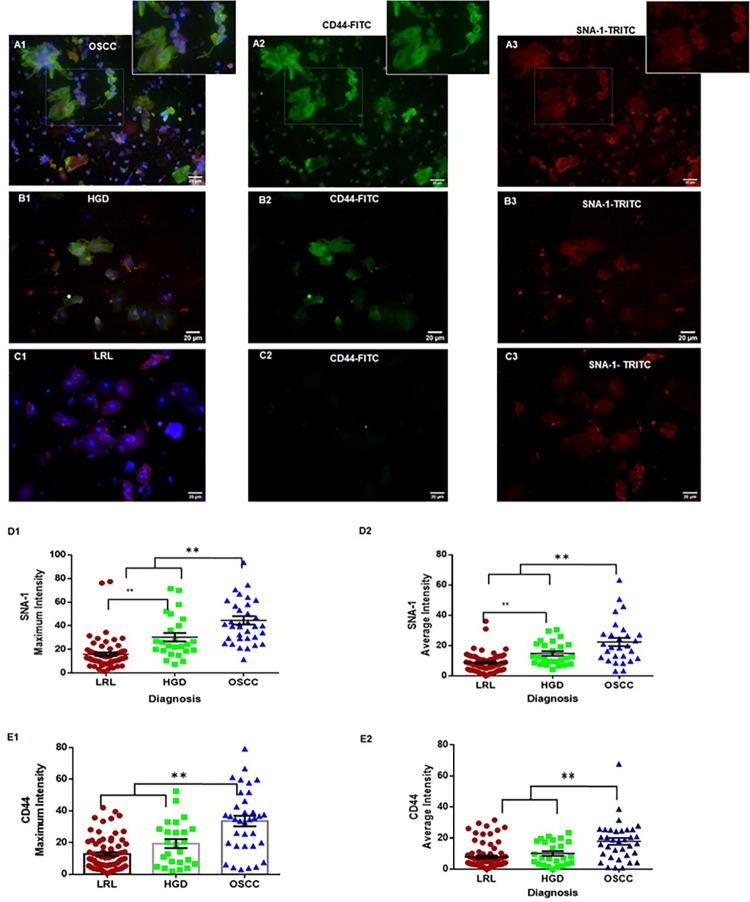
The high prevalence of oral potentially-malignant disorders exhibits diverse severity and risk of malignant transformation, which mandates a Point-of-Care diagnostic tool. Low patient compliance for biopsies underscores the need for minimally-invasive diagnosis. Oral cytology, an apt method, is not clinically applicable due to a lack of definitive diagnostic criteria and subjective interpretation. The primary objective of this study was to identify and evaluate the efficacy of biomarkers for cytology-based delineation of high-risk oral lesions. A comprehensive systematic review and meta-analysis of biomarkers recognized a panel of markers (n: 10) delineating dysplastic oral lesions. In this observational cross sectional study, immunohistochemical validation (n: 131) identified a four-marker panel, CD44, Cyclin D1, SNA-1, and MAA, with the best sensitivity (>75%; AUC>0.75) in delineating benign, hyperplasia, and mild-dysplasia (Low Risk Lesions; LRL) from moderate-severe dysplasia (High Grade Dysplasia: HGD) along with cancer. Independent validation by cytology (n: 133) showed that expression of SNA-1 and CD44 significantly delineate HGD and cancer with high sensitivity (>83%). Multiplex validation in another cohort (n: 138), integrated with a machine learning model incorporating clinical parameters, further improved the sensitivity and specificity (>88%). Additionally, image automation with SNA-1 profiled data set also provided a high sensitivity (sensitivity: 86%). In the present study, cytology with a two-marker panel, detecting aberrant glycosylation and a glycoprotein, provided efficient risk stratification of oral lesions. Our study indicated that use of a two-biomarker panel (CD44/SNA-1) integrated with clinical parameters or SNA-1 with automated image analysis (Sensitivity >85%) or multiplexed two-marker panel analysis (Sensitivity: >90%) provided efficient risk stratification of oral lesions, indicating the significance of biomarker-integrated cytopathology in the development of a Point-of-care assay.


Conflict of interest statement

The authors have declared that no competing interests exist.

Figures

Fig 1
Fig 1. Study design.
Participants were recruited according to inclusion and exclusion criteria, and individuals with oral lesions underwent brush biopsy (for marker-based cytology) followed by an incisional biopsy if indicated (A). Markers identified by systematic review and meta-analysis were validated in tissues (B). The liquid-based molecular cytology was performed with selected markers (C), single and multiplexed and marker expression was evaluated manually for the classification of oral cancer and HGD from Low-Risk lesions. The cytology image analysis was further automated by segmenting single cells, feature extraction of single cells and machine learning models developed (D). HGD: High Grade Dysplasia.
Fig 2
Fig 2. Workflow of image analysis and deep learning models.
Fluorescent microscopic cytology images contain epithelial clusters, blood cells, and artefacts along with single epithelial cells (A). Single epithelial cells were segmented using the U-Net model (B) and classified as atypical and normal cells using the Cancer-Net model (C), and quantitative features were extracted for developing the classification model.
Fig 3
Fig 3. Tissue validation of markers.
Histology (A1-A3), immunohistochemistry images and score of WGA (B1-B4), MAA (C1-C4), SNA-1(D1-D4), CD44 (E1-E4), CyclinD1(F1-F4) P53(G1-G4) and S100A7 (H1-H4) with scale bar 0.14 mm (objective 10x) were depicted. IHC scores of markers showed that expression in LRL is significantly less compared to HGD and/or OSCC. * <0.05; ** <0.005. ANOVA showed that SNA-1, CD44 and MAA significantly differentiated three cohorts LRL, HGD and OSCC. CyclinD1 delinated HGD OSCC from LRL. Graph represents mean±Standard error. LRL: Low Risk Lesions (Non-Dysplastic oral lesions; n: 50). HGD: High-Grade Dysplasia (Moderate/Severe Dysplasia; n: 40), OSCC: Oral Squamous Cell Carcinoma (n: 41).
Fig 4
Fig 4. Delineating OSCC and HGD from Low Risk Lesions.
Graph depicting Receiver Operating Characteristic (ROC) curve Analysis of immunohistochemistry (A,B) and multiplex-Immunocytology (C,D) validation of markers. Combination of markers delineated HRL/HGD from LRL by immunohistochemistry (AUC: 0.96). CD44 and SNA-1 showed best AUC in histology (A) and cytology (C, D) in delineating HRL and HGD. AUC: Area Under Curve, HGD: High Grade Dysplasia, HRL: High Risk Lesion (OSCC+HGD), LRL: Low Risk Lesions.
Fig 5
Fig 5. Immunocytology profile of MAA, CyclinD1, CD44 and SNA-1.
SNA-1 (A1-A3) and MAA (C1-C3) expression of each patient indicating the maximum intensity, average intensity and percentage of cells showing higher in the lesion site. The profile shows a significant increase as diseases progresses. CD44 (B1-B3) and CyclinD1 (D1-D3) expression parameters, percentage of cells with higher intensity (> 4 intensity score out of 6), nuclear positivity and maximum intensity showed significantly less expression in LRL compared to HGD/OSCC. * <0.05; ** <0.005. Graph represent mean ± Standard error. LRL: Low Risk Lesions (Non-Dysplastic and mild dysplastic oral lesion). HGD: High-Grade Dysplasia (Moderate/Severe Dysplasia), OSCC: Oral Squamous cell carcinoma, HRL: High Risk Lesions (OSCC+HGD). SNA-1 (FITC conjugated and DAPI staining, E1- E3; Magnification 20x objective) and CD44 (F1-F3; Magnification 40x objective) staining of cells from OSCC, HGD and benign subjects. Images of OSCC and HGD patients shows high staining compared benign subjects.
Fig 6
Fig 6. Multiplex validation of SNA-1 and CD44.
Multiplex cytology images (FITC conjugated CD44; TRITC conjugated SNA-1; scale bar 20μm, Objective 20X) from the patient cohorts; OSCC (A1-A3), HGD (B1-B3) and LRL (C1-C3). SNA-1 expression (D1, D2) showed significantly high in OSCC/HGD. CD44 (E1, E2) expression showed significantly higher in OSCC. * <0.05; ** <0.005. Graph represent mean ± Standard error. LRL: Low Risk Lesions. HGD: High Grade Dysplasia, OSCC: Oral Squamous cell carcinoma, HRL: High Risk Lesions (OSCC+HGD).
Fig 7
Fig 7. Classification of cells using Cancer-Net model.
The Cancer-Net model was employed for classification of segmented single epithelial cells (A). The occlusal maps (visual representation of the regions of interest) showed that nucleus, and cytoplasm around nucleus were used by Cancer-Net model for atypical cell classification. The cell, heat map (occlusal map) and overlay with cell are depicted (B). The training/cross validation metrics for differentiating normal and atypical cells (C1-C3) showed F1Score above 0.90.

Similar articles

Cited by

References

    1. Bray F, Ferlay J, Soerjomataram I, Siegel RL, Torre LA, Jemal A. Global cancer statistics 2018: GLOBOCAN estimates of incidence and mortality worldwide for 36 cancers in 185 countries. CA: a cancer journal for clinicians. 2018;68(6):394–424. doi: 10.3322/caac.21492 . - DOI - PubMed
    1. Coelho KR. Challenges of the oral cancer burden in India. Journal of cancer epidemiology. 2012;2012:701932. doi: 10.1155/2012/701932 . - DOI - PMC - PubMed
    1. Birur PN, Patrick S, Warnakulasuriya S, Gurushanth K, Raghavan SA, Rath GK, et al.. Consensus guidelines on management of oral potentially malignant disorders. Indian journal of cancer. 2022;59(3):442–53. Epub 2022/11/23. doi: 10.4103/ijc.IJC_128_21 . - DOI - PubMed
    1. Sankaranarayanan R, Ramadas K, Thomas G, Muwonge R, Thara S, Mathew B, et al.. Effect of screening on oral cancer mortality in Kerala, India: a cluster-randomised controlled trial. Lancet. 2005;365(9475):1927–33. doi: 10.1016/S0140-6736(05)66658-5 . - DOI - PubMed
    1. Messadi DV. Diagnostic aids for detection of oral precancerous conditions. International Journal of Oral Science. 2013;5(2):59–65. doi: 10.1038/ijos.2013.24 - DOI - PMC - PubMed

Publication types