. 2023 Sep 25;19(9):e1011483.
doi: 10.1371/journal.pcbi.1011483. eCollection 2023 Sep.

Measuring uncertainty in human visual segmentation

Affiliations

Measuring uncertainty in human visual segmentation

Jonathan Vacher et al. PLoS Comput Biol. .

Abstract

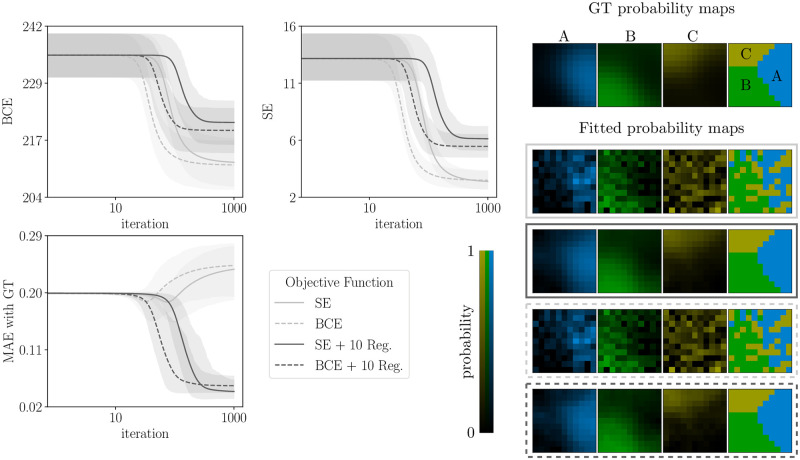
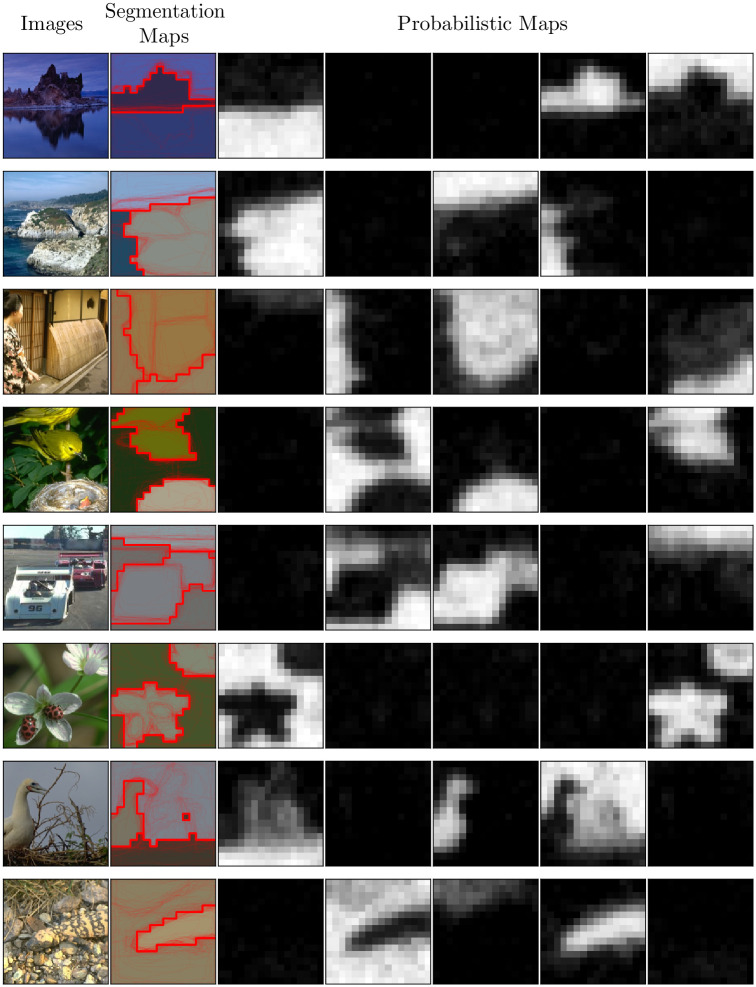
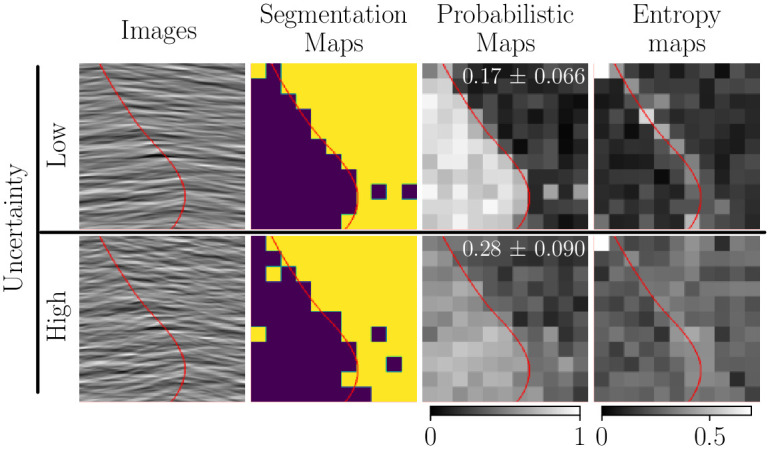
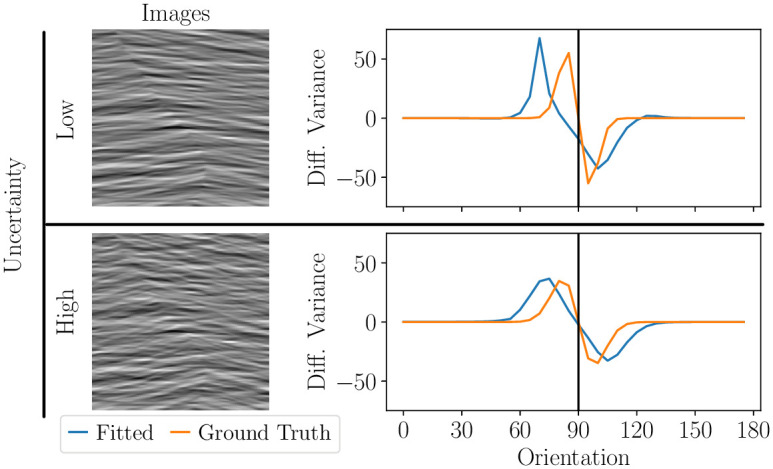
Segmenting visual stimuli into distinct groups of features and visual objects is central to visual function. Classical psychophysical methods have helped uncover many rules of human perceptual segmentation, and recent progress in machine learning has produced successful algorithms. Yet, the computational logic of human segmentation remains unclear, partially because we lack well-controlled paradigms to measure perceptual segmentation maps and compare models quantitatively. Here we propose a new, integrated approach: given an image, we measure multiple pixel-based same-different judgments and perform model-based reconstruction of the underlying segmentation map. The reconstruction is robust to several experimental manipulations and captures the variability of individual participants. We demonstrate the validity of the approach on human segmentation of natural images and composite textures. We show that image uncertainty affects measured human variability, and it influences how participants weigh different visual features. Because any putative segmentation algorithm can be inserted to perform the reconstruction, our paradigm affords quantitative tests of theories of perception as well as new benchmarks for segmentation algorithms.


Conflict of interest statement

The authors have declared that no competing interests exist.

Figures

Fig 1
Fig 1. Inference of segmentation maps from pairwise same/different judgments.
Top: Reconstruction of a deterministic segmentation map from simulated data (simulation details in section Materials and methods, subsection Implementation and algorithm). The leftmost panel shows the ground-truth probability map, namely the probability that each pixel belongs to the segment labeled ‘A’ (blue), and similarly for the second (segment ‘B’, green) and third (segment ‘C’, yellow) panel. The fourth panel from the left shows the full segmentation map, namely, for each pixel, the label of the segment with the highest probability. The four panels on the right show the corresponding maps reconstructed with the numerical procedure described in section Materials and methods, subsection Inference of probabilistic segments. Bottom-left: outline of a trial of the segmentation experiment: the participant reports whether the two locations indicated by the red dots belong to the same segment. Bottom-right: for one participant, the reconstructed probability maps (left) and corresponding segmentation map (right), obtained using spatial regularization (see section Materials and methods, subsection Spatial regularization).
Fig 2
Fig 2. Equivalence of loss functions and effects of regularization.
Top left: value of the BCE loss when we optimize for BCE (dashed lines) or for SE (continuous lines). Top center: same but for SE loss. Bottom left: value of the reconstruction MAE. In all panels, the shaded areas represent 95% bootstrap error bars over 1000 simulations. Right: ground truth (GT) probabilistic maps and reconstructed probabilistic maps for each objective function indicated in the legend. The mention “10 Reg.” means that we use regularization with λ = 10.
Fig 3
Fig 3. Optimal choice of tested pairs.
Red dots denote the optimal choice of pixels to be paired with the pixel i, in the case of a deterministic segmentation map.
Fig 4
Fig 4. Accurate inference of segmentation maps from limited data.
Left : the MAE between reconstructed maps and ground truth (GT) as a function of the number of blocks (with and without regularization, light and dark gray respectively). Shaded areas represent 95% bootstrap error bars. Top–Right: ground truth maps. Center–Right: reconstructed maps without regularization from 1 block (left) and 128 blocks (right). Bottom–Right: same as Center–Right but with regularization. The mention “10 Reg.” means that we use regularization with λ = 10.
Fig 5
Fig 5. Accurate inference of segmentation maps from variable data.
Left: the MAE between reconstructed maps and ground truth (GT) as a function of the uncertainty (with and without regularization, light and dark gray respectively). Shaded areas represent 95% bootstrap error bars. Top–Right: ground truth maps. Center–Right: reconstructed maps without regularization from low (left) and high (right) uncertainty. Bottom–Right: same as Center-Right but with regularization. The mention “10 Reg.” means that we use regularization with λ = 10.
Fig 6
Fig 6. Human Segmentation of Natural Images.
From left to right: the original images, the corresponding segmentation maps, and the five corresponding probabilistic maps. Maps were reconstructed with regularization (λ = 5).
Fig 7
Fig 7. Variability in human segmentation reflects image uncertainty.
From left to right: tested images, segmentation maps, probabilistic maps of the left region and entropy maps corresponding to the reconstructed probabilistic maps i.e. pi[1] log (pi[1]) + pi[2] log (pi[2]) (average entropy ± 3 standard errors is indicated by the text in white). Top: low uncertainty case (texture orientation distributions are weakly overlapping). Bottom: high uncertainty case (texture orientation distributions are strongly overlapping). In all panels, the red line represents the ground truth boundary between the two segments (shown only for visualization purposes, not in the real experiments). Maps are reconstructed without regularization (λ = 0).
Fig 8
Fig 8. Validation of the parametric approach.
Reconstruction using a parametric model for the class probabilities (Eq (10)). Reconstruction was achieved minimizing the SE with regularization (λ = 1) Left: probabilistic maps and segmentation maps. Right: features displayed as an image and as 3d points in the RGB cube with the planes separating each pair of segments.
Fig 9
Fig 9. Uncertainty modulates the perceptual mapping between features and segments.
Left: tested images (same images and data as Fig 7). Right: differential variance (or weight vector, see main text) best relating oriented wavelet features to human responses. Top: low uncertainty case (texture orientation distributions are weakly overlapping). Bottom: high uncertainty case (texture orientation distributions are strongly overlapping). Maps are reconstructed without regularization (λ = 0).

Update of

References

    1. Wagemans J, Elder JH, Kubovy M, Palmer SE, Peterson MA, Singh M, et al. A century of Gestalt psychology in visual perception: I. Perceptual grouping and figure–ground organization. Psychological bulletin. 2012;138(6):1172. doi: 10.1037/a0029333 - DOI - PMC - PubMed
    1. Li Z. Contextual influences in V1 as a basis for pop out and asymmetry in visual search. Proceedings of the National Academy of Sciences. 1999;96(18):10530–10535. doi: 10.1073/pnas.96.18.10530 - DOI - PMC - PubMed
    1. Li Z. Visual segmentation by contextual influences via intra-cortical interactions in the primary visual cortex. Network. 1999;10(2):187–212. doi: 10.1088/0954-898X_10_2_305 - DOI - PubMed
    1. Li W, Piëch V, Gilbert CD. Contour saliency in primary visual cortex. Neuron. 2006;50(6):951–962. doi: 10.1016/j.neuron.2006.04.035 - DOI - PubMed
    1. Pasupathy A. The neural basis of image segmentation in the primate brain. Neuroscience. 2015;296:101–109. doi: 10.1016/j.neuroscience.2014.09.051 - DOI - PMC - PubMed

Publication types