. 2023 Sep 25;19(9):e1011487.
doi: 10.1371/journal.ppat.1011487. eCollection 2023 Sep.

Neuronal Ndst1 depletion accelerates prion protein clearance and slows neurodegeneration in prion infection

Affiliations

Neuronal Ndst1 depletion accelerates prion protein clearance and slows neurodegeneration in prion infection

Patricia Aguilar-Calvo et al. PLoS Pathog. .

Abstract

Select prion diseases are characterized by widespread cerebral plaque-like deposits of amyloid fibrils enriched in heparan sulfate (HS), a abundant extracellular matrix component. HS facilitates fibril formation in vitro, yet how HS impacts fibrillar plaque growth within the brain is unclear. Here we found that prion-bound HS chains are highly sulfated, and that the sulfation is essential for accelerating prion conversion in vitro. Using conditional knockout mice to deplete the HS sulfation enzyme, Ndst1 (N-deacetylase / N-sulfotransferase) from neurons or astrocytes, we investigated how reducing HS sulfation impacts survival and prion aggregate distribution during a prion infection. Neuronal Ndst1-depleted mice survived longer and showed fewer and smaller parenchymal plaques, shorter fibrils, and increased vascular amyloid, consistent with enhanced aggregate transit toward perivascular drainage channels. The prolonged survival was strain-dependent, affecting mice infected with extracellular, plaque-forming, but not membrane bound, prions. Live PET imaging revealed rapid clearance of recombinant prion protein monomers into the CSF of neuronal Ndst1- deficient mice, neuronal, further suggesting that HS sulfate groups hinder transit of extracellular prion protein monomers. Our results directly show how a host cofactor slows the spread of prion protein through the extracellular space and identify an enzyme to target to facilitate aggregate clearance.


Conflict of interest statement

I have read the journal’s policy and the authors of this manuscript have the following competing interests: JJI serves as the Chair for the Scientific Advisory Board for the company Applied Cognition, Inc, from which he receives compensation and in which he holds an equity stake.

Figures
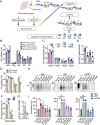
Fig 1
Fig 1. Mouse and human PrPSc bind highly sulfated HS.
(A) Schematic of HS purification from brain lysate or purified PrPSc for mass spectrometry analysis (a subset of the latter samples was previously published [46,79]). (B) Quantification of unsulfated (NAc and NH2) and sulfated (NS, 2S, and 6S) HS, (C) individual HS disaccharides, and (D) average sulfation per disaccharide of HS bound to PrPSc as compared to brain lysates (same brain) (n = 3 mice per strain). (E) Quantification of unsulfated and sulfated HS from sCJD-affected brain, (F) individual HS disaccharides, and (G) average sulfation per disaccharide of HS bound to PrPSc as compared to brain lysates (same brain). N = 3 per group (occipital cortex). (H) Representative western blots and (I) quantification of PrPSc-seeded PMCA in the presence or absence of heparin or heparin desulfated at positions N-, 6-O, or 2-O (No seed: no PrPSc, No hep: no heparin, Low hep: 225 μg/ml of heparin, High hep: 2.225 mg/ml of heparin, N-, 6-O-, or 2-O-desulfated heparin: 225 μg/ml). N = 3–4 experimental replicates. Note for panels C and F, other disaccharides were not significantly different (shown in S1–S3 Tables). *P< 0.05, **P< 0.01, ***P< 0.005 and ****P< 0.001, two-way ANOVA with Bonferroni’s post test comparing within a single strain (panels B, C, E, and F), unpaired two-tailed t-test with Bonferroni’s post test (panels D and G), and one-way ANOVA with Tukey’s post test (panel I). NAc: N-acetylglucosamine (GlcNAc); NH2: glucosamine (GlcNH2); NS: N-sulfated glucosamine (GlcNS); 2S: 2-O-sulfated glucuronic or iduronic acids (2-O-S); 6S: 6-O-sulfated glucosamine (6-O-S); PK: proteinase K. Panel A created with BioRender.com.
Fig 2
Fig 2. Reducing neuronal HS sulfation prolongs survival and lessens plaque load in prion-affected mice.
(A) Schematic illustrates mCWD prion inoculation and tissue collection. (B) Survival curves for mCWD-infected SynCre- (n = 10) and SynCre+ mice (n = 15). (C) Representative images reveal mCWD prion plaques in the corpus callosum (CC) of SynCre- mice and within vessels of the velum interpositum (VI) and hippocampus (HP) of SynCre+ mice. Higher magnification depicted in right panels. Scale bars represent 500 μm (left) and 50 μm (right). (D) Pie charts show the plaque distribution in brain. VI and cerebellar (CB) aggregates were primarily vascular (meninges) (n = 6 SynCre- and 9 SynCre+ mice). S6 Table indicates the plaque number in each brain area. (E) Representative images of PrPSc immunolabelled plaques in CC. Scale bar = 50 μm. (F) Quantification of the plaque length (CC) (n = 33 and 38 plaques in SynCre- and SynCre+, respectively) (n = 4 mice per genotype). (G) Representative example of dual immunolabelled mCWD-infected brain sections for PrPSc and endothelial cells (CD31) (parenchymal plaques: corpus callosum; SynCre- vascular plaque: basal ganglia; SynCre+ vascular plaque: thalamus). Scale bar represents 50 μm. (H) Quantification of parenchymal (par) and vascular (vasc) plaques in cerebral cortex, septum, corpus callosum, hippocampus, thalamus, cerebral peduncle, hypothalamus, cerebellar peduncle, velum interpositum, cerebellum, and medulla. N = 6 SynCre- and 9 SynCre+ mice. *P< 0.05, **P< 0.01, ***P< 0.005, and ****P< 0.001, Log-rank (Mantel-Cox) test (panel B), unpaired two-tailed t-test with Bonferroni’s post test (panel F), and two-way ANOVA with Bonferroni’s post test (panel H). TH thalamus, BG: basal ganglia, and CT: cerebral cortex. Panel A created with BioRender.com.
Fig 3
Fig 3. Reducing neuronal HS sulfation increases mCWD solubility and decreases fibril length.
(A) Representative western blot of mCWD aggregates after PK digestion and centrifugation over an Optiprep layer (P = pellet, S = supernatant). (B) Quantification of PrPSc in pellet and supernatant fractions. N = 6 samples per genotype. (C) Representative electron microscopy images of purified PrPSc fibrils from mCWD-infected mice. Scale bars represent 100 nm. Fibril measurements (bottom panel) are 193 nm (SynCre-) and 144 nm (SynCre+). (D) Quantification of the fibril lengths. N = 49 and 42 fibrils measured from SynCre- and SynCre+ brains, respectively (n = 6 mice per genotype). *P< 0.05, unpaired two-tailed t-test with Bonferroni’s post test (panels B and D).
Fig 4
Fig 4. Rapid transit of Zr89-recPrP through the brain and spinal cord of live Ndst1f/ftga20+/+SynCre+ mice.
(A) Schematic shows the conjugation, radiolabeling, and stereotaxic injection of recPrP into anesthetized Ndst1f/ftga20+/+SynCre+ and SynCre- mice. (B) Representative PET scan images (coronal (C), axial (A) and sagittal (S) sections) of Zr89-recPrP in SynCre- and SynCre+ mice immediately after injection into the caudate putamen (day 0) and 20 hours later (day 1) in n = 6 animals per genotype (two experiments). Graphs show (C) radioactive recPrP in the spinal cord at day 0 and day 1 relative to the total PET signal area, as well as (D) the total PET signal area at day 1 relative to day 0 (sagittal, brain and spinal cord) and (E) the high PET intensity signal area (signal > 100 μCi) at day 1 relative to day 0. Panel C shows only one experiment. *P< 0.05, **P< 0.01, and ****P< 0.001, two-way ANOVA with Bonferroni’s post-test (panel C), and unpaired two-tailed t-test with Bonferroni’s post test (panels D and E). Panels A and B created with BioRender.com.

References

    1. Henderson MX, Cornblath EJ, Darwich A, Zhang B, Brown H, Gathagan RJ, et al. Spread of α-synuclein pathology through the brain connectome is modulated by selective vulnerability and predicted by network analysis. Nat Neurosci. 2019;22(8):1248–57. doi: 10.1038/s41593-019-0457-5 PMCID: PMC6662627 - DOI - PMC - PubMed
    1. Jucker M, Walker LC. Self-propagation of pathogenic protein aggregates in neurodegenerative diseases. Nature. 2013;501(7465):45–51. doi: 10.1038/nature12481 - DOI - PMC - PubMed
    1. Thal DR, Rüb U, Orantes M, Braak H. Phases of A beta-deposition in the human brain and its relevance for the development of AD. Neurology. 2002;58(12):1791–800. doi: 10.1212/wnl.58.12.1791 - DOI - PubMed
    1. Raj A, LoCastro E, Kuceyeski A, Tosun D, Relkin N, Weiner M. Network Diffusion Model of Progression Predicts Longitudinal Patterns of Atrophy and Metabolism in Alzheimer’s Disease. Cell reports. 2015;10(3):359–69. doi: 10.1016/j.celrep.2014.12.034 PMCID: PMC5747552 - DOI - PMC - PubMed
    1. Aguzzi A, Rajendran L. The transcellular spread of cytosolic amyloids, prions, and prionoids. Neuron. 2009;64(6):783–90. doi: 10.1016/j.neuron.2009.12.016 - DOI - PubMed

Publication types