. 2023 Nov;623(7987):594-600.
doi: 10.1038/s41586-023-06649-6. Epub 2023 Sep 25.

A molnupiravir-associated mutational signature in global SARS-CoV-2 genomes

Affiliations

A molnupiravir-associated mutational signature in global SARS-CoV-2 genomes

Theo Sanderson et al. Nature. 2023 Nov.

Abstract

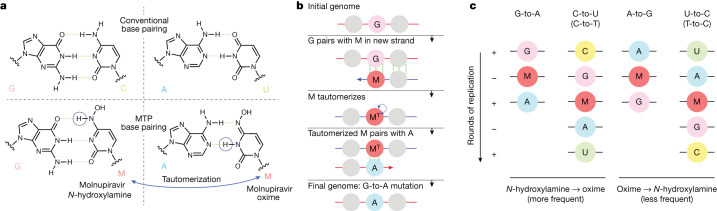
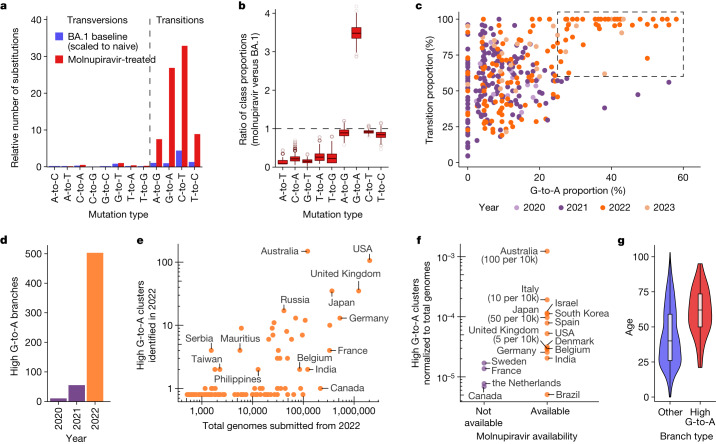
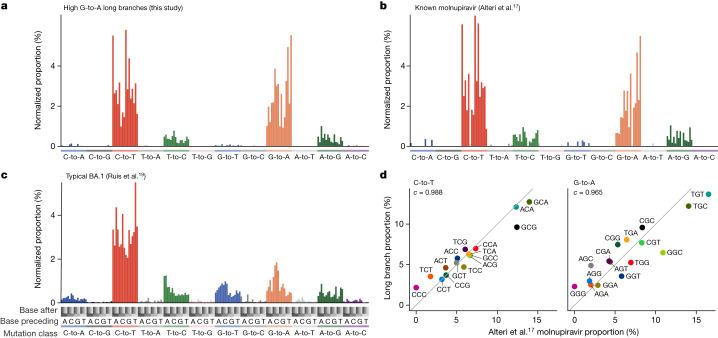
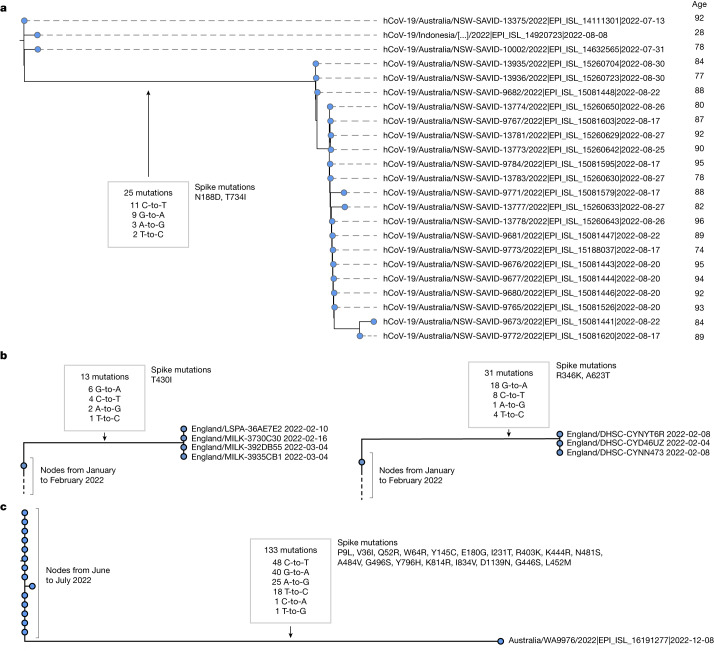
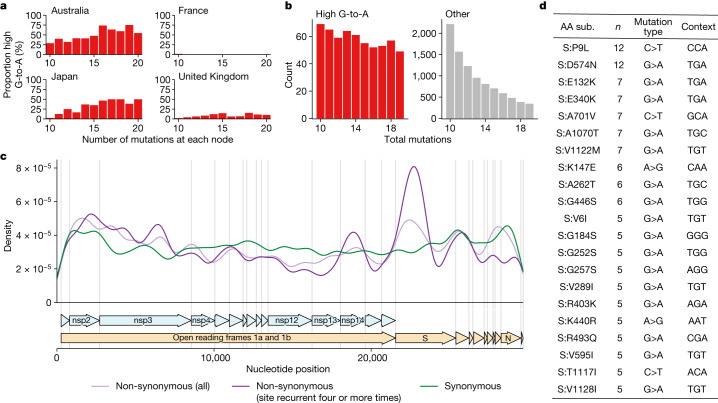
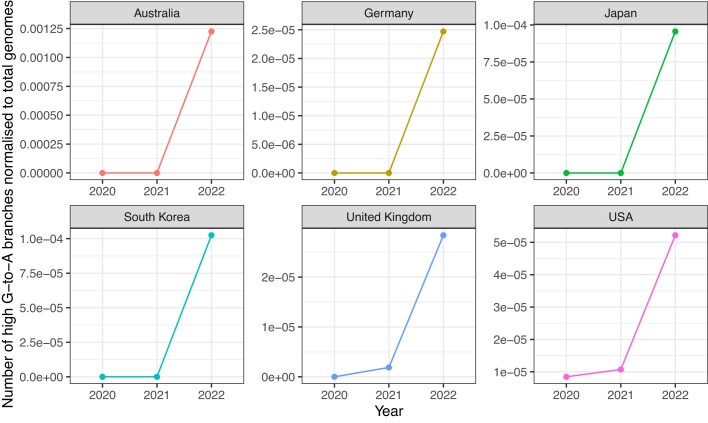
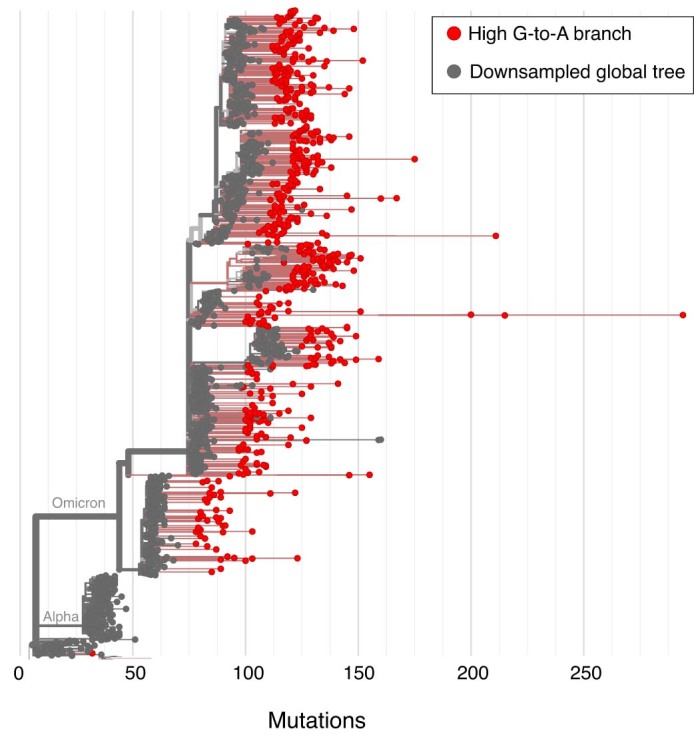
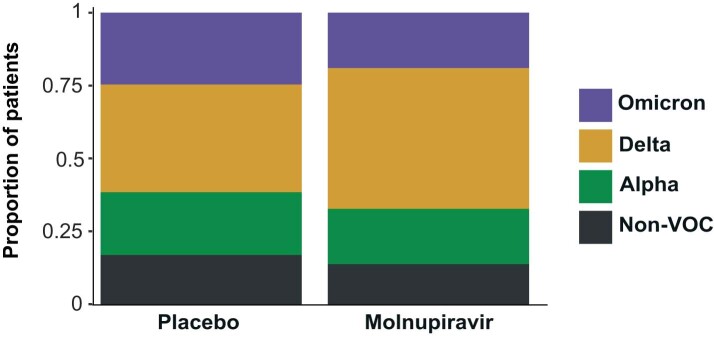
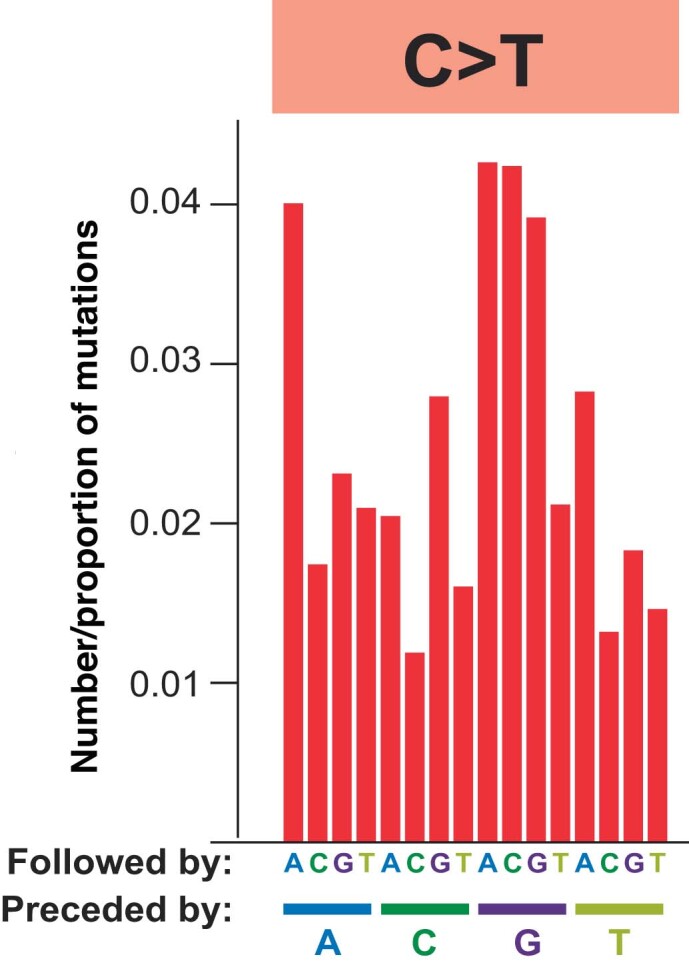
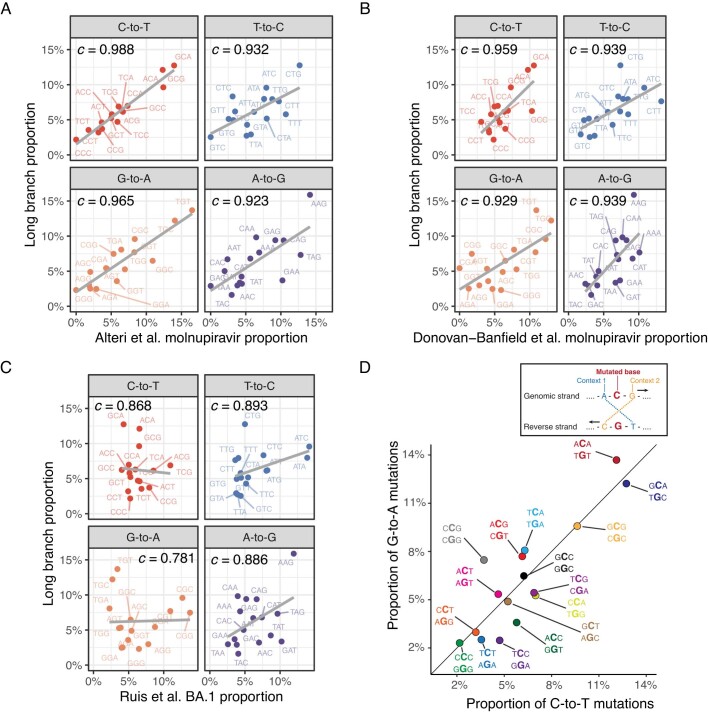
Molnupiravir, an antiviral medication widely used against severe acute respiratory syndrome coronavirus 2 (SARS-CoV-2), acts by inducing mutations in the virus genome during replication. Most random mutations are likely to be deleterious to the virus and many will be lethal; thus, molnupiravir-induced elevated mutation rates reduce viral load1,2. However, if some patients treated with molnupiravir do not fully clear the SARS-CoV-2 infections, there could be the potential for onward transmission of molnupiravir-mutated viruses. Here we show that SARS-CoV-2 sequencing databases contain extensive evidence of molnupiravir mutagenesis. Using a systematic approach, we find that a specific class of long phylogenetic branches, distinguished by a high proportion of G-to-A and C-to-T mutations, are found almost exclusively in sequences from 2022, after the introduction of molnupiravir treatment, and in countries and age groups with widespread use of the drug. We identify a mutational spectrum, with preferred nucleotide contexts, from viruses in patients known to have been treated with molnupiravir and show that its signature matches that seen in these long branches, in some cases with onward transmission of molnupiravir-derived lineages. Finally, we analyse treatment records to confirm a direct association between these high G-to-A branches and the use of molnupiravir.


Conflict of interest statement

The authors declare no competing interests.

Figures

Fig. 1
Fig. 1. Molnupiravir induces mutations by acting as a nucleotide analogue with multiple tautomeric forms that pair preferentially with different nucleotides.
a, Molnupiravir triphosphate can assume multiple tautomeric forms that resemble different nucleotides. The N-hydroxylamine form resembles cytosine (C); like cytosine, it can pair with guanine (G) while the oxime form more closely resembles uracil (U) and thus can pair with adenine (A) (figure adapted in part from Malone and Campbell). b, In the most common scenario, molnupiravir (M) is incorporated in the N-hydroxylamine form opposite a G nucleotide. It can then tautomerize into the oxime form, which can then pair to an A in subsequent replication, creating a G-to-A mutation. c, Molnupiravir can result in four different mutation types. In the first column, a G-to-A mutation is created by M incorporation opposite a positive-sense G, which can then pair with an A in the next positive-sense synthesis. In the second column, the positive-sense genome contains a C, which results in a G in the negative-sense genome. This G can then undergo the same G-to-A mutation, creating a negative-sense A that finally results in a U in the positive-sense genome, meaning that the entire process results in a C-to-U mutation. Although the biases of tautomeric forms for the free and incorporated MTP nucleotides favour this directionality of mutations, with M incorporated in the N-hydroxylamine form and then transitioning to the oxime form, the reverse can also occur: this results in A-to-G and U-to-C mutations.
Fig. 2
Fig. 2. A molnupiravir-associated mutational signature with high G-to-A and high transition ratio emerged in 2022 in some countries in global sequencing databases.
a, Comparison of the relative rate of different classes of mutations in typical BA.1 mutations versus those with molnupiravir treatment (molnupiravir data from Alteri et al. and naive data from Ruis et al., scaled to total mutations in naive individuals from Alteri et al.; Methods) confirms an elevated rate of transitions, and particularly C-to-T and G-to-A mutations. b, Differences in the proportion of mutations of different mutation classes in individuals treated with molnupiravir (Alteri et al.) versus typical BA.1 mutations (Ruis et al.) highlight elevated G-to-A proportion as especially indicative of molnupiravir. These are ratios of proportions, so the apparent reduction in transversions does not require an absolute decrease in the number of transversions but can instead be caused by the increased number of transitions. The box plots depict variation over 1,000 bootstrap resamplings, with boxes showing the 25th, 50th and 75th percentiles, and the whiskers having a length 1.5× the interquartile range. c, A scatter plot where each point is a branch with more than 20 mutations, positioned according to the proportion of these mutations that are G-to-A (x axis) or transitions (y axis), reveals a space with elevated G-to-A and transition rate that occurs only with the roll-out of molnupiravir in 2022. d, A change at the same time point is seen when plotting the number of nodes with more than ten mutations and with G-to-A proportion greater than 25%, C-to-T proportion greater than 20% and transition proportion greater than 90%. e, Plotting the number of high G-to-A nodes identified in 2022 against the number of total genomes for each country revealed considerable variation. f, Countries confirmed to have made molnupiravir available had more high G-to-A nodes than countries that did not. The numbers in brackets represent the number of courses of molnupiravir supplied, normalized to population. P = 0.02 for a log-transformed, two-sided t-test. g, Age distribution for US nodes, partitioned according to whether they satisfy the high G-to-A criteria (P < 1 × 10−10, two-sided t-test). Age metadata are missing for some samples, probably non-randomly. Dataset sizes are n = 106 for the high G-to-A branches and n = 2,472 for the other branches. Where a node had many descendants of different ages, age was assigned using a basic heuristic, as described in the Methods. The box plot depicts the minimum, maximum, and the 25th, 50th and 75th percentiles.
Fig. 3
Fig. 3. Mutation spectrum analysis supports high G-to-A branches being driven by molnupiravir.
ac, Single-base substitution mutation spectra for high G-to-A branches (a), individuals known to have been treated with molnupiravir (b) and typical BA.1 spectra (c). Each individual bar represents a particular type of mutation in a particular trinucleotide context (Extended Data Fig. 4). Bars are grouped and coloured according to the class of mutation. Within each coloured group, bars are grouped into four groups according to the nucleotide preceding the mutated residue; then, each of these groups contains four bars according to the nucleotide following the mutated residue. The number of mutations has been normalized to the number of times the trinucleotide occurs in the reference genome, and then normalized so that the entire spectrum sums to 1. d, High correlations between spectra from Alteri et al. from patients known to have been treated with molnupiravir, and the spectra from high G-to-A branches identified in this study. Each point represents the normalized proportion of a particular trinucleotide context. Points are coloured so that a context for C-to-T mutations has the same colour as its reverse complement in G-to-A. The values denoted by c are cosine similarity scores.
Fig. 4
Fig. 4. High G-to-A branches can be associated with transmission clusters and, separately, can involve more than 100 mutations.
a, A cluster of 20 individuals emerging from a high G-to-A mutation event. This cluster involves a saltation of 25 mutations occurring within approximately one month, all of which are transition substitutions, with an elevated G-to-A rate. Sequences were annotated with age metadata suggestive of an outbreak in an aged care facility. Phylogenetic placement within the cluster is affected by missing coverage in some regions. b, Examples of further transmission clusters from the UK. Left, four sequences from the UK from February to March 2022 with 13 shared mutations with the high G-to-A signature. Right, a cluster of four sequences from the UK from February 2022 with 31 shared mutations with the high G-to-A signature. c, A sequence from Australia with a high G-to-A signature and a total of 133 mutations relative to the closest outgroup sequence. Just 2 of the 133 mutations observed were transversions; transitions included many G-to-A events. (In the month after this sequence was deposited, two additional related or descendant sequences, EPI_ISL_16315710 and EPI_ISL_16639468, were deposited, which may represent continued sampling from the same patient as they involve a substantial subset of shared mutations, but not full concordance, which is suggestive of complex intrahost evolution).
Fig. 5
Fig. 5. High G-to-A branches make up a considerable proportion of long branches in affected countries and include evidence of selection.
a, Proportion of branches that are high G-to-A for a range of branch lengths in different countries. Data are from collection dates in 2022 and 2023 (submission dates up to June 2023). b, Branch length distributions for high G-to-A and other branches. c, Genomic distribution of mutations in high G-to-A nodes, partitioned into three classes: synonymous mutations; non-synonymous mutations; and non-synonymous mutations that occur four or more times. d, Table of the most recurrent mutations in S in high G-to-A branches. n = the number of high G-to-A branches exhibiting the mutation. Mutation type shows the parental and final nucleotide at the nucleotide position driving the mutation, while context shows the trinucleotide context for the mutated nucleotide, transcribed assuming a NC_045512.2 background.
Extended Data Fig. 1
Extended Data Fig. 1. Timeline of number of high G-to-A branches, normalised for sequencing volumes, in 6 countries.
The y-axis represents number of high G-to-A branches, divided by total sequencing volume for the year. This analysis demonstrates that the effects seen in raw numbers in Fig. 2d cannot be explained by changes in sequencing volume.
Extended Data Fig. 2
Extended Data Fig. 2. High G-to-A sequences with more than 20 private mutations identified from a Nextclade alignment of all available SARS-CoV-2 sequences.
Nextclade was used to align sequences and identify private mutations. High G-to-A branches were identified on the basis of unlabelled private mutations. Usher.bio was then used to create a tree with high G-to-A branches highlighted on a downsampled global tree, with visualisation performed with Nextstrain.
Extended Data Fig. 3
Extended Data Fig. 3. Distribution of major SARS-CoV-2 variants between placebo and molnupiravir treatments in the AGILE trial dataset.
The proportion of patients infected with each variant is shown. The proportions are similar suggesting that differences between placebo and molnupiravir spectra will not be influenced by previously observed spectrum differences between variants (Ruis et al., Bloom et al.). VOC = variant of concern.
Extended Data Fig. 4
Extended Data Fig. 4. Context locations within the mutational spectrum.
The RNA mutational spectrum contains 12 mutation types, for example C-to-T, shown here. The spectrum also captures the nucleotides surrounding each mutation. There are four potential upstream nucleotides and four potential downstream nucleotides. This figure shows the location of each of the 16 contexts within an example mutation type. For example, the leftmost bar represents C-to-T mutations in the ACA context while the second leftmost bar represents C-to-T mutations in the ACC context. The spectrum represented is from AGILE trial data on monlupiravir.
Extended Data Fig. 5
Extended Data Fig. 5. Mutation spectrum analysis supports a molnupiravir origin for high G-to-A nodes.
(A) Strong correlation for contexts in all transition mutation classes between Alteri et al. molnupiravir-treated patients and high G-to-A long branches. (B) Similar analysis, with clear correlation between Donovan-Banfield et al. dataset of molnupiravir treated individuals to long high G-to-A branches. (C) Little correlation seen between contexts in typical SARS-CoV-2 evolution (Ruis et al.) and high G-to-A branches. (D) In data from long branches, context proportions for G-to-A mutations correlate with context proportions for C-to-T mutations, indicating a common mutational process. Points are labelled with G-to-A context, then C-to-T context.

Similar articles

Cited by

References

    1. Rosenke K, et al. Orally delivered MK-4482 inhibits SARS-CoV-2 replication in the Syrian hamster model. Nat. Commun. 2021;12:2295. doi: 10.1038/s41467-021-22580-8. - DOI - PMC - PubMed
    1. Butler, C. C. et al. Molnupiravir plus usual care versus usual care alone as early treatment for adults with COVID-19 at increased risk of adverse outcomes (PANORAMIC): an open-label, platform-adaptive randomised controlled trial. Lancet401, 281–293 (2023). - PMC - PubMed
    1. Extance A. Covid-19: what is the evidence for the antiviral molnupiravir? BMJ. 2022;377:o926. doi: 10.1136/bmj.o926. - DOI - PubMed
    1. Jayk Bernal A, et al. Molnupiravir for oral treatment of Covid-19 in nonhospitalized patients. N. Engl. J. Med. 2022;386:509–520. doi: 10.1056/NEJMoa2116044. - DOI - PMC - PubMed
    1. NICE Recommends 3 Treatments for COVID-19 in Draft Guidance. National Institute for Health and Care Excellencehttps://www.nice.org.uk/news/article/nice-recommends-3-treatments-for-co... (2022).

MeSH terms